
Electric Submersible Cables Market
Electric Submersible Cables Market Forecasts to 2030 - Global Analysis by Cable Type (ESP Flat Power Cable and ESP Round Power Cable), Material (Polyvinyl Chloride (PVC), Ethylene Propylene Rubber (EPR), Polyethylene (PE) and Other Materials), Voltage Rating, Application and By Geography

|
Years Covered |
2022-2030 |
|
Estimated Year Value (2024) |
US $5.9 BN |
|
Projected Year Value (2030) |
US $9.05 BN |
|
CAGR (2024- 2030) |
7.1% |
|
Regions Covered |
North America, Europe, Asia Pacific, South America, and Middle East & Africa |
|
Countries Covered |
US, Canada, Mexico, Germany, UK, Italy, France, Spain, Japan, China, India, Australia, New Zealand, South Korea, Rest of Asia Pacific, South America, Argentina, Brazil, Chile, Middle East & Africa, Saudi Arabia, UAE, Qatar, and South Africa |
|
Largest Market |
North America |
|
Highest Growing Market |
Asia Pacific |
According to Stratistics MRC, the Global Electric Submersible Cables Market is accounted for $5.9 billion in 2024 and is expected to reach $9.05 billion by 2030 growing at a CAGR of 7.1% during the forecast period. Electric Submersible Cables are specifically constructed cables that transfer electrical power to submersible devices, typically in water or other liquid environments. Applications where submersible pumps, motors, and other electrical equipment function underwater, such deep-sea research, oil and gas production, and water treatment facilities, depend on these cables. Because of their robust, waterproof, and corrosion-resistant design, the cables are guaranteed to function dependably even in the most adverse circumstances. To survive extreme pressures, submersion, and possible chemical exposure, they usually have many layers of shielding, insulation, and protective coatings. In many different sectors, electric submersible cables are essential for improving the functionality and security of underwater electrical systems.
Market Dynamics:
Driver:
Growing Demand in Oil and Gas Industry
The growing demand in the oil and gas industry significantly impacts the electric submersible cables market by increasing the need for reliable power transmission to submersible pumps and equipment used in offshore and deepwater drilling operations. As exploration and production activities expand, particularly in remote and challenging environments, electric submersible cables are essential for powering equipment at great depths. This drives investments in high-performance cables, boosting market growth while enhancing operational efficiency and safety in the oil and gas sector.
Restraint:
High Initial Costs
The high initial costs of electric submersible cables can hinder market growth by limiting adoption, particularly in small and medium-sized enterprises (SMEs) or projects with tight budgets. The expensive installation, specialized materials, and advanced manufacturing processes may deter potential customers from investing in these cables, especially in regions with limited resources or where alternative, less costly solutions are available. This cost barrier can slow market expansion.
Opportunity:
Increasing Renewable Energy Projects
The increasing renewable energy projects, especially offshore wind and tidal energy, are significantly driving the demand for electric submersible cables. These cables are essential for transmitting power from underwater turbines to shore-based grids. As renewable energy investments grow, particularly in offshore and submerged environments, the need for specialized, reliable electric submersible cables escalates. Their ability to withstand harsh underwater conditions and facilitate efficient power transmission makes them a crucial component in the development of sustainable, thereby boosting market growth.
Threat:
Regulatory and Environmental Concerns
Regulatory and environmental issues impede the Electric Submersible Cables Market by establishing severe regulations for cable materials, installation, and disposal. Particularly in deepwater and offshore applications, adherence to environmental regulations causes delays in project timeframes and raises production costs. Concerns are also raised about the possible environmental effects of cable deterioration and disturbance of marine life, which results in stronger restrictions and restricts market expansion and acceptance in delicate habitats.
Covid-19 Impact:
The COVID-19 pandemic temporarily disrupted the Electric Submersible Cables Market due to supply chain delays, project halts, and reduced demand in industries like oil and gas. However, the market showed resilience as essential projects in offshore energy, water management, and oil extraction continued. Post-pandemic recovery, coupled with growing investments in renewable energy and infrastructure, is driving a rebound in demand for electric submersible cables in the long term.
The polyethylene (PE) segment is expected to be the largest during the forecast period
The polyethylene (PE) segment is expected to account for the largest market share during the forecast period, due to its excellent insulating properties, chemical resistance, and durability in harsh underwater environments. PE is used as a primary material in the insulation and outer sheath of these cables, providing protection against moisture, corrosion, and mechanical stress. Its ability to withstand extreme temperatures and pressures makes it ideal for deepwater and offshore applications. The growing demand for reliable, long-lasting cables in the oil, gas, and water industries further drives the use of polyethylene in electric submersible cables.
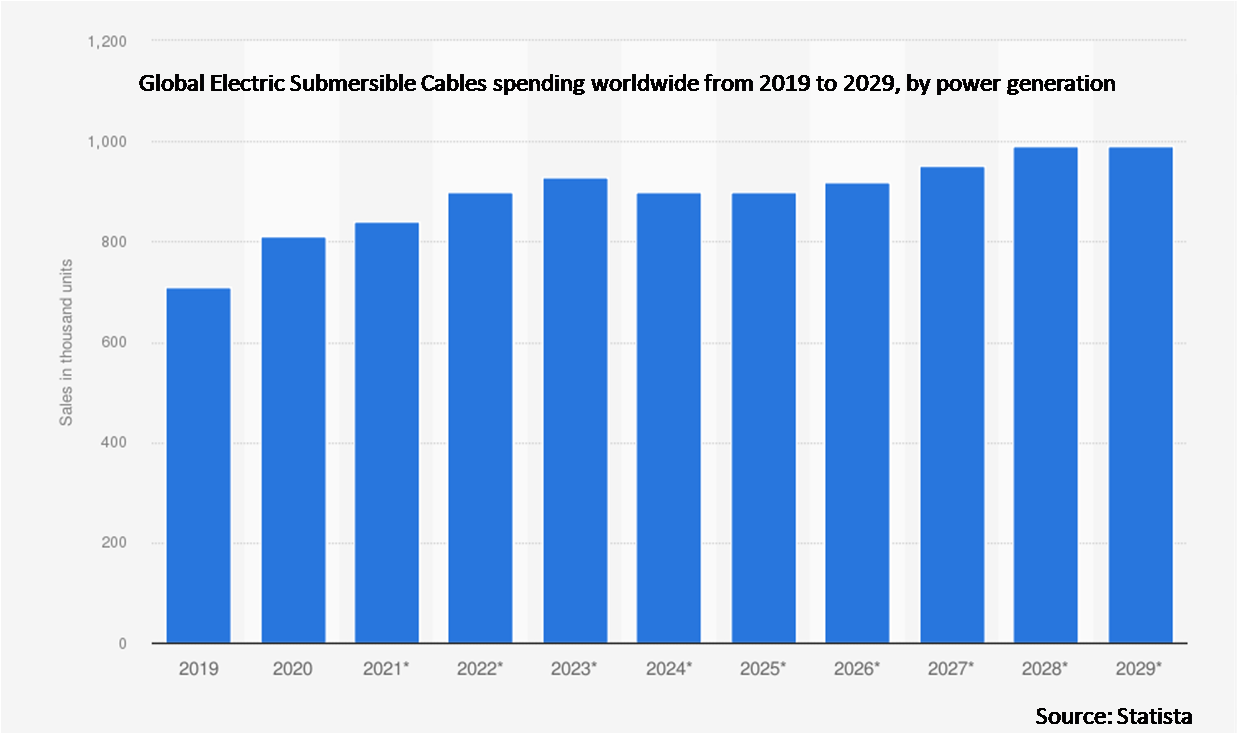
The power generation segment is expected to have the highest CAGR during the forecast period
Over the forecast period, the power generation segment is predicted to witness the highest growth rate owing to increasing reliance on submersible pumps and motors in power plants, especially in offshore and deepwater environments. As the demand for renewable energy sources like offshore wind, tidal, and hydroelectric power grows, the need for durable and efficient electric submersible cables to transmit electricity from underwater turbines and equipment becomes crucial. These cables ensure reliable, continuous power generation, thereby boosting market growth and demand in the energy sector.
Region with largest share:
During the forecast period, the North America region is expected to hold the largest market share due to region's strong oil and gas industry, particularly offshore drilling activities in the Gulf of Mexico, which require reliable submersible cables for deepwater exploration. Additionally, the increasing demand for water management systems, including desalination and wastewater treatment, boosts the need for these cables in submersible pumps. Technological advancements and investments in renewable energy projects, such as offshore wind, further contribute to the market's growth in North America.
Region with highest CAGR:
Over the forecast period, the Asia Pacific region is anticipated to exhibit the highest CAGR because of rising industrialization, increased offshore oil and gas development, and the expansion of water management programs. Nations such as China, India, and Australia are making significant investments in offshore energy projects, including as wind and tidal energy, wastewater treatment systems, and desalination facilities. The market in this area is expanding due to the growing need for dependable, effective submersible cables to power machinery in challenging underwater environments.

Key players in the market
Some of the key players in Electric Submersible Cables market include Siemens AG, Prysmian Group, Schlumberger Limited, Borets International Limited, Halliburton Company, The Kerite Company, Jainson Cables, India Pvt. Ltd., V-GUARD INDUSTRIES LTD., Southwire Company, LLC, Baker Hughes, GE Company, LLC, Nexans SA, Superstar Cable Industries, Alkhoorayef Petroleum and Havells India Ltd.
Key Developments:
In January 2025, Siemens launched Siemens for Startups, a new program to empower early-stage engineering and manufacturing startups. Announced at CES 2025 in Las Vegas, the program will enable new innovative companies to accelerate innovation, while reducing the cost of access to Siemens software and hardware.
In January 2025, Siemens announced an innovative collaboration with Spinnova, a sustainable textile technology company, to help transform the textile industry with sustainable fiber production.
In October 2024, Siemens has signed an agreement to acquire Altair Engineering Inc., a leading provider of software, strengthens its position as a leading technology company and its leadership in industrial software.
Cable Types Covered:
• ESP Flat Power Cable
• ESP Round Power Cable
Materials Covered:
• Polyvinyl Chloride (PVC)
• Ethylene Propylene Rubber (EPR)
• Polyethylene (PE)
• Other Materials
Voltage Ratings Covered:
• Low Voltage (LV)
• Medium Voltage (MV)
• High Voltage (HV)
Applications Covered:
• Oil & Gas Industry
• Water & Wastewater Management
• Mining Industry
• Power Generation
• Other Applications
Regions Covered:
• North America
o US
o Canada
o Mexico
• Europe
o Germany
o UK
o Italy
o France
o Spain
o Rest of Europe
• Asia Pacific
o Japan
o China
o India
o Australia
o New Zealand
o South Korea
o Rest of Asia Pacific
• South America
o Argentina
o Brazil
o Chile
o Rest of South America
• Middle East & Africa
o Saudi Arabia
o UAE
o Qatar
o South Africa
o Rest of Middle East & Africa
What our report offers:
- Market share assessments for the regional and country-level segments
- Strategic recommendations for the new entrants
- Covers Market data for the years 2022, 2023, 2024, 2026, and 2030
- Market Trends (Drivers, Constraints, Opportunities, Threats, Challenges, Investment Opportunities, and recommendations)
- Strategic recommendations in key business segments based on the market estimations
- Competitive landscaping mapping the key common trends
- Company profiling with detailed strategies, financials, and recent developments
- Supply chain trends mapping the latest technological advancements
Free Customization Offerings:
All the customers of this report will be entitled to receive one of the following free customization options:
• Company Profiling
o Comprehensive profiling of additional market players (up to 3)
o SWOT Analysis of key players (up to 3)
• Regional Segmentation
o Market estimations, Forecasts and CAGR of any prominent country as per the client's interest (Note: Depends on feasibility check)
• Competitive Benchmarking
o Benchmarking of key players based on product portfolio, geographical presence, and strategic alliances
Table of Contents
1 Executive Summary
2 Preface
2.1 Abstract
2.2 Stake Holders
2.3 Research Scope
2.4 Research Methodology
2.4.1 Data Mining
2.4.2 Data Analysis
2.4.3 Data Validation
2.4.4 Research Approach
2.5 Research Sources
2.5.1 Primary Research Sources
2.5.2 Secondary Research Sources
2.5.3 Assumptions
3 Market Trend Analysis
3.1 Introduction
3.2 Drivers
3.3 Restraints
3.4 Opportunities
3.5 Threats
3.6 Application Analysis
3.7 Emerging Markets
3.8 Impact of Covid-19
4 Porters Five Force Analysis
4.1 Bargaining power of suppliers
4.2 Bargaining power of buyers
4.3 Threat of substitutes
4.4 Threat of new entrants
4.5 Competitive rivalry
5 Global Electric Submersible Cables Market, By Cable Type
5.1 Introduction
5.2 ESP Flat Power Cable
5.3 ESP Round Power Cable
6 Global Electric Submersible Cables Market, By Material
6.1 Introduction
6.2 Polyvinyl Chloride (PVC)
6.3 Ethylene Propylene Rubber (EPR)
6.4 Polyethylene (PE)
6.5 Other Materials
7 Global Electric Submersible Cables Market, By Voltage Rating
7.1 Introduction
7.2 Low Voltage (LV)
7.3 Medium Voltage (MV)
7.4 High Voltage (HV)
8 Global Electric Submersible Cables Market, By Application
8.1 Introduction
8.2 Oil & Gas Industry
8.3 Water & Wastewater Management
8.4 Mining Industry
8.5 Power Generation
8.6 Other Applications
9 Global Electric Submersible Cables Market, By Geography
9.1 Introduction
9.2 North America
9.2.1 US
9.2.2 Canada
9.2.3 Mexico
9.3 Europe
9.3.1 Germany
9.3.2 UK
9.3.3 Italy
9.3.4 France
9.3.5 Spain
9.3.6 Rest of Europe
9.4 Asia Pacific
9.4.1 Japan
9.4.2 China
9.4.3 India
9.4.4 Australia
9.4.5 New Zealand
9.4.6 South Korea
9.4.7 Rest of Asia Pacific
9.5 South America
9.5.1 Argentina
9.5.2 Brazil
9.5.3 Chile
9.5.4 Rest of South America
9.6 Middle East & Africa
9.6.1 Saudi Arabia
9.6.2 UAE
9.6.3 Qatar
9.6.4 South Africa
9.6.5 Rest of Middle East & Africa
11 Key Developments
11.1 Agreements, Partnerships, Collaborations and Joint Ventures
11.2 Acquisitions & Mergers
11.3 New Product Launch
11.4 Expansions
11.5 Other Key Strategies
12 Company Profiling
12.1 Siemens AG
12.2 Prysmian Group
12.3 Schlumberger Limited
12.4 Borets International Limited
12.5 Halliburton Company
12.6 The Kerite Company
12.7 Jainson Cables, India Pvt. Ltd.
12.8 V-GUARD INDUSTRIES LTD.
12.9 Southwire Company, LLC
12.10 Baker Hughes
12.11 GE Company, LLC
12.12 Nexans SA
12.13 Superstar Cable Industries
12.14 Alkhoorayef Petroleum
12.15 Havells India Ltd.
List of Tables
1 Global Electric Submersible Cables Market Outlook, By Region (2022-2030) ($MN)
2 Global Electric Submersible Cables Market Outlook, By Cable Type (2022-2030) ($MN)
3 Global Electric Submersible Cables Market Outlook, By ESP Flat Power Cable (2022-2030) ($MN)
4 Global Electric Submersible Cables Market Outlook, By ESP Round Power Cable (2022-2030) ($MN)
5 Global Electric Submersible Cables Market Outlook, By Material (2022-2030) ($MN)
6 Global Electric Submersible Cables Market Outlook, By Polyvinyl Chloride (PVC) (2022-2030) ($MN)
7 Global Electric Submersible Cables Market Outlook, By Ethylene Propylene Rubber (EPR) (2022-2030) ($MN)
8 Global Electric Submersible Cables Market Outlook, By Polyethylene (PE) (2022-2030) ($MN)
9 Global Electric Submersible Cables Market Outlook, By Other Materials (2022-2030) ($MN)
10 Global Electric Submersible Cables Market Outlook, By Voltage Rating (2022-2030) ($MN)
11 Global Electric Submersible Cables Market Outlook, By Low Voltage (LV) (2022-2030) ($MN)
12 Global Electric Submersible Cables Market Outlook, By Medium Voltage (MV) (2022-2030) ($MN)
13 Global Electric Submersible Cables Market Outlook, By High Voltage (HV) (2022-2030) ($MN)
14 Global Electric Submersible Cables Market Outlook, By Application (2022-2030) ($MN)
15 Global Electric Submersible Cables Market Outlook, By Oil & Gas Industry (2022-2030) ($MN)
16 Global Electric Submersible Cables Market Outlook, By Water & Wastewater Management (2022-2030) ($MN)
17 Global Electric Submersible Cables Market Outlook, By Mining Industry (2022-2030) ($MN)
18 Global Electric Submersible Cables Market Outlook, By Power Generation (2022-2030) ($MN)
19 Global Electric Submersible Cables Market Outlook, By Other Applications (2022-2030) ($MN)
20 North America Electric Submersible Cables Market Outlook, By Country (2022-2030) ($MN)
21 North America Electric Submersible Cables Market Outlook, By Cable Type (2022-2030) ($MN)
22 North America Electric Submersible Cables Market Outlook, By ESP Flat Power Cable (2022-2030) ($MN)
23 North America Electric Submersible Cables Market Outlook, By ESP Round Power Cable (2022-2030) ($MN)
24 North America Electric Submersible Cables Market Outlook, By Material (2022-2030) ($MN)
25 North America Electric Submersible Cables Market Outlook, By Polyvinyl Chloride (PVC) (2022-2030) ($MN)
26 North America Electric Submersible Cables Market Outlook, By Ethylene Propylene Rubber (EPR) (2022-2030) ($MN)
27 North America Electric Submersible Cables Market Outlook, By Polyethylene (PE) (2022-2030) ($MN)
28 North America Electric Submersible Cables Market Outlook, By Other Materials (2022-2030) ($MN)
29 North America Electric Submersible Cables Market Outlook, By Voltage Rating (2022-2030) ($MN)
30 North America Electric Submersible Cables Market Outlook, By Low Voltage (LV) (2022-2030) ($MN)
31 North America Electric Submersible Cables Market Outlook, By Medium Voltage (MV) (2022-2030) ($MN)
32 North America Electric Submersible Cables Market Outlook, By High Voltage (HV) (2022-2030) ($MN)
33 North America Electric Submersible Cables Market Outlook, By Application (2022-2030) ($MN)
34 North America Electric Submersible Cables Market Outlook, By Oil & Gas Industry (2022-2030) ($MN)
35 North America Electric Submersible Cables Market Outlook, By Water & Wastewater Management (2022-2030) ($MN)
36 North America Electric Submersible Cables Market Outlook, By Mining Industry (2022-2030) ($MN)
37 North America Electric Submersible Cables Market Outlook, By Power Generation (2022-2030) ($MN)
38 North America Electric Submersible Cables Market Outlook, By Other Applications (2022-2030) ($MN)
39 Europe Electric Submersible Cables Market Outlook, By Country (2022-2030) ($MN)
40 Europe Electric Submersible Cables Market Outlook, By Cable Type (2022-2030) ($MN)
41 Europe Electric Submersible Cables Market Outlook, By ESP Flat Power Cable (2022-2030) ($MN)
42 Europe Electric Submersible Cables Market Outlook, By ESP Round Power Cable (2022-2030) ($MN)
43 Europe Electric Submersible Cables Market Outlook, By Material (2022-2030) ($MN)
44 Europe Electric Submersible Cables Market Outlook, By Polyvinyl Chloride (PVC) (2022-2030) ($MN)
45 Europe Electric Submersible Cables Market Outlook, By Ethylene Propylene Rubber (EPR) (2022-2030) ($MN)
46 Europe Electric Submersible Cables Market Outlook, By Polyethylene (PE) (2022-2030) ($MN)
47 Europe Electric Submersible Cables Market Outlook, By Other Materials (2022-2030) ($MN)
48 Europe Electric Submersible Cables Market Outlook, By Voltage Rating (2022-2030) ($MN)
49 Europe Electric Submersible Cables Market Outlook, By Low Voltage (LV) (2022-2030) ($MN)
50 Europe Electric Submersible Cables Market Outlook, By Medium Voltage (MV) (2022-2030) ($MN)
51 Europe Electric Submersible Cables Market Outlook, By High Voltage (HV) (2022-2030) ($MN)
52 Europe Electric Submersible Cables Market Outlook, By Application (2022-2030) ($MN)
53 Europe Electric Submersible Cables Market Outlook, By Oil & Gas Industry (2022-2030) ($MN)
54 Europe Electric Submersible Cables Market Outlook, By Water & Wastewater Management (2022-2030) ($MN)
55 Europe Electric Submersible Cables Market Outlook, By Mining Industry (2022-2030) ($MN)
56 Europe Electric Submersible Cables Market Outlook, By Power Generation (2022-2030) ($MN)
57 Europe Electric Submersible Cables Market Outlook, By Other Applications (2022-2030) ($MN)
58 Asia Pacific Electric Submersible Cables Market Outlook, By Country (2022-2030) ($MN)
59 Asia Pacific Electric Submersible Cables Market Outlook, By Cable Type (2022-2030) ($MN)
60 Asia Pacific Electric Submersible Cables Market Outlook, By ESP Flat Power Cable (2022-2030) ($MN)
61 Asia Pacific Electric Submersible Cables Market Outlook, By ESP Round Power Cable (2022-2030) ($MN)
62 Asia Pacific Electric Submersible Cables Market Outlook, By Material (2022-2030) ($MN)
63 Asia Pacific Electric Submersible Cables Market Outlook, By Polyvinyl Chloride (PVC) (2022-2030) ($MN)
64 Asia Pacific Electric Submersible Cables Market Outlook, By Ethylene Propylene Rubber (EPR) (2022-2030) ($MN)
65 Asia Pacific Electric Submersible Cables Market Outlook, By Polyethylene (PE) (2022-2030) ($MN)
66 Asia Pacific Electric Submersible Cables Market Outlook, By Other Materials (2022-2030) ($MN)
67 Asia Pacific Electric Submersible Cables Market Outlook, By Voltage Rating (2022-2030) ($MN)
68 Asia Pacific Electric Submersible Cables Market Outlook, By Low Voltage (LV) (2022-2030) ($MN)
69 Asia Pacific Electric Submersible Cables Market Outlook, By Medium Voltage (MV) (2022-2030) ($MN)
70 Asia Pacific Electric Submersible Cables Market Outlook, By High Voltage (HV) (2022-2030) ($MN)
71 Asia Pacific Electric Submersible Cables Market Outlook, By Application (2022-2030) ($MN)
72 Asia Pacific Electric Submersible Cables Market Outlook, By Oil & Gas Industry (2022-2030) ($MN)
73 Asia Pacific Electric Submersible Cables Market Outlook, By Water & Wastewater Management (2022-2030) ($MN)
74 Asia Pacific Electric Submersible Cables Market Outlook, By Mining Industry (2022-2030) ($MN)
75 Asia Pacific Electric Submersible Cables Market Outlook, By Power Generation (2022-2030) ($MN)
76 Asia Pacific Electric Submersible Cables Market Outlook, By Other Applications (2022-2030) ($MN)
77 South America Electric Submersible Cables Market Outlook, By Country (2022-2030) ($MN)
78 South America Electric Submersible Cables Market Outlook, By Cable Type (2022-2030) ($MN)
79 South America Electric Submersible Cables Market Outlook, By ESP Flat Power Cable (2022-2030) ($MN)
80 South America Electric Submersible Cables Market Outlook, By ESP Round Power Cable (2022-2030) ($MN)
81 South America Electric Submersible Cables Market Outlook, By Material (2022-2030) ($MN)
82 South America Electric Submersible Cables Market Outlook, By Polyvinyl Chloride (PVC) (2022-2030) ($MN)
83 South America Electric Submersible Cables Market Outlook, By Ethylene Propylene Rubber (EPR) (2022-2030) ($MN)
84 South America Electric Submersible Cables Market Outlook, By Polyethylene (PE) (2022-2030) ($MN)
85 South America Electric Submersible Cables Market Outlook, By Other Materials (2022-2030) ($MN)
86 South America Electric Submersible Cables Market Outlook, By Voltage Rating (2022-2030) ($MN)
87 South America Electric Submersible Cables Market Outlook, By Low Voltage (LV) (2022-2030) ($MN)
88 South America Electric Submersible Cables Market Outlook, By Medium Voltage (MV) (2022-2030) ($MN)
89 South America Electric Submersible Cables Market Outlook, By High Voltage (HV) (2022-2030) ($MN)
90 South America Electric Submersible Cables Market Outlook, By Application (2022-2030) ($MN)
91 South America Electric Submersible Cables Market Outlook, By Oil & Gas Industry (2022-2030) ($MN)
92 South America Electric Submersible Cables Market Outlook, By Water & Wastewater Management (2022-2030) ($MN)
93 South America Electric Submersible Cables Market Outlook, By Mining Industry (2022-2030) ($MN)
94 South America Electric Submersible Cables Market Outlook, By Power Generation (2022-2030) ($MN)
95 South America Electric Submersible Cables Market Outlook, By Other Applications (2022-2030) ($MN)
96 Middle East & Africa Electric Submersible Cables Market Outlook, By Country (2022-2030) ($MN)
97 Middle East & Africa Electric Submersible Cables Market Outlook, By Cable Type (2022-2030) ($MN)
98 Middle East & Africa Electric Submersible Cables Market Outlook, By ESP Flat Power Cable (2022-2030) ($MN)
99 Middle East & Africa Electric Submersible Cables Market Outlook, By ESP Round Power Cable (2022-2030) ($MN)
100 Middle East & Africa Electric Submersible Cables Market Outlook, By Material (2022-2030) ($MN)
101 Middle East & Africa Electric Submersible Cables Market Outlook, By Polyvinyl Chloride (PVC) (2022-2030) ($MN)
102 Middle East & Africa Electric Submersible Cables Market Outlook, By Ethylene Propylene Rubber (EPR) (2022-2030) ($MN)
103 Middle East & Africa Electric Submersible Cables Market Outlook, By Polyethylene (PE) (2022-2030) ($MN)
104 Middle East & Africa Electric Submersible Cables Market Outlook, By Other Materials (2022-2030) ($MN)
105 Middle East & Africa Electric Submersible Cables Market Outlook, By Voltage Rating (2022-2030) ($MN)
106 Middle East & Africa Electric Submersible Cables Market Outlook, By Low Voltage (LV) (2022-2030) ($MN)
107 Middle East & Africa Electric Submersible Cables Market Outlook, By Medium Voltage (MV) (2022-2030) ($MN)
108 Middle East & Africa Electric Submersible Cables Market Outlook, By High Voltage (HV) (2022-2030) ($MN)
109 Middle East & Africa Electric Submersible Cables Market Outlook, By Application (2022-2030) ($MN)
110 Middle East & Africa Electric Submersible Cables Market Outlook, By Oil & Gas Industry (2022-2030) ($MN)
111 Middle East & Africa Electric Submersible Cables Market Outlook, By Water & Wastewater Management (2022-2030) ($MN)
112 Middle East & Africa Electric Submersible Cables Market Outlook, By Mining Industry (2022-2030) ($MN)
113 Middle East & Africa Electric Submersible Cables Market Outlook, By Power Generation (2022-2030) ($MN)
114 Middle East & Africa Electric Submersible Cables Market Outlook, By Other Applications (2022-2030) ($MN)
List of Figures
RESEARCH METHODOLOGY

We at ‘Stratistics’ opt for an extensive research approach which involves data mining, data validation, and data analysis. The various research sources include in-house repository, secondary research, competitor’s sources, social media research, client internal data, and primary research.
Our team of analysts prefers the most reliable and authenticated data sources in order to perform the comprehensive literature search. With access to most of the authenticated data bases our team highly considers the best mix of information through various sources to obtain extensive and accurate analysis.
Each report takes an average time of a month and a team of 4 industry analysts. The time may vary depending on the scope and data availability of the desired market report. The various parameters used in the market assessment are standardized in order to enhance the data accuracy.
Data Mining
The data is collected from several authenticated, reliable, paid and unpaid sources and is filtered depending on the scope & objective of the research. Our reports repository acts as an added advantage in this procedure. Data gathering from the raw material suppliers, distributors and the manufacturers is performed on a regular basis, this helps in the comprehensive understanding of the products value chain. Apart from the above mentioned sources the data is also collected from the industry consultants to ensure the objective of the study is in the right direction.
Market trends such as technological advancements, regulatory affairs, market dynamics (Drivers, Restraints, Opportunities and Challenges) are obtained from scientific journals, market related national & international associations and organizations.
Data Analysis
From the data that is collected depending on the scope & objective of the research the data is subjected for the analysis. The critical steps that we follow for the data analysis include:
- Product Lifecycle Analysis
- Competitor analysis
- Risk analysis
- Porters Analysis
- PESTEL Analysis
- SWOT Analysis
The data engineering is performed by the core industry experts considering both the Marketing Mix Modeling and the Demand Forecasting. The marketing mix modeling makes use of multiple-regression techniques to predict the optimal mix of marketing variables. Regression factor is based on a number of variables and how they relate to an outcome such as sales or profits.
Data Validation
The data validation is performed by the exhaustive primary research from the expert interviews. This includes telephonic interviews, focus groups, face to face interviews, and questionnaires to validate our research from all aspects. The industry experts we approach come from the leading firms, involved in the supply chain ranging from the suppliers, distributors to the manufacturers and consumers so as to ensure an unbiased analysis.
We are in touch with more than 15,000 industry experts with the right mix of consultants, CEO's, presidents, vice presidents, managers, experts from both supply side and demand side, executives and so on.
The data validation involves the primary research from the industry experts belonging to:
- Leading Companies
- Suppliers & Distributors
- Manufacturers
- Consumers
- Industry/Strategic Consultants
Apart from the data validation the primary research also helps in performing the fill gap research, i.e. providing solutions for the unmet needs of the research which helps in enhancing the reports quality.
For more details about research methodology, kindly write to us at info@strategymrc.com
Frequently Asked Questions
In case of any queries regarding this report, you can contact the customer service by filing the “Inquiry Before Buy” form available on the right hand side. You may also contact us through email: info@strategymrc.com or phone: +1-301-202-5929
Yes, the samples are available for all the published reports. You can request them by filling the “Request Sample” option available in this page.
Yes, you can request a sample with your specific requirements. All the customized samples will be provided as per the requirement with the real data masked.
All our reports are available in Digital PDF format. In case if you require them in any other formats, such as PPT, Excel etc you can submit a request through “Inquiry Before Buy” form available on the right hand side. You may also contact us through email: info@strategymrc.com or phone: +1-301-202-5929
We offer a free 15% customization with every purchase. This requirement can be fulfilled for both pre and post sale. You may send your customization requirements through email at info@strategymrc.com or call us on +1-301-202-5929.
We have 3 different licensing options available in electronic format.
- Single User Licence: Allows one person, typically the buyer, to have access to the ordered product. The ordered product cannot be distributed to anyone else.
- 2-5 User Licence: Allows the ordered product to be shared among a maximum of 5 people within your organisation.
- Corporate License: Allows the product to be shared among all employees of your organisation regardless of their geographical location.
All our reports are typically be emailed to you as an attachment.
To order any available report you need to register on our website. The payment can be made either through CCAvenue or PayPal payments gateways which accept all international cards.
We extend our support to 6 months post sale. A post sale customization is also provided to cover your unmet needs in the report.
Request Customization
We offer complimentary customization of up to 15% with every purchase. To share your customization requirements, feel free to email us at info@strategymrc.com or call us on +1-301-202-5929. .
Please Note: Customization within the 15% threshold is entirely free of charge. If your request exceeds this limit, we will conduct a feasibility assessment. Following that, a detailed quote and timeline will be provided.
WHY CHOOSE US ?

Assured Quality
Best in class reports with high standard of research integrity

24X7 Research Support
Continuous support to ensure the best customer experience.

Free Customization
Adding more values to your product of interest.

Safe & Secure Access
Providing a secured environment for all online transactions.

Trusted by 600+ Brands
Serving the most reputed brands across the world.