
Embolization Particle Market
Embolization Particle Market Forecasts to 2032 - Global Analysis By Product (Radioembolization Spheres, Microspheres, Drug Eluting Beads (DEBs), Gelfoam Particles, Gelatin Sponge Particles and Other Products), Material, Application, End User and By Geography

|
Years Covered |
2024-2032 |
|
Estimated Year Value (2025) |
US $1.7 BN |
|
Projected Year Value (2032) |
US $3.8 BN |
|
CAGR (2025-2032) |
12.7% |
|
Regions Covered |
North America, Europe, Asia Pacific, South America, and Middle East & Africa |
|
Countries Covered |
US, Canada, Mexico, Germany, UK, Italy, France, Spain, Japan, China, India, Australia, New Zealand, South Korea, Rest of Asia Pacific, South America, Argentina, Brazil, Chile, Middle East & Africa, Saudi Arabia, UAE, Qatar, and South Africa |
|
Largest Market |
Asia Pacific |
|
Highest Growing Market |
North America |
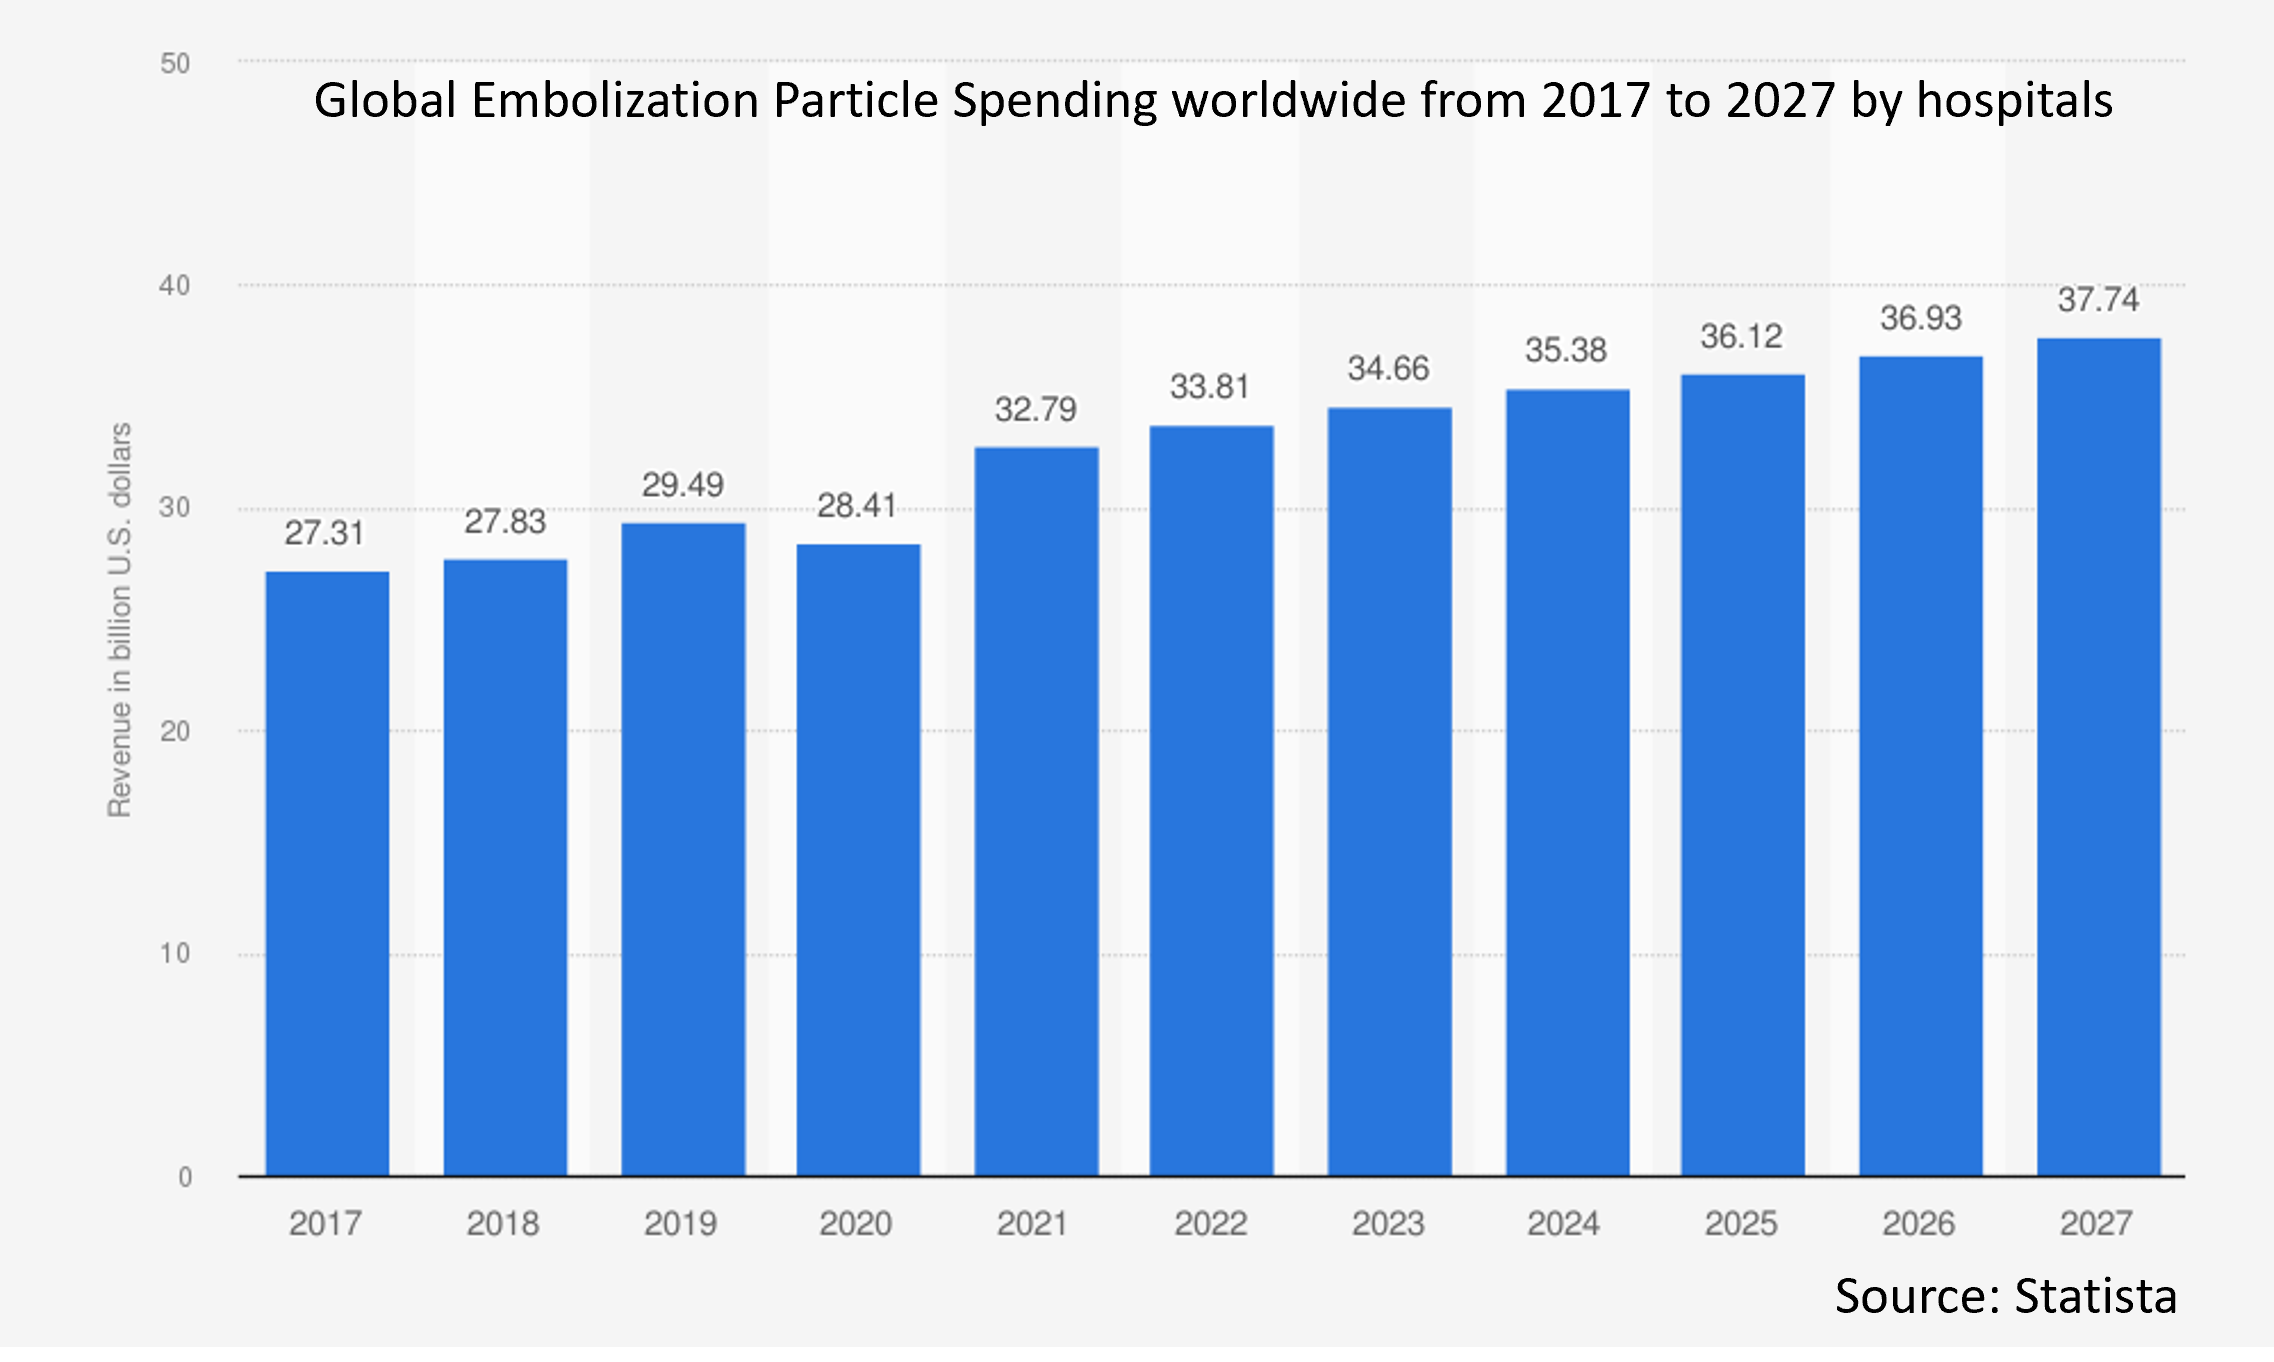
According to Stratistics MRC, the Global Embolization Particle Market is accounted for $1.7 billion in 2025 and is expected to reach $3.8 billion by 2032 growing at a CAGR of 12.7% during the forecast period. Embolization particles are small synthetic or natural materials used in a medical procedure called embolization to block blood vessels deliberately. These particles are injected through a catheter into the targeted blood vessels to obstruct blood flow to specific areas, such as tumors, abnormal growths, or areas of bleeding. By restricting blood supply, embolization can shrink tumors, stop hemorrhaging, or reduce blood loss during surgery. Common materials include polyvinyl alcohol (PVA), microspheres, gelatin sponges, or metal coils. The choice of particle size and material depends on the clinical goal and target vessel size.
According to data published by the American Cancer Society, Inc., in January 2024, about 41,630 new liver cancer cases were estimated to be diagnosed in the U.S. that year.
Market Dynamics:
Driver:
Rising Incidence of Chronic Diseases
The rising incidence of chronic diseases such as cancer, cardiovascular conditions, and uterine fibroids is driving significant growth in the embolization particle market. These conditions often require minimally invasive procedures for treatment, where embolization particles play a crucial role in blocking abnormal blood flow. As patient demand increases for less invasive, targeted therapies with faster recovery times, the need for embolization technologies expands. This trend fosters innovation, investment, and market expansion, positioning embolization particles as a key therapeutic solution.
Restraint:
High Cost of Embolization Procedures
The high cost of embolization procedures significantly hinders the growth of the embolization particle market. Expensive treatment prices limit patient accessibility, particularly in low-income regions, reducing overall demand. Additionally, healthcare providers may be reluctant to adopt these advanced procedures due to high operational costs, further stalling market expansion. This creates a barrier for market players, slowing innovation and limiting the adoption of potentially life-saving treatments.
Opportunity:
Technological Advancements
Technological advancements are significantly driving the embolization particle market by enhancing precision, efficacy, and patient safety. Innovations such as image-guided delivery systems, bioresorbable particles, and nanotechnology enable targeted therapy with minimal invasiveness, reducing recovery time and improving outcomes. These breakthroughs attract investment and expand clinical applications across oncology, neurology, and gynecology. As healthcare shifts toward personalized medicine, technology-driven embolization solutions offer superior customization, boosting adoption and market growth globally.
Threat:
Stringent Regulatory Requirements
Stringent regulatory requirements significantly hinder the embolization particle market by imposing lengthy and costly approval processes. Regulatory bodies like the FDA and EMA demand extensive clinical trials and comprehensive safety data, delaying market entry for new products. These rigorous standards increase development costs and complicate compliance, particularly for small and mid-sized manufacturers. Such barriers restrict innovation, limit product availability, and impede timely access to advanced treatments, especially in emerging markets.
Covid-19 Impact
The COVID-19 pandemic significantly disrupted the embolization particle market, leading to delays in elective procedures and reduced hospital admissions. Lockdowns and resource reallocation strained supply chains, causing manufacturing and distribution challenges. This resulted in workforce shortages and hindered clinical development activities. Consequently, the market experienced a slowdown in growth during the peak of the pandemic. However, as healthcare systems adapt and elective procedures resume, the market is poised for recovery and continued expansion.
The biodegradable segment is expected to be the largest during the forecast period
The biodegradable segment is expected to account for the largest market share during the forecast period as these particles naturally dissolve after achieving their therapeutic effect, minimizing risks associated with permanent implants. Growing preference for minimally invasive procedures and increasing awareness of biocompatibility are fueling demand. Additionally, advancements in biodegradable materials enhance treatment precision and post-procedural recovery, positioning this segment as a key growth driver and innovation catalyst within the embolization particle industry.
The neurology segment is expected to have the highest CAGR during the forecast period
Over the forecast period, the neurology segment is predicted to witness the highest growth rate, due to rising incidences of neurovascular disorders such as arteriovenous malformations. Advancements in minimally invasive procedures and increased awareness of neurological conditions have spurred demand for precise embolization solutions. Hospitals and clinics are increasingly adopting embolization particles for effective, targeted treatments, enhancing patient outcomes. This strong demand from the neurology field continues to positively impact market expansion, innovation, and investment in embolic technologies globally.
Region with largest share:
During the forecast period, the Asia Pacific region is expected to hold the largest market share due to improved access to advanced interventional radiology procedures. Governments are prioritizing minimally invasive treatments, boosting demand for embolization therapies. Technological advancements and expanding medical tourism further contribute to market expansion. This positive momentum is enhancing patient outcomes, reducing recovery times, and promoting cost-effective healthcare solutions across rapidly developing economies like China, India, and Southeast Asia.
Region with highest CAGR:
Over the forecast period, the North America region is anticipated to exhibit the highest CAGR, owing to rising adoption of minimally invasive procedures, and technological advancements in interventional radiology. Growing healthcare expenditure and supportive reimbursement policies further drive market growth. Major players are investing in research and development, enhancing treatment efficacy and safety. This progress fosters better patient outcomes, accelerates procedural demand, and strengthens the region's leadership in global embolization technologies.

Key players in the market
Some of the key players profiled in the Embolization Particle Market include Boston Scientific Corporation, Medtronic plc, Terumo Corporation, Merit Medical Systems, Inc., Cook Medical Inc., Sirtex Medical Limited, BTG plc, Stryker Corporation, Penumbra, Inc., Johnson & Johnson, Guerbet Group, Kaneka Corporation, Interface BIOmaterials B.V., HENGRUI Medical and Alicon.
Key Developments:
In February 2025, Medtronic and Philips have partnered to enhance the capabilities of over 300 clinicians in India by providing advanced training in structural heart imaging. This collaboration focuses on equipping cardiologists and radiologists with expertise in multi-modality imaging techniques, particularly echocardiography (echo) and Magnetic Resonance Imaging (MRI), to improve the diagnosis and treatment of structural heart diseases, especially among End-Stage Renal Disease (ESRD) patients.
In July 2024, Medtronic and SWIZTON Medcare have inaugurated their first collaborative vein clinic at Aveksha Hospital in Singapura, Bengaluru. This facility aims to provide accessible and advanced treatments for varicose veins, a condition affecting approximately 20% of adults globally.
Products Covered:
• Radioembolization Spheres
• Microspheres
• Drug Eluting Beads (DEBs)
• Gelfoam Particles
• Gelatin Sponge Particles
• Liquid Embolics
• Polyvinyl Alcohol (PVA) Particles
• Other Products
Materials Covered:
• Biodegradable
• Non-biodegradable
Applications Covered:
• Oncology
• Urology
• Neurology
• Peripheral Vascular Disease
• Other Applications
End Users Covered:
• Hospitals
• Ambulatory Surgical Centers
• Clinics
• Other End Users
Regions Covered:
• North America
o US
o Canada
o Mexico
• Europe
o Germany
o UK
o Italy
o France
o Spain
o Rest of Europe
• Asia Pacific
o Japan
o China
o India
o Australia
o New Zealand
o South Korea
o Rest of Asia Pacific
• South America
o Argentina
o Brazil
o Chile
o Rest of South America
• Middle East & Africa
o Saudi Arabia
o UAE
o Qatar
o South Africa
o Rest of Middle East & Africa
What our report offers:
- Market share assessments for the regional and country-level segments
- Strategic recommendations for the new entrants
- Covers Market data for the years 2022, 2023, 2024, 2026, and 2030
- Market Trends (Drivers, Constraints, Opportunities, Threats, Challenges, Investment Opportunities, and recommendations)
- Strategic recommendations in key business segments based on the market estimations
- Competitive landscaping mapping the key common trends
- Company profiling with detailed strategies, financials, and recent developments
- Supply chain trends mapping the latest technological advancements
Free Customization Offerings:
All the customers of this report will be entitled to receive one of the following free customization options:
• Company Profiling
o Comprehensive profiling of additional market players (up to 3)
o SWOT Analysis of key players (up to 3)
• Regional Segmentation
o Market estimations, Forecasts and CAGR of any prominent country as per the client's interest (Note: Depends on feasibility check)
• Competitive Benchmarking
o Benchmarking of key players based on product portfolio, geographical presence, and strategic alliances
Table of Contents
1 Executive Summary
2 Preface
2.1 Abstract
2.2 Stake Holders
2.3 Research Scope
2.4 Research Methodology
2.4.1 Data Mining
2.4.2 Data Analysis
2.4.3 Data Validation
2.4.4 Research Approach
2.5 Research Sources
2.5.1 Primary Research Sources
2.5.2 Secondary Research Sources
2.5.3 Assumptions
3 Market Trend Analysis
3.1 Introduction
3.2 Drivers
3.3 Restraints
3.4 Opportunities
3.5 Threats
3.6 Product Analysis
3.7 Application Analysis
3.8 End User Analysis
3.9 Emerging Markets
3.10 Impact of Covid-19
4 Porters Five Force Analysis
4.1 Bargaining power of suppliers
4.2 Bargaining power of buyers
4.3 Threat of substitutes
4.4 Threat of new entrants
4.5 Competitive rivalry
5 Global Embolization Particle Market, By Product
5.1 Introduction
5.2 Radioembolization Spheres
5.3 Microspheres
5.4 Drug Eluting Beads (DEBs)
5.5 Gelfoam Particles
5.6 Gelatin Sponge Particles
5.7 Liquid Embolics
5.8 Polyvinyl Alcohol (PVA) Particles
5.9 Other Products
6 Global Embolization Particle Market, By Material
6.1 Introduction
6.2 Biodegradable
6.3 Non-biodegradable
7 Global Embolization Particle Market, By Application
7.1 Introduction
7.2 Oncology
7.3 Urology
7.4 Neurology
7.5 Peripheral Vascular Disease
7.6 Other Applications
8 Global Embolization Particle Market, By End User
8.1 Introduction
8.2 Hospitals
8.3 Ambulatory Surgical Centers
8.4 Clinics
8.5 Other End Users
9 Global Embolization Particle Market, By Geography
9.1 Introduction
9.2 North America
9.2.1 US
9.2.2 Canada
9.2.3 Mexico
9.3 Europe
9.3.1 Germany
9.3.2 UK
9.3.3 Italy
9.3.4 France
9.3.5 Spain
9.3.6 Rest of Europe
9.4 Asia Pacific
9.4.1 Japan
9.4.2 China
9.4.3 India
9.4.4 Australia
9.4.5 New Zealand
9.4.6 South Korea
9.4.7 Rest of Asia Pacific
9.5 South America
9.5.1 Argentina
9.5.2 Brazil
9.5.3 Chile
9.5.4 Rest of South America
9.6 Middle East & Africa
9.6.1 Saudi Arabia
9.6.2 UAE
9.6.3 Qatar
9.6.4 South Africa
9.6.5 Rest of Middle East & Africa
10 Key Developments
10.1 Agreements, Partnerships, Collaborations and Joint Ventures
10.2 Acquisitions & Mergers
10.3 New Product Launch
10.4 Expansions
10.5 Other Key Strategies
11 Company Profiling
11.1 Boston Scientific Corporation
11.2 Medtronic plc
11.3 Terumo Corporation
11.4 Merit Medical Systems, Inc.
11.5 Cook Medical Inc.
11.6 Sirtex Medical Limited
11.7 BTG plc
11.8 Stryker Corporation
11.9 Penumbra, Inc.
11.10 Johnson & Johnson
11.11 Guerbet Group
11.12 Kaneka Corporation
11.13 Interface BIOmaterials B.V.
11.14 HENGRUI Medical
11.15 Alicon
List of Tables
1 Global Embolization Particle Market Outlook, By Region (2024-2032) ($MN)
2 Global Embolization Particle Market Outlook, By Product (2024-2032) ($MN)
3 Global Embolization Particle Market Outlook, By Radioembolization Spheres (2024-2032) ($MN)
4 Global Embolization Particle Market Outlook, By Microspheres (2024-2032) ($MN)
5 Global Embolization Particle Market Outlook, By Drug Eluting Beads (DEBs) (2024-2032) ($MN)
6 Global Embolization Particle Market Outlook, By Gelfoam Particles (2024-2032) ($MN)
7 Global Embolization Particle Market Outlook, By Gelatin Sponge Particles (2024-2032) ($MN)
8 Global Embolization Particle Market Outlook, By Liquid Embolics (2024-2032) ($MN)
9 Global Embolization Particle Market Outlook, By Polyvinyl Alcohol (PVA) Particles (2024-2032) ($MN)
10 Global Embolization Particle Market Outlook, By Other Products (2024-2032) ($MN)
11 Global Embolization Particle Market Outlook, By Material (2024-2032) ($MN)
12 Global Embolization Particle Market Outlook, By Biodegradable (2024-2032) ($MN)
13 Global Embolization Particle Market Outlook, By Non-biodegradable (2024-2032) ($MN)
14 Global Embolization Particle Market Outlook, By Application (2024-2032) ($MN)
15 Global Embolization Particle Market Outlook, By Oncology (2024-2032) ($MN)
16 Global Embolization Particle Market Outlook, By Urology (2024-2032) ($MN)
17 Global Embolization Particle Market Outlook, By Neurology (2024-2032) ($MN)
18 Global Embolization Particle Market Outlook, By Peripheral Vascular Disease (2024-2032) ($MN)
19 Global Embolization Particle Market Outlook, By Other Applications (2024-2032) ($MN)
20 Global Embolization Particle Market Outlook, By End User (2024-2032) ($MN)
21 Global Embolization Particle Market Outlook, By Hospitals (2024-2032) ($MN)
22 Global Embolization Particle Market Outlook, By Ambulatory Surgical Centers (2024-2032) ($MN)
23 Global Embolization Particle Market Outlook, By Clinics (2024-2032) ($MN)
24 Global Embolization Particle Market Outlook, By Other End Users (2024-2032) ($MN)
25 North America Embolization Particle Market Outlook, By Country (2024-2032) ($MN)
26 North America Embolization Particle Market Outlook, By Product (2024-2032) ($MN)
27 North America Embolization Particle Market Outlook, By Radioembolization Spheres (2024-2032) ($MN)
28 North America Embolization Particle Market Outlook, By Microspheres (2024-2032) ($MN)
29 North America Embolization Particle Market Outlook, By Drug Eluting Beads (DEBs) (2024-2032) ($MN)
30 North America Embolization Particle Market Outlook, By Gelfoam Particles (2024-2032) ($MN)
31 North America Embolization Particle Market Outlook, By Gelatin Sponge Particles (2024-2032) ($MN)
32 North America Embolization Particle Market Outlook, By Liquid Embolics (2024-2032) ($MN)
33 North America Embolization Particle Market Outlook, By Polyvinyl Alcohol (PVA) Particles (2024-2032) ($MN)
34 North America Embolization Particle Market Outlook, By Other Products (2024-2032) ($MN)
35 North America Embolization Particle Market Outlook, By Material (2024-2032) ($MN)
36 North America Embolization Particle Market Outlook, By Biodegradable (2024-2032) ($MN)
37 North America Embolization Particle Market Outlook, By Non-biodegradable (2024-2032) ($MN)
38 North America Embolization Particle Market Outlook, By Application (2024-2032) ($MN)
39 North America Embolization Particle Market Outlook, By Oncology (2024-2032) ($MN)
40 North America Embolization Particle Market Outlook, By Urology (2024-2032) ($MN)
41 North America Embolization Particle Market Outlook, By Neurology (2024-2032) ($MN)
42 North America Embolization Particle Market Outlook, By Peripheral Vascular Disease (2024-2032) ($MN)
43 North America Embolization Particle Market Outlook, By Other Applications (2024-2032) ($MN)
44 North America Embolization Particle Market Outlook, By End User (2024-2032) ($MN)
45 North America Embolization Particle Market Outlook, By Hospitals (2024-2032) ($MN)
46 North America Embolization Particle Market Outlook, By Ambulatory Surgical Centers (2024-2032) ($MN)
47 North America Embolization Particle Market Outlook, By Clinics (2024-2032) ($MN)
48 North America Embolization Particle Market Outlook, By Other End Users (2024-2032) ($MN)
49 Europe Embolization Particle Market Outlook, By Country (2024-2032) ($MN)
50 Europe Embolization Particle Market Outlook, By Product (2024-2032) ($MN)
51 Europe Embolization Particle Market Outlook, By Radioembolization Spheres (2024-2032) ($MN)
52 Europe Embolization Particle Market Outlook, By Microspheres (2024-2032) ($MN)
53 Europe Embolization Particle Market Outlook, By Drug Eluting Beads (DEBs) (2024-2032) ($MN)
54 Europe Embolization Particle Market Outlook, By Gelfoam Particles (2024-2032) ($MN)
55 Europe Embolization Particle Market Outlook, By Gelatin Sponge Particles (2024-2032) ($MN)
56 Europe Embolization Particle Market Outlook, By Liquid Embolics (2024-2032) ($MN)
57 Europe Embolization Particle Market Outlook, By Polyvinyl Alcohol (PVA) Particles (2024-2032) ($MN)
58 Europe Embolization Particle Market Outlook, By Other Products (2024-2032) ($MN)
59 Europe Embolization Particle Market Outlook, By Material (2024-2032) ($MN)
60 Europe Embolization Particle Market Outlook, By Biodegradable (2024-2032) ($MN)
61 Europe Embolization Particle Market Outlook, By Non-biodegradable (2024-2032) ($MN)
62 Europe Embolization Particle Market Outlook, By Application (2024-2032) ($MN)
63 Europe Embolization Particle Market Outlook, By Oncology (2024-2032) ($MN)
64 Europe Embolization Particle Market Outlook, By Urology (2024-2032) ($MN)
65 Europe Embolization Particle Market Outlook, By Neurology (2024-2032) ($MN)
66 Europe Embolization Particle Market Outlook, By Peripheral Vascular Disease (2024-2032) ($MN)
67 Europe Embolization Particle Market Outlook, By Other Applications (2024-2032) ($MN)
68 Europe Embolization Particle Market Outlook, By End User (2024-2032) ($MN)
69 Europe Embolization Particle Market Outlook, By Hospitals (2024-2032) ($MN)
70 Europe Embolization Particle Market Outlook, By Ambulatory Surgical Centers (2024-2032) ($MN)
71 Europe Embolization Particle Market Outlook, By Clinics (2024-2032) ($MN)
72 Europe Embolization Particle Market Outlook, By Other End Users (2024-2032) ($MN)
73 Asia Pacific Embolization Particle Market Outlook, By Country (2024-2032) ($MN)
74 Asia Pacific Embolization Particle Market Outlook, By Product (2024-2032) ($MN)
75 Asia Pacific Embolization Particle Market Outlook, By Radioembolization Spheres (2024-2032) ($MN)
76 Asia Pacific Embolization Particle Market Outlook, By Microspheres (2024-2032) ($MN)
77 Asia Pacific Embolization Particle Market Outlook, By Drug Eluting Beads (DEBs) (2024-2032) ($MN)
78 Asia Pacific Embolization Particle Market Outlook, By Gelfoam Particles (2024-2032) ($MN)
79 Asia Pacific Embolization Particle Market Outlook, By Gelatin Sponge Particles (2024-2032) ($MN)
80 Asia Pacific Embolization Particle Market Outlook, By Liquid Embolics (2024-2032) ($MN)
81 Asia Pacific Embolization Particle Market Outlook, By Polyvinyl Alcohol (PVA) Particles (2024-2032) ($MN)
82 Asia Pacific Embolization Particle Market Outlook, By Other Products (2024-2032) ($MN)
83 Asia Pacific Embolization Particle Market Outlook, By Material (2024-2032) ($MN)
84 Asia Pacific Embolization Particle Market Outlook, By Biodegradable (2024-2032) ($MN)
85 Asia Pacific Embolization Particle Market Outlook, By Non-biodegradable (2024-2032) ($MN)
86 Asia Pacific Embolization Particle Market Outlook, By Application (2024-2032) ($MN)
87 Asia Pacific Embolization Particle Market Outlook, By Oncology (2024-2032) ($MN)
88 Asia Pacific Embolization Particle Market Outlook, By Urology (2024-2032) ($MN)
89 Asia Pacific Embolization Particle Market Outlook, By Neurology (2024-2032) ($MN)
90 Asia Pacific Embolization Particle Market Outlook, By Peripheral Vascular Disease (2024-2032) ($MN)
91 Asia Pacific Embolization Particle Market Outlook, By Other Applications (2024-2032) ($MN)
92 Asia Pacific Embolization Particle Market Outlook, By End User (2024-2032) ($MN)
93 Asia Pacific Embolization Particle Market Outlook, By Hospitals (2024-2032) ($MN)
94 Asia Pacific Embolization Particle Market Outlook, By Ambulatory Surgical Centers (2024-2032) ($MN)
95 Asia Pacific Embolization Particle Market Outlook, By Clinics (2024-2032) ($MN)
96 Asia Pacific Embolization Particle Market Outlook, By Other End Users (2024-2032) ($MN)
97 South America Embolization Particle Market Outlook, By Country (2024-2032) ($MN)
98 South America Embolization Particle Market Outlook, By Product (2024-2032) ($MN)
99 South America Embolization Particle Market Outlook, By Radioembolization Spheres (2024-2032) ($MN)
100 South America Embolization Particle Market Outlook, By Microspheres (2024-2032) ($MN)
101 South America Embolization Particle Market Outlook, By Drug Eluting Beads (DEBs) (2024-2032) ($MN)
102 South America Embolization Particle Market Outlook, By Gelfoam Particles (2024-2032) ($MN)
103 South America Embolization Particle Market Outlook, By Gelatin Sponge Particles (2024-2032) ($MN)
104 South America Embolization Particle Market Outlook, By Liquid Embolics (2024-2032) ($MN)
105 South America Embolization Particle Market Outlook, By Polyvinyl Alcohol (PVA) Particles (2024-2032) ($MN)
106 South America Embolization Particle Market Outlook, By Other Products (2024-2032) ($MN)
107 South America Embolization Particle Market Outlook, By Material (2024-2032) ($MN)
108 South America Embolization Particle Market Outlook, By Biodegradable (2024-2032) ($MN)
109 South America Embolization Particle Market Outlook, By Non-biodegradable (2024-2032) ($MN)
110 South America Embolization Particle Market Outlook, By Application (2024-2032) ($MN)
111 South America Embolization Particle Market Outlook, By Oncology (2024-2032) ($MN)
112 South America Embolization Particle Market Outlook, By Urology (2024-2032) ($MN)
113 South America Embolization Particle Market Outlook, By Neurology (2024-2032) ($MN)
114 South America Embolization Particle Market Outlook, By Peripheral Vascular Disease (2024-2032) ($MN)
115 South America Embolization Particle Market Outlook, By Other Applications (2024-2032) ($MN)
116 South America Embolization Particle Market Outlook, By End User (2024-2032) ($MN)
117 South America Embolization Particle Market Outlook, By Hospitals (2024-2032) ($MN)
118 South America Embolization Particle Market Outlook, By Ambulatory Surgical Centers (2024-2032) ($MN)
119 South America Embolization Particle Market Outlook, By Clinics (2024-2032) ($MN)
120 South America Embolization Particle Market Outlook, By Other End Users (2024-2032) ($MN)
121 Middle East & Africa Embolization Particle Market Outlook, By Country (2024-2032) ($MN)
122 Middle East & Africa Embolization Particle Market Outlook, By Product (2024-2032) ($MN)
123 Middle East & Africa Embolization Particle Market Outlook, By Radioembolization Spheres (2024-2032) ($MN)
124 Middle East & Africa Embolization Particle Market Outlook, By Microspheres (2024-2032) ($MN)
125 Middle East & Africa Embolization Particle Market Outlook, By Drug Eluting Beads (DEBs) (2024-2032) ($MN)
126 Middle East & Africa Embolization Particle Market Outlook, By Gelfoam Particles (2024-2032) ($MN)
127 Middle East & Africa Embolization Particle Market Outlook, By Gelatin Sponge Particles (2024-2032) ($MN)
128 Middle East & Africa Embolization Particle Market Outlook, By Liquid Embolics (2024-2032) ($MN)
129 Middle East & Africa Embolization Particle Market Outlook, By Polyvinyl Alcohol (PVA) Particles (2024-2032) ($MN)
130 Middle East & Africa Embolization Particle Market Outlook, By Other Products (2024-2032) ($MN)
131 Middle East & Africa Embolization Particle Market Outlook, By Material (2024-2032) ($MN)
132 Middle East & Africa Embolization Particle Market Outlook, By Biodegradable (2024-2032) ($MN)
133 Middle East & Africa Embolization Particle Market Outlook, By Non-biodegradable (2024-2032) ($MN)
134 Middle East & Africa Embolization Particle Market Outlook, By Application (2024-2032) ($MN)
135 Middle East & Africa Embolization Particle Market Outlook, By Oncology (2024-2032) ($MN)
136 Middle East & Africa Embolization Particle Market Outlook, By Urology (2024-2032) ($MN)
137 Middle East & Africa Embolization Particle Market Outlook, By Neurology (2024-2032) ($MN)
138 Middle East & Africa Embolization Particle Market Outlook, By Peripheral Vascular Disease (2024-2032) ($MN)
139 Middle East & Africa Embolization Particle Market Outlook, By Other Applications (2024-2032) ($MN)
140 Middle East & Africa Embolization Particle Market Outlook, By End User (2024-2032) ($MN)
141 Middle East & Africa Embolization Particle Market Outlook, By Hospitals (2024-2032) ($MN)
142 Middle East & Africa Embolization Particle Market Outlook, By Ambulatory Surgical Centers (2024-2032) ($MN)
143 Middle East & Africa Embolization Particle Market Outlook, By Clinics (2024-2032) ($MN)
144 Middle East & Africa Embolization Particle Market Outlook, By Other End Users (2024-2032) ($MN)
List of Figures
RESEARCH METHODOLOGY

We at ‘Stratistics’ opt for an extensive research approach which involves data mining, data validation, and data analysis. The various research sources include in-house repository, secondary research, competitor’s sources, social media research, client internal data, and primary research.
Our team of analysts prefers the most reliable and authenticated data sources in order to perform the comprehensive literature search. With access to most of the authenticated data bases our team highly considers the best mix of information through various sources to obtain extensive and accurate analysis.
Each report takes an average time of a month and a team of 4 industry analysts. The time may vary depending on the scope and data availability of the desired market report. The various parameters used in the market assessment are standardized in order to enhance the data accuracy.
Data Mining
The data is collected from several authenticated, reliable, paid and unpaid sources and is filtered depending on the scope & objective of the research. Our reports repository acts as an added advantage in this procedure. Data gathering from the raw material suppliers, distributors and the manufacturers is performed on a regular basis, this helps in the comprehensive understanding of the products value chain. Apart from the above mentioned sources the data is also collected from the industry consultants to ensure the objective of the study is in the right direction.
Market trends such as technological advancements, regulatory affairs, market dynamics (Drivers, Restraints, Opportunities and Challenges) are obtained from scientific journals, market related national & international associations and organizations.
Data Analysis
From the data that is collected depending on the scope & objective of the research the data is subjected for the analysis. The critical steps that we follow for the data analysis include:
- Product Lifecycle Analysis
- Competitor analysis
- Risk analysis
- Porters Analysis
- PESTEL Analysis
- SWOT Analysis
The data engineering is performed by the core industry experts considering both the Marketing Mix Modeling and the Demand Forecasting. The marketing mix modeling makes use of multiple-regression techniques to predict the optimal mix of marketing variables. Regression factor is based on a number of variables and how they relate to an outcome such as sales or profits.
Data Validation
The data validation is performed by the exhaustive primary research from the expert interviews. This includes telephonic interviews, focus groups, face to face interviews, and questionnaires to validate our research from all aspects. The industry experts we approach come from the leading firms, involved in the supply chain ranging from the suppliers, distributors to the manufacturers and consumers so as to ensure an unbiased analysis.
We are in touch with more than 15,000 industry experts with the right mix of consultants, CEO's, presidents, vice presidents, managers, experts from both supply side and demand side, executives and so on.
The data validation involves the primary research from the industry experts belonging to:
- Leading Companies
- Suppliers & Distributors
- Manufacturers
- Consumers
- Industry/Strategic Consultants
Apart from the data validation the primary research also helps in performing the fill gap research, i.e. providing solutions for the unmet needs of the research which helps in enhancing the reports quality.
For more details about research methodology, kindly write to us at info@strategymrc.com
Frequently Asked Questions
In case of any queries regarding this report, you can contact the customer service by filing the “Inquiry Before Buy” form available on the right hand side. You may also contact us through email: info@strategymrc.com or phone: +1-301-202-5929
Yes, the samples are available for all the published reports. You can request them by filling the “Request Sample” option available in this page.
Yes, you can request a sample with your specific requirements. All the customized samples will be provided as per the requirement with the real data masked.
All our reports are available in Digital PDF format. In case if you require them in any other formats, such as PPT, Excel etc you can submit a request through “Inquiry Before Buy” form available on the right hand side. You may also contact us through email: info@strategymrc.com or phone: +1-301-202-5929
We offer a free 15% customization with every purchase. This requirement can be fulfilled for both pre and post sale. You may send your customization requirements through email at info@strategymrc.com or call us on +1-301-202-5929.
We have 3 different licensing options available in electronic format.
- Single User Licence: Allows one person, typically the buyer, to have access to the ordered product. The ordered product cannot be distributed to anyone else.
- 2-5 User Licence: Allows the ordered product to be shared among a maximum of 5 people within your organisation.
- Corporate License: Allows the product to be shared among all employees of your organisation regardless of their geographical location.
All our reports are typically be emailed to you as an attachment.
To order any available report you need to register on our website. The payment can be made either through CCAvenue or PayPal payments gateways which accept all international cards.
We extend our support to 6 months post sale. A post sale customization is also provided to cover your unmet needs in the report.
Request Customization
We offer complimentary customization of up to 15% with every purchase. To share your customization requirements, feel free to email us at info@strategymrc.com or call us on +1-301-202-5929. .
Please Note: Customization within the 15% threshold is entirely free of charge. If your request exceeds this limit, we will conduct a feasibility assessment. Following that, a detailed quote and timeline will be provided.
WHY CHOOSE US ?

Assured Quality
Best in class reports with high standard of research integrity

24X7 Research Support
Continuous support to ensure the best customer experience.

Free Customization
Adding more values to your product of interest.

Safe & Secure Access
Providing a secured environment for all online transactions.

Trusted by 600+ Brands
Serving the most reputed brands across the world.