
Emotional Regulation Apps Market
Emotional Regulation Apps Market Forecasts to 2034 - Global Analysis By App Type (Mood Tracking Applications, Mindfulness and Meditation Apps, Cognitive Behavioral Therapy (CBT)-Based Apps, Stress and Anxiety Management Apps, Adolescent Emotional Support Apps, Workplace Emotional Wellness Apps, and AI Chatbot-Based Emotional Support Platforms), Platform, Technology, Application, End User, and By Geography

|
Years Covered |
2023-2034 |
|
Estimated Year Value (2026) |
US $9.4 BN |
|
Projected Year Value (2034) |
US $15.8 BN |
|
CAGR (2026 - 2034) |
6.7% |
|
Regions Covered |
North America, Europe, Asia Pacific, South America, and Rest of the World (RoW) |
|
Countries Covered |
United States, Canada, Mexico, United Kingdom, Germany, France, Italy, Spain, Netherlands, Belgium, Sweden, Switzerland, Poland, Rest of Europe, China, Japan, India, South Korea, Australia, Indonesia, Thailand, Malaysia, Singapore, Vietnam, Rest of Asia Pacific, Brazil, Argentina, Colombia, Chile, Peru, Rest of South America, Saudi Arabia, United Arab Emirates, Qatar, Israel, Rest of Middle East, South Africa, Egypt, Morocco, and Rest of Africa. |
|
Largest Market |
North America |
|
Highest Growing Market |
Asia Pacific |
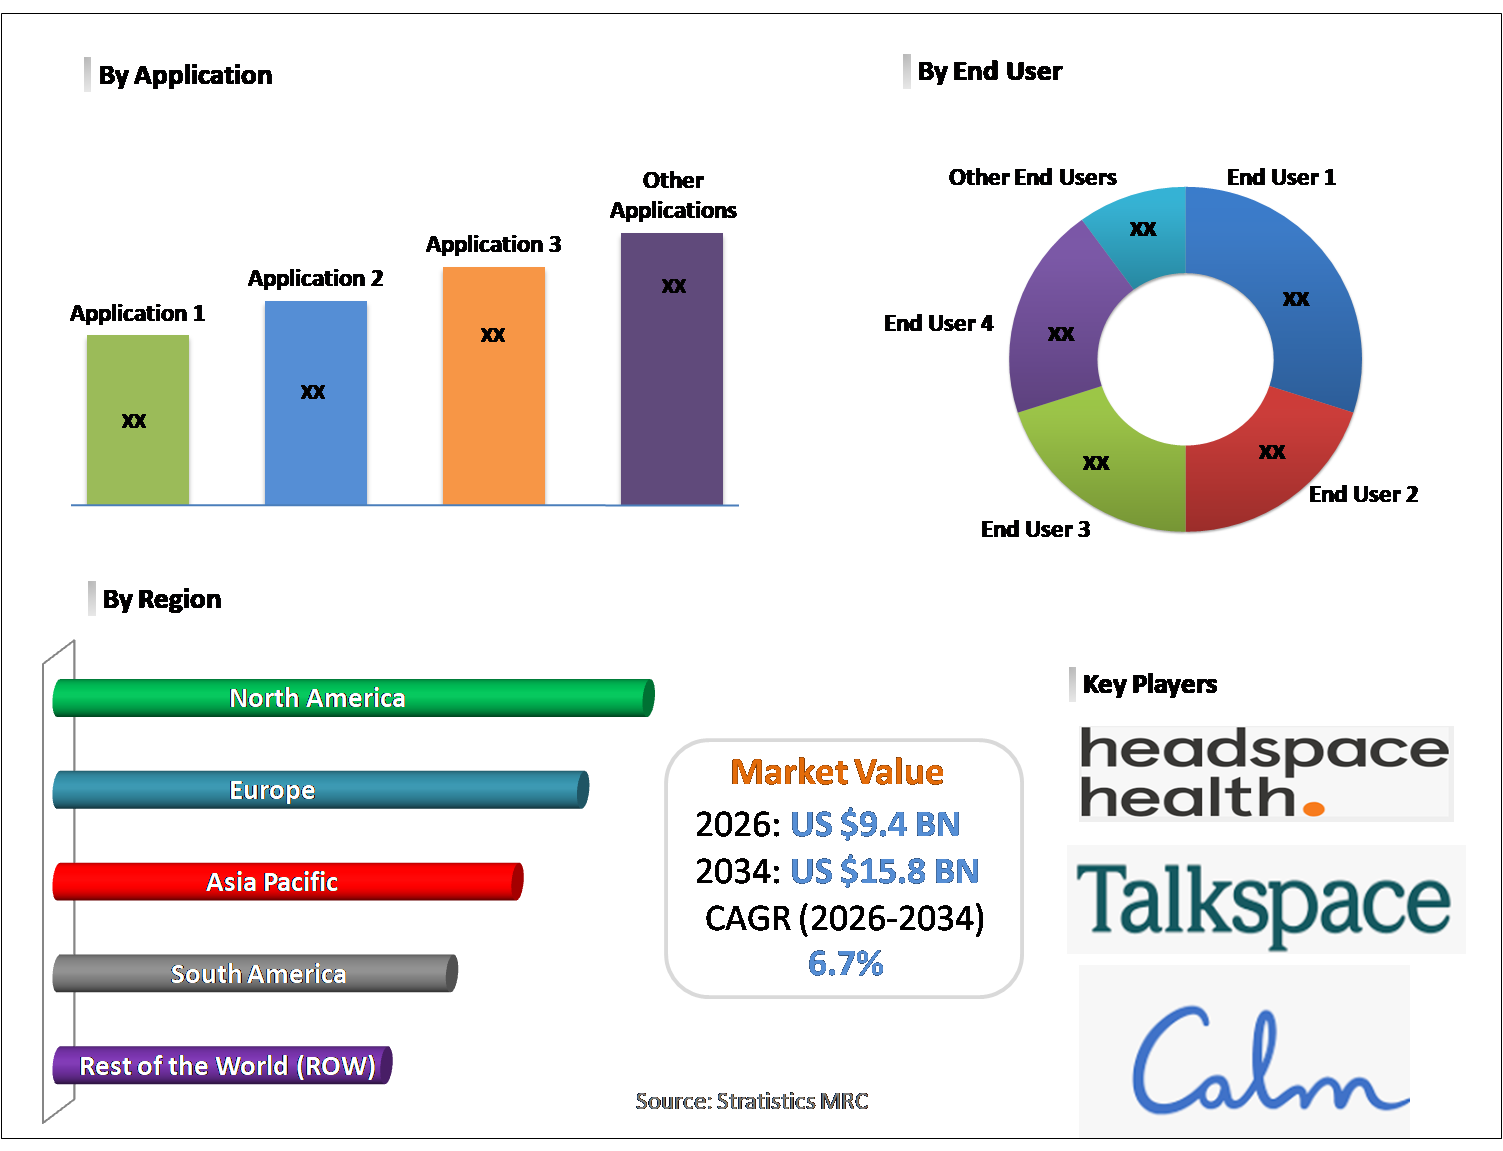
According to Stratistics MRC, the Global Emotional Regulation Apps Market is accounted for $9.4 billion in 2026 and is expected to reach $15.8 billion by 2034 growing at a CAGR of 6.7% during the forecast period. Emotional regulation apps are mobile applications designed to help individuals manage their feelings and reactions in healthy ways. They provide tools such as guided breathing, mindfulness exercises, journaling prompts, and mood tracking to support emotional balance. These apps often use personalized feedback and reminders to encourage consistent practice. They are useful for people dealing with stress, anxiety, or mood swings, offering accessible support anytime. The goal is to empower users to recognize emotions, respond constructively, and build resilience in everyday life.
Market Dynamics:
Driver:
Rising mental wellness app adoption
Rising mental wellness app adoption is significantly propelling the emotional regulation apps market. Driven by increasing awareness of anxiety, stress, and behavioral health management, consumers are turning toward digital self-regulation tools. Moreover, growing smartphone penetration and digital health acceptance are expanding the total addressable user base. Employers and educational institutions are also promoting app-based emotional support programs. Spurred by advancements in AI-driven sentiment analysis, personalized emotional insights are improving user value propositions. Consequently, digital mental health engagement is strengthening overall market expansion.
Restraint:
Low long-term user engagement rates
Low long-term user engagement rates continue to moderate sustained revenue generation. Although initial downloads remain high, retention challenges impact subscription renewals. Furthermore, limited clinical personalization reduces perceived therapeutic effectiveness for some users. Behavioral fatigue and notification overload may also discourage consistent usage. As a result, monetization models dependent on recurring subscriptions face churn-related volatility. Therefore, engagement sustainability remains a structural restraint within the competitive landscape.
Opportunity:
Integration with wearable biometric devices
Integration with wearable biometric devices presents a strong scalability opportunity. By leveraging real-time physiological indicators such as heart rate variability and sleep metrics, emotional regulation apps can deliver data-driven interventions. Additionally, interoperability with smartwatches enhances personalized feedback loops. Encouraged by the quantified-self movement, users increasingly prefer actionable wellness analytics. Strategic collaborations with wearable technology providers further expand ecosystem integration. Consequently, biometric-enabled emotional intelligence platforms are unlocking differentiated growth avenues.
Threat:
Intense competition from free applications
Intense competition from free applications poses significant pricing pressure. The presence of freemium models and open-access meditation tools reduces consumer willingness to pay premium subscription fees. Moreover, low barriers to entry intensify app store saturation. Larger digital health platforms may also bundle emotional regulation features into broader wellness suites. As a result, customer acquisition costs are rising amid heightened competitive intensity. Therefore, market fragmentation remains a persistent external threat.
Covid-19 Impact:
The COVID-19 pandemic accelerated adoption of emotional regulation apps as lockdowns heightened stress and social isolation. With limited access to in-person therapy, users increasingly relied on mobile mental health tools. Additionally, remote work dynamics amplified demand for digital emotional support solutions. App downloads surged during peak lockdown phases. Although post-pandemic normalization moderated growth rates, digital mental wellness behaviors remained elevated. Consequently, the pandemic acted as a structural catalyst for long-term market expansion.
The mood tracking applications segment is expected to be the largest during the forecast period
The mood tracking applications segment is expected to account for the largest market share during the forecast period, driven by strong consumer preference for self-monitoring tools. These applications enable users to log emotional patterns and identify behavioral triggers. Furthermore, data visualization dashboards enhance engagement and perceived therapeutic value. Integration with journaling and AI-based recommendations strengthens user retention. As a result, mood tracking solutions generate substantial recurring subscription revenue within the market.
The iOS-based applications segment is expected to have the highest CAGR during the forecast period
Over the forecast period, the iOS-based applications segment is predicted to witness the highest growth rate, due to higher monetization potential within the Apple ecosystem. iOS users typically demonstrate stronger in-app purchase conversion rates. Additionally, stringent app quality standards enhance consumer trust and premium positioning. Integration with Apple Health further supports biometric synchronization. Therefore, platform-specific revenue optimization is driving accelerated CAGR for iOS-based emotional regulation applications.
Region with largest share:
During the forecast period, the North America region is expected to hold the largest market share, supported by high digital health penetration and strong mental health awareness. The United States leads in subscription-based wellness app adoption. Moreover, employer-sponsored mental health initiatives strengthen enterprise-driven demand. Favorable reimbursement evolution for digital therapeutics further enhances commercialization prospects. Consequently, North America maintains dominant regional positioning.
Region with highest CAGR:
Over the forecast period, the Asia Pacific region is anticipated to exhibit the highest CAGR, driven by expanding smartphone usage and rising mental health awareness. Rapid urbanization and increasing work-related stress are amplifying demand for digital emotional support tools. Additionally, growing youth demographics accelerate app adoption trends. Government-backed digital health initiatives further stimulate market development. Therefore, Asia Pacific is emerging as the fastest-growing regional market.

Key players in the market
Some of the key players in Emotional Regulation Apps Market include Headspace Health, Calm.com, Inc., Talkspace, Inc., BetterHelp (Teladoc Health, Inc.), Lyra Health, Inc., Spring Health, Cerebral Inc., Ginger (Headspace Health), Moodfit, Sanvello Health, Woebot Health, Happify Health, Youper, Inc., Shine (Acquire by Headspace), Noom, Inc., Fabulous, Simple Habit, and MindDoc Health.
Key Developments:
In November 2025, Headspace Health expanded its emotional regulation platform with AI-driven personalized mindfulness programs. The update integrates biometric feedback, adaptive meditation sessions, and clinical-grade tracking, supporting both consumer wellness and enterprise mental health initiatives.
In October 2025, Calm introduced interactive emotional regulation modules combining guided breathing, journaling, and sleep optimization. The launch emphasized gamified engagement, workplace integration, and real-time stress monitoring, targeting both individual users and corporate wellness programs.
In August 2025, Lyra Health introduced enterprise-focused emotional regulation platforms with embedded analytics. The system provides employees with personalized coping strategies, resilience-building exercises, and confidential support, while offering employers aggregated insights into workforce emotional well-being trends.
App Types Covered:
• Mood Tracking Applications
• Mindfulness and Meditation Apps
• Cognitive Behavioral Therapy (CBT)-Based Apps
• Stress and Anxiety Management Apps
• Adolescent Emotional Support Apps
• Workplace Emotional Wellness Apps
• AI Chatbot-Based Emotional Support Platforms
Platforms Covered:
• iOS-Based Applications
• Android-Based Applications
• Web-Based Platforms
• Cross-Platform Applications
• Wearable Device-Integrated Apps
• Enterprise Wellness Platforms
Technologies Covered:
• AI-Powered Personalization Engines
• Machine Learning Mood Analytics
• Biofeedback Integration
• Natural Language Processing Chatbots
• Gamification-Based Engagement Tools
• Cloud-Based Data Management Systems
Applications Covered:
• Stress Reduction
• Anxiety and Depression Management
• Workplace Productivity Enhancement
• School-Based Mental Health Support
• Sleep Improvement
• Trauma and PTSD Support
End Users Covered:
• Individual Consumers
• Employers and Corporate Wellness Programs
• Schools and Universities
• Healthcare Providers
• Insurance Companies
• Government and Public Health Agencies
Regions Covered:
• North America
o United States
o Canada
o Mexico
• Europe
o United Kingdom
o Germany
o France
o Italy
o Spain
o Netherlands
o Belgium
o Sweden
o Switzerland
o Poland
o Rest of Europe
• Asia Pacific
o China
o Japan
o India
o South Korea
o Australia
o Indonesia
o Thailand
o Malaysia
o Singapore
o Vietnam
o Rest of Asia Pacific
• South America
o Brazil
o Argentina
o Colombia
o Chile
o Peru
o Rest of South America
• Rest of the World (RoW)
o Middle East
§ Saudi Arabia
§ United Arab Emirates
§ Qatar
§ Israel
§ Rest of Middle East
o Africa
§ South Africa
§ Egypt
§ Morocco
§ Rest of Africa
What our report offers:
- Market share assessments for the regional and country-level segments
- Strategic recommendations for the new entrants
- Covers Market data for the years 2023, 2024, 2025, 2026, 2027, 2028, 2030, 2032 and 2034
- Market Trends (Drivers, Constraints, Opportunities, Threats, Challenges, Investment Opportunities, and recommendations)
- Strategic recommendations in key business segments based on the market estimations
- Competitive landscaping mapping the key common trends
- Company profiling with detailed strategies, financials, and recent developments
- Supply chain trends mapping the latest technological advancements
Free Customization Offerings:
All the customers of this report will be entitled to receive one of the following free customization options:
• Company Profiling
o Comprehensive profiling of additional market players (up to 3)
o SWOT Analysis of key players (up to 3)
• Regional Segmentation
o Market estimations, Forecasts and CAGR of any prominent country as per the client's interest (Note: Depends on feasibility check)
• Competitive Benchmarking
o Benchmarking of key players based on product portfolio, geographical presence, and strategic alliances
Table of Contents
1 Executive Summary
1.1 Market Snapshot and Key Highlights
1.2 Growth Drivers, Challenges, and Opportunities
1.3 Competitive Landscape Overview
1.4 Strategic Insights and Recommendations
2 Research Framework
2.1 Study Objectives and Scope
2.2 Stakeholder Analysis
2.3 Research Assumptions and Limitations
2.4 Research Methodology
2.4.1 Data Collection (Primary and Secondary)
2.4.2 Data Modeling and Estimation Techniques
2.4.3 Data Validation and Triangulation
2.4.4 Analytical and Forecasting Approach
3 Market Dynamics and Trend Analysis
3.1 Market Definition and Structure
3.2 Key Market Drivers
3.3 Market Restraints and Challenges
3.4 Growth Opportunities and Investment Hotspots
3.5 Industry Threats and Risk Assessment
3.6 Technology and Innovation Landscape
3.7 Emerging and High-Growth Markets
3.8 Regulatory and Policy Environment
3.9 Impact of COVID-19 and Recovery Outlook
4 Competitive and Strategic Assessment
4.1 Porter's Five Forces Analysis
4.1.1 Supplier Bargaining Power
4.1.2 Buyer Bargaining Power
4.1.3 Threat of Substitutes
4.1.4 Threat of New Entrants
4.1.5 Competitive Rivalry
4.2 Market Share Analysis of Key Players
4.3 Product Benchmarking and Performance Comparison
5 Global Emotional Regulation Apps Market, By App Type
5.1 Mood Tracking Applications
5.2 Mindfulness and Meditation Apps
5.3 Cognitive Behavioral Therapy (CBT)-Based Apps
5.4 Stress and Anxiety Management Apps
5.5 Adolescent Emotional Support Apps
5.6 Workplace Emotional Wellness Apps
5.7 AI Chatbot-Based Emotional Support Platforms
6 Global Emotional Regulation Apps Market, By Platform
6.1 iOS-Based Applications
6.2 Android-Based Applications
6.3 Web-Based Platforms
6.4 Cross-Platform Applications
6.5 Wearable Device-Integrated Apps
6.6 Enterprise Wellness Platforms
7 Global Emotional Regulation Apps Market, By Technology
7.1 AI-Powered Personalization Engines
7.2 Machine Learning Mood Analytics
7.3 Biofeedback Integration
7.4 Natural Language Processing Chatbots
7.5 Gamification-Based Engagement Tools
7.6 Cloud-Based Data Management Systems
8 Global Emotional Regulation Apps Market, By Application
8.1 Stress Reduction
8.2 Anxiety and Depression Management
8.3 Workplace Productivity Enhancement
8.4 School-Based Mental Health Support
8.5 Sleep Improvement
8.6 Trauma and PTSD Support
9 Global Emotional Regulation Apps Market, By End User
9.1 Individual Consumers
9.2 Employers and Corporate Wellness Programs
9.3 Schools and Universities
9.4 Healthcare Providers
9.5 Insurance Companies
9.6 Government and Public Health Agencies
10 Global Emotional Regulation Apps Market, By Geography
10.1 North America
10.1.1 United States
10.1.2 Canada
10.1.3 Mexico
10.2 Europe
10.2.1 United Kingdom
10.2.2 Germany
10.2.3 France
10.2.4 Italy
10.2.5 Spain
10.2.6 Netherlands
10.2.7 Belgium
10.2.8 Sweden
10.2.9 Switzerland
10.2.10 Poland
10.2.11 Rest of Europe
10.3 Asia Pacific
10.3.1 China
10.3.2 Japan
10.3.3 India
10.3.4 South Korea
10.3.5 Australia
10.3.6 Indonesia
10.3.7 Thailand
10.3.8 Malaysia
10.3.9 Singapore
10.3.10 Vietnam
10.3.11 Rest of Asia Pacific
10.4 South America
10.4.1 Brazil
10.4.2 Argentina
10.4.3 Colombia
10.4.4 Chile
10.4.5 Peru
10.4.6 Rest of South America
10.5 Rest of the World (RoW)
10.5.1 Middle East
10.5.1.1 Saudi Arabia
10.5.1.2 United Arab Emirates
10.5.1.3 Qatar
10.5.1.4 Israel
10.5.1.5 Rest of Middle East
10.5.2 Africa
10.5.2.1 South Africa
10.5.2.2 Egypt
10.5.2.3 Morocco
10.5.2.4 Rest of Africa
11 Strategic Market Intelligence
11.1 Industry Value Network and Supply Chain Assessment
11.2 White-Space and Opportunity Mapping
11.3 Product Evolution and Market Life Cycle Analysis
11.4 Channel, Distributor, and Go-to-Market Assessment
12 Industry Developments and Strategic Initiatives
12.1 Mergers and Acquisitions
12.2 Partnerships, Alliances, and Joint Ventures
12.3 New Product Launches and Certifications
12.4 Capacity Expansion and Investments
12.5 Other Strategic Initiatives
13 Company Profiles
13.1 Headspace Health
13.2 Calm.com, Inc.
13.3 Talkspace, Inc.
13.4 BetterHelp (Teladoc Health, Inc.)
13.5 Lyra Health, Inc.
13.6 Spring Health
13.7 Cerebral Inc.
13.8 Ginger (Headspace Health)
13.9 Moodfit
13.10 Sanvello Health
13.11 Woebot Health
13.12 Happify Health
13.13 Youper, Inc.
13.14 Shine (Acquire by Headspace)
13.15 Noom, Inc.
13.16 Fabulous
13.17 Simple Habit
13.18 MindDoc Health
List of Tables
1 Global Emotional Regulation Apps Market Outlook, By Region (2023-2034) ($MN)
2 Global Emotional Regulation Apps Market Outlook, By App Type (2023-2034) ($MN)
3 Global Emotional Regulation Apps Market Outlook, By Mood Tracking Applications (2023-2034) ($MN)
4 Global Emotional Regulation Apps Market Outlook, By Mindfulness and Meditation Apps (2023-2034) ($MN)
5 Global Emotional Regulation Apps Market Outlook, By Cognitive Behavioral Therapy (CBT)-Based Apps (2023-2034) ($MN)
6 Global Emotional Regulation Apps Market Outlook, By Stress and Anxiety Management Apps (2023-2034) ($MN)
7 Global Emotional Regulation Apps Market Outlook, By Adolescent Emotional Support Apps (2023-2034) ($MN)
8 Global Emotional Regulation Apps Market Outlook, By Workplace Emotional Wellness Apps (2023-2034) ($MN)
9 Global Emotional Regulation Apps Market Outlook, By AI Chatbot-Based Emotional Support Platforms (2023-2034) ($MN)
10 Global Emotional Regulation Apps Market Outlook, By Platform (2023-2034) ($MN)
11 Global Emotional Regulation Apps Market Outlook, By iOS-Based Applications (2023-2034) ($MN)
12 Global Emotional Regulation Apps Market Outlook, By Android-Based Applications (2023-2034) ($MN)
13 Global Emotional Regulation Apps Market Outlook, By Web-Based Platforms (2023-2034) ($MN)
14 Global Emotional Regulation Apps Market Outlook, By Cross-Platform Applications (2023-2034) ($MN)
15 Global Emotional Regulation Apps Market Outlook, By Wearable Device-Integrated Apps (2023-2034) ($MN)
16 Global Emotional Regulation Apps Market Outlook, By Enterprise Wellness Platforms (2023-2034) ($MN)
17 Global Emotional Regulation Apps Market Outlook, By Technology (2023-2034) ($MN)
18 Global Emotional Regulation Apps Market Outlook, By AI-Powered Personalization Engines (2023-2034) ($MN)
19 Global Emotional Regulation Apps Market Outlook, By Machine Learning Mood Analytics (2023-2034) ($MN)
20 Global Emotional Regulation Apps Market Outlook, By Biofeedback Integration (2023-2034) ($MN)
21 Global Emotional Regulation Apps Market Outlook, By Natural Language Processing Chatbots (2023-2034) ($MN)
22 Global Emotional Regulation Apps Market Outlook, By Gamification-Based Engagement Tools (2023-2034) ($MN)
23 Global Emotional Regulation Apps Market Outlook, By Cloud-Based Data Management Systems (2023-2034) ($MN)
24 Global Emotional Regulation Apps Market Outlook, By Application (2023-2034) ($MN)
25 Global Emotional Regulation Apps Market Outlook, By Stress Reduction (2023-2034) ($MN)
26 Global Emotional Regulation Apps Market Outlook, By Anxiety and Depression Management (2023-2034) ($MN)
27 Global Emotional Regulation Apps Market Outlook, By Workplace Productivity Enhancement (2023-2034) ($MN)
28 Global Emotional Regulation Apps Market Outlook, By School-Based Mental Health Support (2023-2034) ($MN)
29 Global Emotional Regulation Apps Market Outlook, By Sleep Improvement (2023-2034) ($MN)
30 Global Emotional Regulation Apps Market Outlook, By Trauma and PTSD Support (2023-2034) ($MN)
31 Global Emotional Regulation Apps Market Outlook, By End User (2023-2034) ($MN)
32 Global Emotional Regulation Apps Market Outlook, By Individual Consumers (2023-2034) ($MN)
33 Global Emotional Regulation Apps Market Outlook, By Employers and Corporate Wellness Programs (2023-2034) ($MN)
34 Global Emotional Regulation Apps Market Outlook, By Schools and Universities (2023-2034) ($MN)
35 Global Emotional Regulation Apps Market Outlook, By Healthcare Providers (2023-2034) ($MN)
36 Global Emotional Regulation Apps Market Outlook, By Insurance Companies (2023-2034) ($MN)
37 Global Emotional Regulation Apps Market Outlook, By Government and Public Health Agencies (2023-2034) ($MN)
Note: Tables for North America, Europe, APAC, South America, and Rest of the World (RoW) Regions are also represented in the same manner as above.
List of Figures
RESEARCH METHODOLOGY

We at ‘Stratistics’ opt for an extensive research approach which involves data mining, data validation, and data analysis. The various research sources include in-house repository, secondary research, competitor’s sources, social media research, client internal data, and primary research.
Our team of analysts prefers the most reliable and authenticated data sources in order to perform the comprehensive literature search. With access to most of the authenticated data bases our team highly considers the best mix of information through various sources to obtain extensive and accurate analysis.
Each report takes an average time of a month and a team of 4 industry analysts. The time may vary depending on the scope and data availability of the desired market report. The various parameters used in the market assessment are standardized in order to enhance the data accuracy.
Data Mining
The data is collected from several authenticated, reliable, paid and unpaid sources and is filtered depending on the scope & objective of the research. Our reports repository acts as an added advantage in this procedure. Data gathering from the raw material suppliers, distributors and the manufacturers is performed on a regular basis, this helps in the comprehensive understanding of the products value chain. Apart from the above mentioned sources the data is also collected from the industry consultants to ensure the objective of the study is in the right direction.
Market trends such as technological advancements, regulatory affairs, market dynamics (Drivers, Restraints, Opportunities and Challenges) are obtained from scientific journals, market related national & international associations and organizations.
Data Analysis
From the data that is collected depending on the scope & objective of the research the data is subjected for the analysis. The critical steps that we follow for the data analysis include:
- Product Lifecycle Analysis
- Competitor analysis
- Risk analysis
- Porters Analysis
- PESTEL Analysis
- SWOT Analysis
The data engineering is performed by the core industry experts considering both the Marketing Mix Modeling and the Demand Forecasting. The marketing mix modeling makes use of multiple-regression techniques to predict the optimal mix of marketing variables. Regression factor is based on a number of variables and how they relate to an outcome such as sales or profits.
Data Validation
The data validation is performed by the exhaustive primary research from the expert interviews. This includes telephonic interviews, focus groups, face to face interviews, and questionnaires to validate our research from all aspects. The industry experts we approach come from the leading firms, involved in the supply chain ranging from the suppliers, distributors to the manufacturers and consumers so as to ensure an unbiased analysis.
We are in touch with more than 15,000 industry experts with the right mix of consultants, CEO's, presidents, vice presidents, managers, experts from both supply side and demand side, executives and so on.
The data validation involves the primary research from the industry experts belonging to:
- Leading Companies
- Suppliers & Distributors
- Manufacturers
- Consumers
- Industry/Strategic Consultants
Apart from the data validation the primary research also helps in performing the fill gap research, i.e. providing solutions for the unmet needs of the research which helps in enhancing the reports quality.
For more details about research methodology, kindly write to us at info@strategymrc.com
Frequently Asked Questions
In case of any queries regarding this report, you can contact the customer service by filing the “Inquiry Before Buy” form available on the right hand side. You may also contact us through email: info@strategymrc.com or phone: +1-301-202-5929
Yes, the samples are available for all the published reports. You can request them by filling the “Request Sample” option available in this page.
Yes, you can request a sample with your specific requirements. All the customized samples will be provided as per the requirement with the real data masked.
All our reports are available in Digital PDF format. In case if you require them in any other formats, such as PPT, Excel etc you can submit a request through “Inquiry Before Buy” form available on the right hand side. You may also contact us through email: info@strategymrc.com or phone: +1-301-202-5929
We offer a free 15% customization with every purchase. This requirement can be fulfilled for both pre and post sale. You may send your customization requirements through email at info@strategymrc.com or call us on +1-301-202-5929.
We have 3 different licensing options available in electronic format.
- Single User Licence: Allows one person, typically the buyer, to have access to the ordered product. The ordered product cannot be distributed to anyone else.
- 2-5 User Licence: Allows the ordered product to be shared among a maximum of 5 people within your organisation.
- Corporate License: Allows the product to be shared among all employees of your organisation regardless of their geographical location.
All our reports are typically be emailed to you as an attachment.
To order any available report you need to register on our website. The payment can be made either through CCAvenue or PayPal payments gateways which accept all international cards.
We extend our support to 6 months post sale. A post sale customization is also provided to cover your unmet needs in the report.
Request Customization
We offer complimentary customization of up to 15% with every purchase. To share your customization requirements, feel free to email us at info@strategymrc.com or call us on +1-301-202-5929. .
Please Note: Customization within the 15% threshold is entirely free of charge. If your request exceeds this limit, we will conduct a feasibility assessment. Following that, a detailed quote and timeline will be provided.
WHY CHOOSE US ?

Assured Quality
Best in class reports with high standard of research integrity

24X7 Research Support
Continuous support to ensure the best customer experience.

Free Customization
Adding more values to your product of interest.

Safe & Secure Access
Providing a secured environment for all online transactions.

Trusted by 600+ Brands
Serving the most reputed brands across the world.