
Energy Bar Market
Energy Bar Market Forecasts to 2028 - Global Analysis By Type (Cereal Bar, Protein Bar, Fiber Bar, Nutrition Bar, Endurance Bars, Activity Bars, Oat Bars and Other Types), Distribution Channel, Flavor, Nature and By Geography

|
Years Covered |
2020-2028 |
|
Estimated Year Value (2022) |
US $682.26 MN |
|
Projected Year Value (2028) |
US $1,069.49 MN |
|
CAGR (2022 - 2028) |
7.78% |
|
Regions Covered |
North America, Europe, Asia Pacific, South America, and Middle East & Africa |
|
Countries Covered |
US, Canada, Mexico, Germany, UK, Italy, France, Spain, Japan, China, India, Australia, New Zealand, South Korea, Rest of Asia Pacific, South America, Argentina, Brazil, Chile, Middle East & Africa, Saudi Arabia, UAE, Qatar, and South Africa |
|
Largest Market |
North America |
|
Highest Growing Market |
Europe |
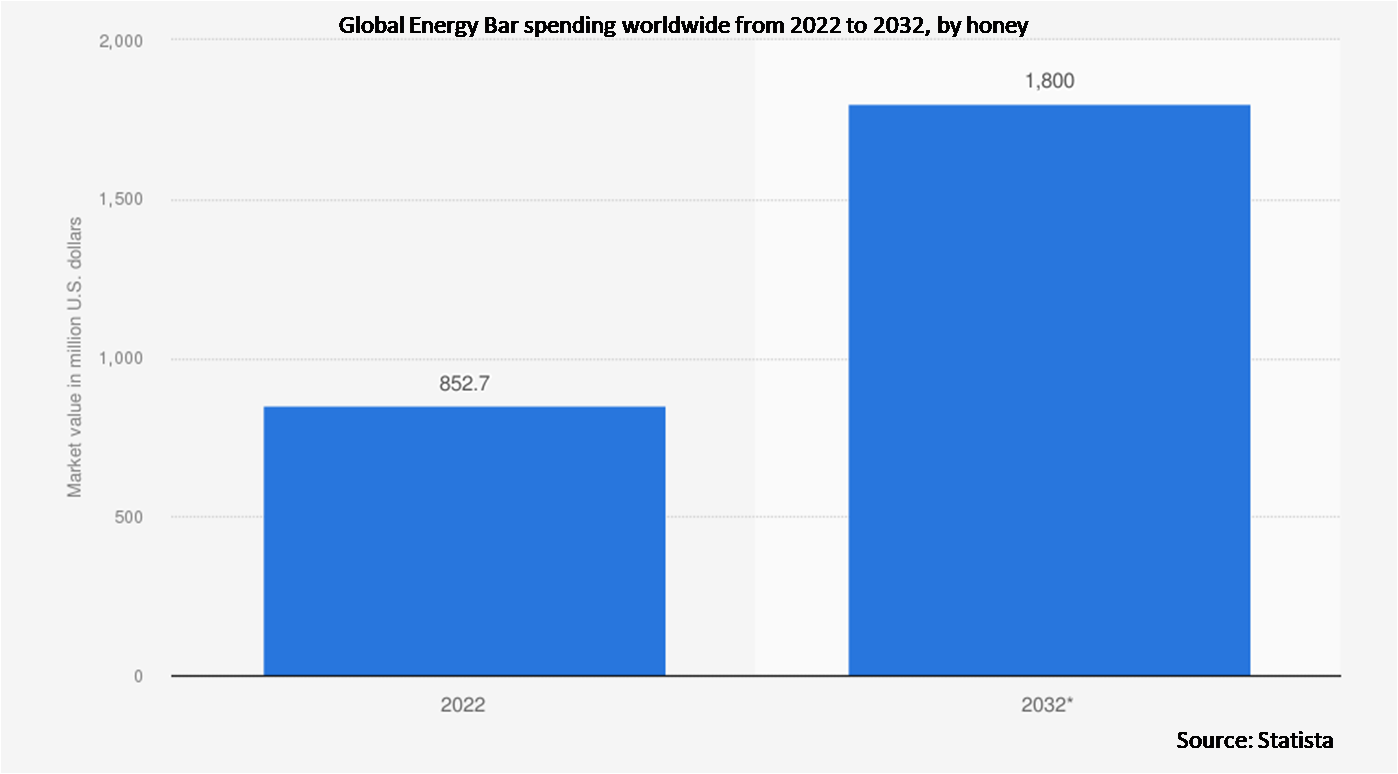
According to Stratistics MRC, the Global Energy Bar Market is accounted for $682.26 million in 2022 and is expected to reach $1,069.49 million by 2028 growing at a CAGR of 7.78% during the forecast period. Supplemental bars known as energy bars offer energy as well as nutritional advantages and dietary benefits. They often serve as a meal replacement because of the proteins, lipids, and carbohydrates they contain, which help to give users rapid energy. The bar might give someone the energy they need to get through a workout or training session thanks to the protein and additional carbohydrates. Additionally, it gives the body the post-workout nutrition it needs to repair any minor muscle tears that may have occurred during the workout and to grow new muscle tissue.
According to the International Food Information Council report on food & health survey, the proportion of American consumers who actively looked for health benefits in their food in 2021 was 20%.
Market Dynamics:
Driver:
Rising popularity for packed food items
Demand for energy bars has increased as consumers' tastes for packaged snacks and sweets have grown. The consumption of energy bars has grown in popularity as customers' spending power has improved and their taste for delicious food has increased. Additionally, the market for energy bars is growing as a result of ingredient variations in snack products that draw consumers' attention and encourage them to buy the products based on their needs.
Restraint:
Preconceptions for snack bars are rapidly changing
The cost of research, production, and distribution infrastructure for the key players rises as a result of frequently changing consumer preferences and tastes for snack food products, which restricts the growth of the energy bar market share. Additionally, it is anticipated that the proliferation of alternatives such as energy drinks, cookies, and powder will restrain the market for energy bars.
Opportunity:
Increased demand for dietary food products
The rising demand for diet foods is the cause of the increased consumption of low-carb and low-fat energy bars. The development of gluten-free and non-allergic nutrition foods has also become more practical as more people are becoming aware of the benefits of natural, chemical-free foods on their health. Additionally, as the prevalence of diabetes rises, more people are consuming low-sugar foods, opening up new market opportunities.
Threat:
High cost of energy bar
The price of the energy bars is higher since they are made with premium components that provide quick energy, like pecans, cashews, and almonds, making them expensive for many individuals. Additionally, premium packaging for energy bars includes wrapping and boxes, raising the overall cost of the energy bars. These are a few of the elements that experts predict will reduce the market value of energy bars.
Covid-19 Impact
Numerous industries suffered significantly as a result of the novel coronavirus pandemic. During this time, the world energy market expanded moderately. The pandemic outbreak had three main effects on the market for energy bars: demand, manufacturing, supply chain, and market disruption. However, due to growing trends of simple provision for nutrition and energy requirements, speedy applications, and convenience of storing, COVID-19 has inflated the demand for creative snacks. As a result, the value of excellent health has increased dramatically, moderately fueling market expansion.
The protein bar segment is expected to be the largest during the forecast period
The protein bar segment is estimated to have a lucrative growth. High-protein, high-carbohydrate snacks include protein bars, which are portable. It is a great source of protein and other vitamins and minerals. Demand for packaged and convenience foods is rising quickly due to increased health awareness, changing socioeconomic circumstances, and a lack of time to prepare nutritious food.
The organic segment is expected to have the highest CAGR during the forecast period
The organic segment is anticipated to witness the highest CAGR growth during the forecast period. Organic energy bars are high-nutrient, nutrient-dense snacks that provide a range of vitamins and minerals to boost physical energy. Ingredients for organic energy bars come from farms that don't use synthetic pesticides or fertilisers. It is projected that the expansion of the organic category will be driven by the increased demand for healthy, organic, high-nutritional-value snacks and the rising need for sports nutrition.
Region with highest share:
North America is projected to hold the largest market share during the forecast period owing to the American way of life is known for being active and fast-paced. Due to its fast-paced lifestyle, the United States, one of the most developed countries, expects extremely easy cuisine. The United States Department of Agriculture (USDA) claims that Americans spend more than half of their food expenditure on quick meals, such as snack bars, which increases the nation's consumption of these goods.
Region with highest CAGR:
Europe is projected to have the highest CAGR over the forecast period. The market was stimulated by greater customer knowledge of a healthier ingredient with nutritional advantages. Customers like functional fruits and grains in energy bars that increase the product's nutritional value, such as berries, hemp, chia, and flaxseed, among others. The market has been driven more by impulse buys than by good eating. However, foods those are high in fibre, low in calories, high in protein, and made with natural ingredients are becoming more and more popular.

Key players in the market
Some of the key players profiled in the Energy Bar Market include Kellogg Company, ProBar LLC, Nature Essential Foods Pvt. Ltd, EAT Anytime, PepsiCo Inc., Lotus Bakeries, General Mills Inc., Kind LLC, Post Holdings Inc., Clif Bar & Company, OTE Sports Ltd, Bumble Bar Inc., Science in Sports PLC, TORQ Limited, Premier Nutrition Inc and Brighter Foods Ltd.
Key Developments:
In August 2022, Clif Bar & Company, which offers a range of energy bars, was acquired by Mondelez International, Inc. With leading brands like CLIF, CLIF Kid, and LUNA complementing the company's refrigerated snacking business in the United States and popular performance nutrition business Grenade in the United Kingdom, the acquisition is anticipated to increase Mondelez International's global snack bar business to more than USD 1 billion.
In August 2021, General Mills, Inc launched Performance Protein bars from Cinnamon Toast Crunch and Golden Grahams brands. These bars contain less sugar and provide up to 20 g of protein in around 63 g of bar weight.
In April 2021, Kellogg India targeted the 'In-between meal' segment. Therefore owing to this factor, they launched the K Energy bars to enter this category.
Types Covered:
• Cereal Bar
• Protein Bar
• Fiber Bar
• Nutrition Bar
• Endurance Bars
• Activity Bars
• Oat Bars
• Other Types
Distribution Channels Covered:
• Specialty Stores
• Hypermarkets & Supermarkets
• Online Sales Channel
• Convenience Stores
• Other Distribution Channels
Flavors Covered:
• Peanut Butter
• Caramel
• Honey
• Chocolate
• Other Flavors
Natures Covered:
• Conventional
• Organic
Regions Covered:
• North America
o US
o Canada
o Mexico
• Europe
o Germany
o UK
o Italy
o France
o Spain
o Rest of Europe
• Asia Pacific
o Japan
o China
o India
o Australia
o New Zealand
o South Korea
o Rest of Asia Pacific
• South America
o Argentina
o Brazil
o Chile
o Rest of South America
• Middle East & Africa
o Saudi Arabia
o UAE
o Qatar
o South Africa
o Rest of Middle East & Africa
What our report offers:
- Market share assessments for the regional and country-level segments
- Strategic recommendations for the new entrants
- Covers Market data for the years 2020, 2021, 2022, 2025, and 2028
- Market Trends (Drivers, Constraints, Opportunities, Threats, Challenges, Investment Opportunities, and recommendations)
- Strategic recommendations in key business segments based on the market estimations
- Competitive landscaping mapping the key common trends
- Company profiling with detailed strategies, financials, and recent developments
- Supply chain trends mapping the latest technological advancements
Free Customization Offerings:
All the customers of this report will be entitled to receive one of the following free customization options:
• Company Profiling
o Comprehensive profiling of additional market players (up to 3)
o SWOT Analysis of key players (up to 3)
• Regional Segmentation
o Market estimations, Forecasts and CAGR of any prominent country as per the client's interest (Note: Depends on feasibility check)
• Competitive Benchmarking
o Benchmarking of key players based on product portfolio, geographical presence, and strategic alliances
Table of Contents
1 Executive Summary
2 Preface
2.1 Abstract
2.2 Stake Holders
2.3 Research Scope
2.4 Research Methodology
2.4.1 Data Mining
2.4.2 Data Analysis
2.4.3 Data Validation
2.4.4 Research Approach
2.5 Research Sources
2.5.1 Primary Research Sources
2.5.2 Secondary Research Sources
2.5.3 Assumptions
3 Market Trend Analysis
3.1 Introduction
3.2 Drivers
3.3 Restraints
3.4 Opportunities
3.5 Threats
3.6 Emerging Markets
3.7 Impact of Covid-19
4 Porters Five Force Analysis
4.1 Bargaining power of suppliers
4.2 Bargaining power of buyers
4.3 Threat of substitutes
4.4 Threat of new entrants
4.5 Competitive rivalry
5 Global Energy Bar Market, By Type
5.1 Introduction
5.2 Cereal Bar
5.3 Protein Bar
5.4 Fiber Bar
5.5 Nutrition Bar
5.6 Endurance Bars
5.7 Activity Bars
5.8 Oat Bars
5.9 Other Types
6 Global Energy Bar Market, By Distribution Channel
6.1 Introduction
6.2 Specialty Stores
6.3 Hypermarkets & Supermarkets
6.4 Online Sales Channel
6.5 Convenience Stores
6.6 Other Distribution Channels
7 Global Energy Bar Market, By Flavor
7.1 Introduction
7.2 Peanut Butter
7.3 Caramel
7.4 Honey
7.5 Chocolate
7.6 Other Flavors
8 Global Energy Bar Market, By Nature
8.1 Introduction
8.2 Conventional
8.3 Organic
9 Global Energy Bar Market, By Geography
9.1 Introduction
9.2 North America
9.2.1 US
9.2.2 Canada
9.2.3 Mexico
9.3 Europe
9.3.1 Germany
9.3.2 UK
9.3.3 Italy
9.3.4 France
9.3.5 Spain
9.3.6 Rest of Europe
9.4 Asia Pacific
9.4.1 Japan
9.4.2 China
9.4.3 India
9.4.4 Australia
9.4.5 New Zealand
9.4.6 South Korea
9.4.7 Rest of Asia Pacific
9.5 South America
9.5.1 Argentina
9.5.2 Brazil
9.5.3 Chile
9.5.4 Rest of South America
9.6 Middle East & Africa
9.6.1 Saudi Arabia
9.6.2 UAE
9.6.3 Qatar
9.6.4 South Africa
9.6.5 Rest of Middle East & Africa
10 Key Developments
10.1 Agreements, Partnerships, Collaborations and Joint Ventures
10.2 Acquisitions & Mergers
10.3 New Product Launch
10.4 Expansions
10.5 Other Key Strategies
11 Company Profiling
11.1 Kellogg Company
11.2 ProBar LLC
11.3 Nature Essential Foods Pvt. Ltd
11.4 EAT Anytime
11.5 PepsiCo Inc.
11.6 Lotus Bakeries
11.7 General Mills Inc.
11.8 Kind LLC
11.9 Post Holdings Inc.
11.10 Clif Bar & Company
11.11 OTE Sports Ltd
11.12 Bumble Bar Inc.
11.13 Science in Sports PLC
11.14 TORQ Limited
11.15 Premier Nutrition Inc.
11.16 Brighter Foods Ltd.
List of Tables
1 Global Energy Bar Market Outlook, By Region (2020-2028) ($MN)
2 Global Energy Bar Market Outlook, By Type (2020-2028) ($MN)
3 Global Energy Bar Market Outlook, By Cereal Bar (2020-2028) ($MN)
4 Global Energy Bar Market Outlook, By Protein Bar (2020-2028) ($MN)
5 Global Energy Bar Market Outlook, By Fiber Bar (2020-2028) ($MN)
6 Global Energy Bar Market Outlook, By Nutrition Bar (2020-2028) ($MN)
7 Global Energy Bar Market Outlook, By Endurance Bars (2020-2028) ($MN)
8 Global Energy Bar Market Outlook, By Activity Bars (2020-2028) ($MN)
9 Global Energy Bar Market Outlook, By Oat Bars (2020-2028) ($MN)
10 Global Energy Bar Market Outlook, By Other Types (2020-2028) ($MN)
11 Global Energy Bar Market Outlook, By Distribution Channel (2020-2028) ($MN)
12 Global Energy Bar Market Outlook, By Specialty Stores (2020-2028) ($MN)
13 Global Energy Bar Market Outlook, By Hypermarkets & Supermarkets (2020-2028) ($MN)
14 Global Energy Bar Market Outlook, By Online Sales Channel (2020-2028) ($MN)
15 Global Energy Bar Market Outlook, By Convenience Stores (2020-2028) ($MN)
16 Global Energy Bar Market Outlook, By Other Distribution Channels (2020-2028) ($MN)
17 Global Energy Bar Market Outlook, By Flavor (2020-2028) ($MN)
18 Global Energy Bar Market Outlook, By Peanut Butter (2020-2028) ($MN)
19 Global Energy Bar Market Outlook, By Caramel (2020-2028) ($MN)
20 Global Energy Bar Market Outlook, By Honey (2020-2028) ($MN)
21 Global Energy Bar Market Outlook, By Chocolate (2020-2028) ($MN)
22 Global Energy Bar Market Outlook, By Other Flavors (2020-2028) ($MN)
23 Global Energy Bar Market Outlook, By Nature (2020-2028) ($MN)
24 Global Energy Bar Market Outlook, By Conventional (2020-2028) ($MN)
25 Global Energy Bar Market Outlook, By Organic (2020-2028) ($MN)
26 North America Energy Bar Market Outlook, By Country (2020-2028) ($MN)
27 North America Energy Bar Market Outlook, By Type (2020-2028) ($MN)
28 North America Energy Bar Market Outlook, By Cereal Bar (2020-2028) ($MN)
29 North America Energy Bar Market Outlook, By Protein Bar (2020-2028) ($MN)
30 North America Energy Bar Market Outlook, By Fiber Bar (2020-2028) ($MN)
31 North America Energy Bar Market Outlook, By Nutrition Bar (2020-2028) ($MN)
32 North America Energy Bar Market Outlook, By Endurance Bars (2020-2028) ($MN)
33 North America Energy Bar Market Outlook, By Activity Bars (2020-2028) ($MN)
34 North America Energy Bar Market Outlook, By Oat Bars (2020-2028) ($MN)
35 North America Energy Bar Market Outlook, By Other Types (2020-2028) ($MN)
36 North America Energy Bar Market Outlook, By Distribution Channel (2020-2028) ($MN)
37 North America Energy Bar Market Outlook, By Specialty Stores (2020-2028) ($MN)
38 North America Energy Bar Market Outlook, By Hypermarkets & Supermarkets (2020-2028) ($MN)
39 North America Energy Bar Market Outlook, By Online Sales Channel (2020-2028) ($MN)
40 North America Energy Bar Market Outlook, By Convenience Stores (2020-2028) ($MN)
41 North America Energy Bar Market Outlook, By Other Distribution Channels (2020-2028) ($MN)
42 North America Energy Bar Market Outlook, By Flavor (2020-2028) ($MN)
43 North America Energy Bar Market Outlook, By Peanut Butter (2020-2028) ($MN)
44 North America Energy Bar Market Outlook, By Caramel (2020-2028) ($MN)
45 North America Energy Bar Market Outlook, By Honey (2020-2028) ($MN)
46 North America Energy Bar Market Outlook, By Chocolate (2020-2028) ($MN)
47 North America Energy Bar Market Outlook, By Other Flavors (2020-2028) ($MN)
48 North America Energy Bar Market Outlook, By Nature (2020-2028) ($MN)
49 North America Energy Bar Market Outlook, By Conventional (2020-2028) ($MN)
50 North America Energy Bar Market Outlook, By Organic (2020-2028) ($MN)
51 Europe Energy Bar Market Outlook, By Country (2020-2028) ($MN)
52 Europe Energy Bar Market Outlook, By Type (2020-2028) ($MN)
53 Europe Energy Bar Market Outlook, By Cereal Bar (2020-2028) ($MN)
54 Europe Energy Bar Market Outlook, By Protein Bar (2020-2028) ($MN)
55 Europe Energy Bar Market Outlook, By Fiber Bar (2020-2028) ($MN)
56 Europe Energy Bar Market Outlook, By Nutrition Bar (2020-2028) ($MN)
57 Europe Energy Bar Market Outlook, By Endurance Bars (2020-2028) ($MN)
58 Europe Energy Bar Market Outlook, By Activity Bars (2020-2028) ($MN)
59 Europe Energy Bar Market Outlook, By Oat Bars (2020-2028) ($MN)
60 Europe Energy Bar Market Outlook, By Other Types (2020-2028) ($MN)
61 Europe Energy Bar Market Outlook, By Distribution Channel (2020-2028) ($MN)
62 Europe Energy Bar Market Outlook, By Specialty Stores (2020-2028) ($MN)
63 Europe Energy Bar Market Outlook, By Hypermarkets & Supermarkets (2020-2028) ($MN)
64 Europe Energy Bar Market Outlook, By Online Sales Channel (2020-2028) ($MN)
65 Europe Energy Bar Market Outlook, By Convenience Stores (2020-2028) ($MN)
66 Europe Energy Bar Market Outlook, By Other Distribution Channels (2020-2028) ($MN)
67 Europe Energy Bar Market Outlook, By Flavor (2020-2028) ($MN)
68 Europe Energy Bar Market Outlook, By Peanut Butter (2020-2028) ($MN)
69 Europe Energy Bar Market Outlook, By Caramel (2020-2028) ($MN)
70 Europe Energy Bar Market Outlook, By Honey (2020-2028) ($MN)
71 Europe Energy Bar Market Outlook, By Chocolate (2020-2028) ($MN)
72 Europe Energy Bar Market Outlook, By Other Flavors (2020-2028) ($MN)
73 Europe Energy Bar Market Outlook, By Nature (2020-2028) ($MN)
74 Europe Energy Bar Market Outlook, By Conventional (2020-2028) ($MN)
75 Europe Energy Bar Market Outlook, By Organic (2020-2028) ($MN)
76 Asia Pacific Energy Bar Market Outlook, By Country (2020-2028) ($MN)
77 Asia Pacific Energy Bar Market Outlook, By Type (2020-2028) ($MN)
78 Asia Pacific Energy Bar Market Outlook, By Cereal Bar (2020-2028) ($MN)
79 Asia Pacific Energy Bar Market Outlook, By Protein Bar (2020-2028) ($MN)
80 Asia Pacific Energy Bar Market Outlook, By Fiber Bar (2020-2028) ($MN)
81 Asia Pacific Energy Bar Market Outlook, By Nutrition Bar (2020-2028) ($MN)
82 Asia Pacific Energy Bar Market Outlook, By Endurance Bars (2020-2028) ($MN)
83 Asia Pacific Energy Bar Market Outlook, By Activity Bars (2020-2028) ($MN)
84 Asia Pacific Energy Bar Market Outlook, By Oat Bars (2020-2028) ($MN)
85 Asia Pacific Energy Bar Market Outlook, By Other Types (2020-2028) ($MN)
86 Asia Pacific Energy Bar Market Outlook, By Distribution Channel (2020-2028) ($MN)
87 Asia Pacific Energy Bar Market Outlook, By Specialty Stores (2020-2028) ($MN)
88 Asia Pacific Energy Bar Market Outlook, By Hypermarkets & Supermarkets (2020-2028) ($MN)
89 Asia Pacific Energy Bar Market Outlook, By Online Sales Channel (2020-2028) ($MN)
90 Asia Pacific Energy Bar Market Outlook, By Convenience Stores (2020-2028) ($MN)
91 Asia Pacific Energy Bar Market Outlook, By Other Distribution Channels (2020-2028) ($MN)
92 Asia Pacific Energy Bar Market Outlook, By Flavor (2020-2028) ($MN)
93 Asia Pacific Energy Bar Market Outlook, By Peanut Butter (2020-2028) ($MN)
94 Asia Pacific Energy Bar Market Outlook, By Caramel (2020-2028) ($MN)
95 Asia Pacific Energy Bar Market Outlook, By Honey (2020-2028) ($MN)
96 Asia Pacific Energy Bar Market Outlook, By Chocolate (2020-2028) ($MN)
97 Asia Pacific Energy Bar Market Outlook, By Other Flavors (2020-2028) ($MN)
98 Asia Pacific Energy Bar Market Outlook, By Nature (2020-2028) ($MN)
99 Asia Pacific Energy Bar Market Outlook, By Conventional (2020-2028) ($MN)
100 Asia Pacific Energy Bar Market Outlook, By Organic (2020-2028) ($MN)
101 South America Energy Bar Market Outlook, By Country (2020-2028) ($MN)
102 South America Energy Bar Market Outlook, By Type (2020-2028) ($MN)
103 South America Energy Bar Market Outlook, By Cereal Bar (2020-2028) ($MN)
104 South America Energy Bar Market Outlook, By Protein Bar (2020-2028) ($MN)
105 South America Energy Bar Market Outlook, By Fiber Bar (2020-2028) ($MN)
106 South America Energy Bar Market Outlook, By Nutrition Bar (2020-2028) ($MN)
107 South America Energy Bar Market Outlook, By Endurance Bars (2020-2028) ($MN)
108 South America Energy Bar Market Outlook, By Activity Bars (2020-2028) ($MN)
109 South America Energy Bar Market Outlook, By Oat Bars (2020-2028) ($MN)
110 South America Energy Bar Market Outlook, By Other Types (2020-2028) ($MN)
111 South America Energy Bar Market Outlook, By Distribution Channel (2020-2028) ($MN)
112 South America Energy Bar Market Outlook, By Specialty Stores (2020-2028) ($MN)
113 South America Energy Bar Market Outlook, By Hypermarkets & Supermarkets (2020-2028) ($MN)
114 South America Energy Bar Market Outlook, By Online Sales Channel (2020-2028) ($MN)
115 South America Energy Bar Market Outlook, By Convenience Stores (2020-2028) ($MN)
116 South America Energy Bar Market Outlook, By Other Distribution Channels (2020-2028) ($MN)
117 South America Energy Bar Market Outlook, By Flavor (2020-2028) ($MN)
118 South America Energy Bar Market Outlook, By Peanut Butter (2020-2028) ($MN)
119 South America Energy Bar Market Outlook, By Caramel (2020-2028) ($MN)
120 South America Energy Bar Market Outlook, By Honey (2020-2028) ($MN)
121 South America Energy Bar Market Outlook, By Chocolate (2020-2028) ($MN)
122 South America Energy Bar Market Outlook, By Other Flavors (2020-2028) ($MN)
123 South America Energy Bar Market Outlook, By Nature (2020-2028) ($MN)
124 South America Energy Bar Market Outlook, By Conventional (2020-2028) ($MN)
125 South America Energy Bar Market Outlook, By Organic (2020-2028) ($MN)
126 Middle East & Africa Energy Bar Market Outlook, By Country (2020-2028) ($MN)
127 Middle East & Africa Energy Bar Market Outlook, By Type (2020-2028) ($MN)
128 Middle East & Africa Energy Bar Market Outlook, By Cereal Bar (2020-2028) ($MN)
129 Middle East & Africa Energy Bar Market Outlook, By Protein Bar (2020-2028) ($MN)
130 Middle East & Africa Energy Bar Market Outlook, By Fiber Bar (2020-2028) ($MN)
131 Middle East & Africa Energy Bar Market Outlook, By Nutrition Bar (2020-2028) ($MN)
132 Middle East & Africa Energy Bar Market Outlook, By Endurance Bars (2020-2028) ($MN)
133 Middle East & Africa Energy Bar Market Outlook, By Activity Bars (2020-2028) ($MN)
134 Middle East & Africa Energy Bar Market Outlook, By Oat Bars (2020-2028) ($MN)
135 Middle East & Africa Energy Bar Market Outlook, By Other Types (2020-2028) ($MN)
136 Middle East & Africa Energy Bar Market Outlook, By Distribution Channel (2020-2028) ($MN)
137 Middle East & Africa Energy Bar Market Outlook, By Specialty Stores (2020-2028) ($MN)
138 Middle East & Africa Energy Bar Market Outlook, By Hypermarkets & Supermarkets (2020-2028) ($MN)
139 Middle East & Africa Energy Bar Market Outlook, By Online Sales Channel (2020-2028) ($MN)
140 Middle East & Africa Energy Bar Market Outlook, By Convenience Stores (2020-2028) ($MN)
141 Middle East & Africa Energy Bar Market Outlook, By Other Distribution Channels (2020-2028) ($MN)
142 Middle East & Africa Energy Bar Market Outlook, By Flavor (2020-2028) ($MN)
143 Middle East & Africa Energy Bar Market Outlook, By Peanut Butter (2020-2028) ($MN)
144 Middle East & Africa Energy Bar Market Outlook, By Caramel (2020-2028) ($MN)
145 Middle East & Africa Energy Bar Market Outlook, By Honey (2020-2028) ($MN)
146 Middle East & Africa Energy Bar Market Outlook, By Chocolate (2020-2028) ($MN)
147 Middle East & Africa Energy Bar Market Outlook, By Other Flavors (2020-2028) ($MN)
148 Middle East & Africa Energy Bar Market Outlook, By Nature (2020-2028) ($MN)
149 Middle East & Africa Energy Bar Market Outlook, By Conventional (2020-2028) ($MN)
150 Middle East & Africa Energy Bar Market Outlook, By Organic (2020-2028) ($MN)
List of Figures
RESEARCH METHODOLOGY

We at ‘Stratistics’ opt for an extensive research approach which involves data mining, data validation, and data analysis. The various research sources include in-house repository, secondary research, competitor’s sources, social media research, client internal data, and primary research.
Our team of analysts prefers the most reliable and authenticated data sources in order to perform the comprehensive literature search. With access to most of the authenticated data bases our team highly considers the best mix of information through various sources to obtain extensive and accurate analysis.
Each report takes an average time of a month and a team of 4 industry analysts. The time may vary depending on the scope and data availability of the desired market report. The various parameters used in the market assessment are standardized in order to enhance the data accuracy.
Data Mining
The data is collected from several authenticated, reliable, paid and unpaid sources and is filtered depending on the scope & objective of the research. Our reports repository acts as an added advantage in this procedure. Data gathering from the raw material suppliers, distributors and the manufacturers is performed on a regular basis, this helps in the comprehensive understanding of the products value chain. Apart from the above mentioned sources the data is also collected from the industry consultants to ensure the objective of the study is in the right direction.
Market trends such as technological advancements, regulatory affairs, market dynamics (Drivers, Restraints, Opportunities and Challenges) are obtained from scientific journals, market related national & international associations and organizations.
Data Analysis
From the data that is collected depending on the scope & objective of the research the data is subjected for the analysis. The critical steps that we follow for the data analysis include:
- Product Lifecycle Analysis
- Competitor analysis
- Risk analysis
- Porters Analysis
- PESTEL Analysis
- SWOT Analysis
The data engineering is performed by the core industry experts considering both the Marketing Mix Modeling and the Demand Forecasting. The marketing mix modeling makes use of multiple-regression techniques to predict the optimal mix of marketing variables. Regression factor is based on a number of variables and how they relate to an outcome such as sales or profits.
Data Validation
The data validation is performed by the exhaustive primary research from the expert interviews. This includes telephonic interviews, focus groups, face to face interviews, and questionnaires to validate our research from all aspects. The industry experts we approach come from the leading firms, involved in the supply chain ranging from the suppliers, distributors to the manufacturers and consumers so as to ensure an unbiased analysis.
We are in touch with more than 15,000 industry experts with the right mix of consultants, CEO's, presidents, vice presidents, managers, experts from both supply side and demand side, executives and so on.
The data validation involves the primary research from the industry experts belonging to:
- Leading Companies
- Suppliers & Distributors
- Manufacturers
- Consumers
- Industry/Strategic Consultants
Apart from the data validation the primary research also helps in performing the fill gap research, i.e. providing solutions for the unmet needs of the research which helps in enhancing the reports quality.
For more details about research methodology, kindly write to us at info@strategymrc.com
Frequently Asked Questions
In case of any queries regarding this report, you can contact the customer service by filing the “Inquiry Before Buy” form available on the right hand side. You may also contact us through email: info@strategymrc.com or phone: +1-301-202-5929
Yes, the samples are available for all the published reports. You can request them by filling the “Request Sample” option available in this page.
Yes, you can request a sample with your specific requirements. All the customized samples will be provided as per the requirement with the real data masked.
All our reports are available in Digital PDF format. In case if you require them in any other formats, such as PPT, Excel etc you can submit a request through “Inquiry Before Buy” form available on the right hand side. You may also contact us through email: info@strategymrc.com or phone: +1-301-202-5929
We offer a free 15% customization with every purchase. This requirement can be fulfilled for both pre and post sale. You may send your customization requirements through email at info@strategymrc.com or call us on +1-301-202-5929.
We have 3 different licensing options available in electronic format.
- Single User Licence: Allows one person, typically the buyer, to have access to the ordered product. The ordered product cannot be distributed to anyone else.
- 2-5 User Licence: Allows the ordered product to be shared among a maximum of 5 people within your organisation.
- Corporate License: Allows the product to be shared among all employees of your organisation regardless of their geographical location.
All our reports are typically be emailed to you as an attachment.
To order any available report you need to register on our website. The payment can be made either through CCAvenue or PayPal payments gateways which accept all international cards.
We extend our support to 6 months post sale. A post sale customization is also provided to cover your unmet needs in the report.
Request Customization
We offer complimentary customization of up to 15% with every purchase. To share your customization requirements, feel free to email us at info@strategymrc.com or call us on +1-301-202-5929. .
Please Note: Customization within the 15% threshold is entirely free of charge. If your request exceeds this limit, we will conduct a feasibility assessment. Following that, a detailed quote and timeline will be provided.
WHY CHOOSE US ?

Assured Quality
Best in class reports with high standard of research integrity

24X7 Research Support
Continuous support to ensure the best customer experience.

Free Customization
Adding more values to your product of interest.

Safe & Secure Access
Providing a secured environment for all online transactions.

Trusted by 600+ Brands
Serving the most reputed brands across the world.