
Equipment And Tool Rental Platforms Market
Equipment & Tool Rental Platforms Market Forecasts to 2034 - Global Analysis By Equipment Type (Construction Equipment, Industrial Machinery, Agricultural Equipment, Material Handling Equipment, Other Equipment Types), Rental Model, Pricing Model, Customer Type, End User and By Geography

|
Years Covered |
2023-2034 |
|
Estimated Year Value (2026) |
US $138.50 BN |
|
Projected Year Value (2034) |
US $262.60 BN |
|
CAGR (2026-2034) |
7.3% |
|
Regions Covered |
North America, Europe, Asia Pacific, South America, and Rest of the World (RoW) |
|
Countries Covered |
United States, Canada, Mexico, United Kingdom, Germany, France, Italy, Spain, Netherlands, Belgium, Sweden, Switzerland, Poland, Rest of Europe, China, Japan, India, South Korea, Australia, Indonesia, Thailand, Malaysia, Singapore, Vietnam, Rest of Asia Pacific, Brazil, Argentina, Colombia, Chile, Peru, Rest of South America, Saudi Arabia, United Arab Emirates, Qatar, Israel, Rest of Middle East, South Africa, Egypt, Morocco, and Rest of Africa. |
|
Largest Market |
North America |
|
Highest Growing Market |
Asia Pacific |
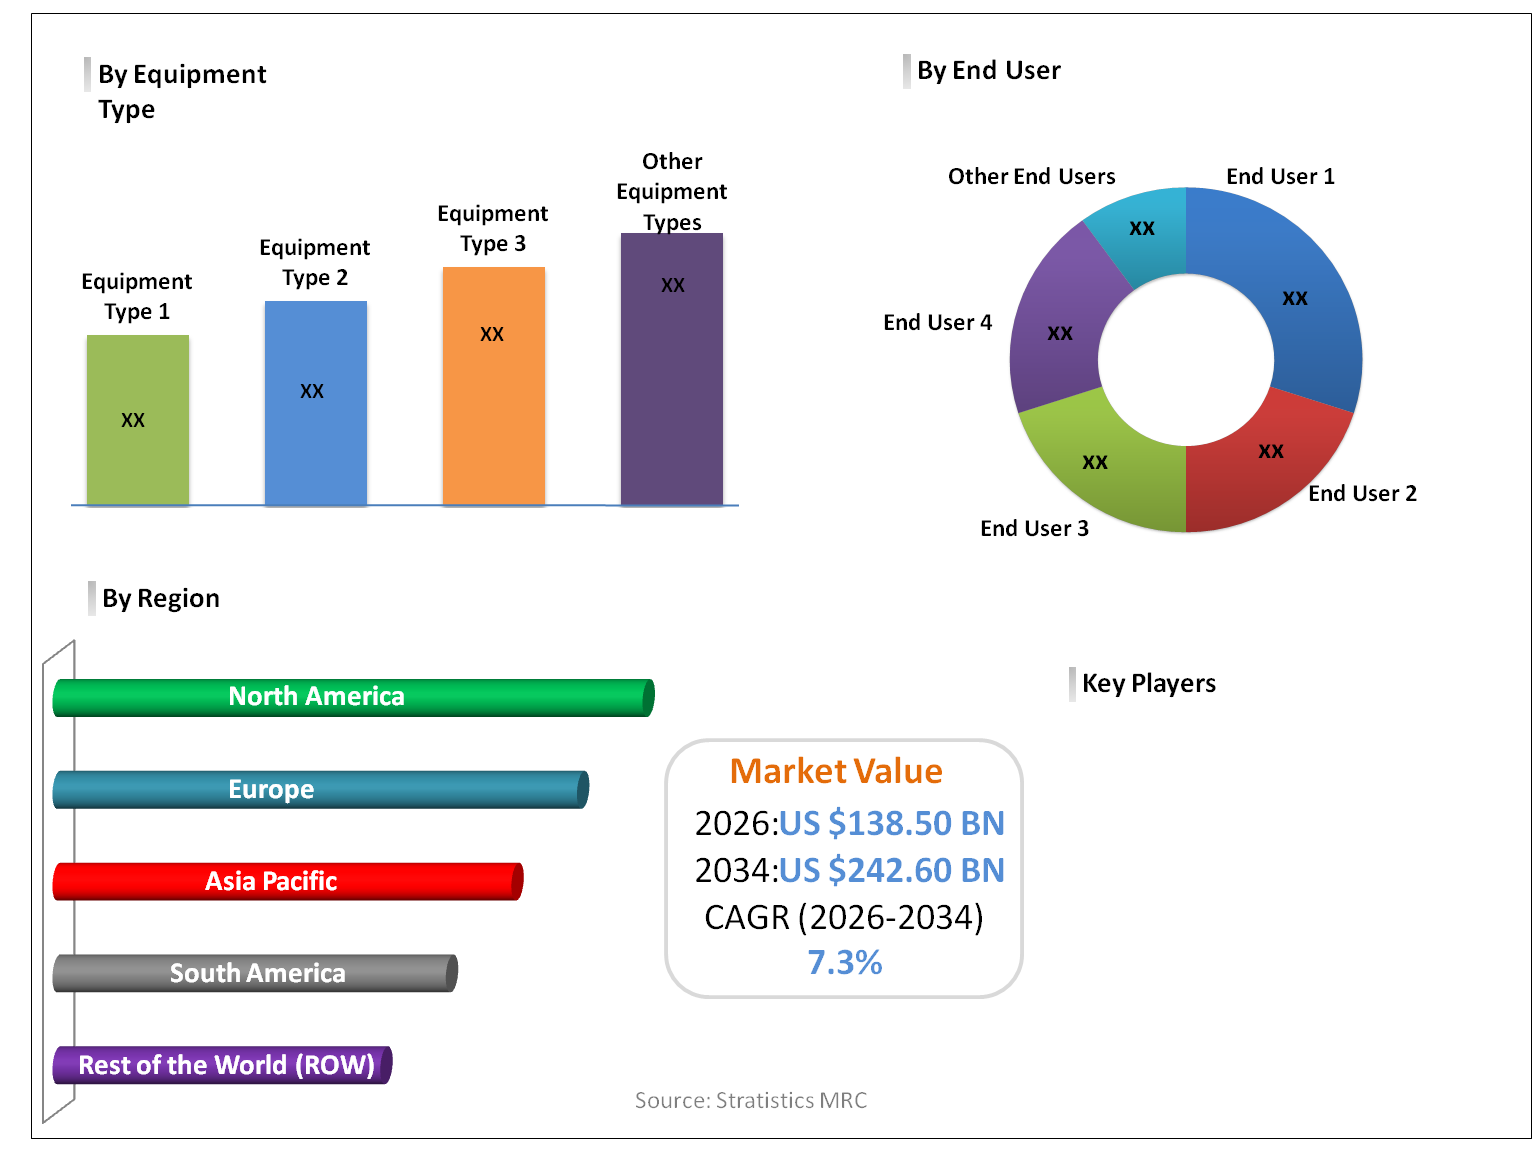
According to Stratistics MRC, the Global Equipment & Tool Rental Platforms Market is accounted for $138.50 billion in 2026 and is expected to reach $242.60 billion by 2034 growing at a CAGR of 7.3% during the forecast period. Equipment & Tool Rental Platforms are digital or physical service models that provide temporary access to machinery, tools, and equipment for construction, industrial, and consumer use. These platforms allow users to rent rather than purchase equipment, reducing capital expenditure and improving asset utilization. Services include booking, delivery, maintenance, and tracking. The model supports sustainability by maximizing product usage and reducing idle inventory. Growth is driven by increasing demand for flexible access, rising construction activities, and digital platform integration that enhances convenience, transparency, and operational efficiency.
Market Dynamics:
Driver:
Cost savings over equipment ownership
Rising demand for short‑term projects fosters reliance on rental solutions. Expanding awareness of operational efficiency accelerates uptake across construction and industrial sectors. Corporate investment in rental ecosystems propels development of advanced platforms. Strong marketing campaigns emphasize affordability and scalability, boosting visibility in enterprise ecosystems. Collectively, cost efficiency is propelling the market toward sustained growth.
Restraint:
Equipment maintenance and downtime risks
Frequent wear and tear increases operational costs for providers. Limited availability of well‑maintained equipment hampers credibility. Negative perceptions around downtime risks degrades consumer trust. Smaller rental firms struggle to manage maintenance schedules, limiting accessibility. Consequently, maintenance challenges continue to constrain market penetration despite strong demand drivers.
Opportunity:
Digital platforms for on-demand rentals
Advances in mobile apps accelerate real‑time booking and tracking. Strategic collaborations between rental firms and tech startups propel commercialization. Expanding investment in IoT fosters breakthroughs in predictive maintenance. Rising institutional preference for digital convenience accelerates uptake of online rental platforms. Strong marketing campaigns propel awareness of on‑demand benefits. Overall, digital platforms are propelling new revenue streams and strengthening market competitiveness.
Threat:
Theft and damage of rented equipment
Concerns over asset security constrain willingness to rent high‑value machinery. Ambiguity around liability frameworks hampers credibility. Negative publicity around theft incidents degrades consumer confidence. Cultural resistance to shared equipment hampers uptake in conservative markets. Consequently, theft and damage risks continue to limit scalability despite strong innovation drivers.
Covid-19 Impact:
The Covid‑19 pandemic accelerated demand for flexible rental solutions, fostering adoption across construction and industrial sectors. Rising awareness of cost efficiency propelled reliance on short‑term rentals. Lockdowns constrained capital investments, boosting short‑term demand for rental platforms. Supply chain disruptions slowed availability of new equipment, indirectly fueling rental adoption. Recovery phases fostered renewed investment in digital rental innovation, accelerating adoption post‑pandemic. Expanding online ecosystems accelerated visibility of rental platforms. Overall, Covid‑19 acted as both a short‑term constraint and a long‑term catalyst for rental market growth.
The construction equipment segment is expected to be the largest during the forecast period
The construction equipment segment is expected to account for the largest market share during the forecast period as cost savings over ownership accelerate reliance on rental solutions for heavy machinery. Rising demand for short‑term construction projects fosters consistent adoption. Strong infrastructure investments accelerate visibility of rental equipment. Expanding investment in smart construction fosters breakthroughs in rental demand. Strategic collaborations between rental firms and contractors propel commercialization. Collectively, construction equipment is propelling dominance in the overall market.
The infrastructure development segment is expected to have the highest CAGR during the forecast period
Over the forecast period, the infrastructure development segment is predicted to witness the highest growth rate due to cost savings over ownership accelerating adoption of rental platforms in large‑scale projects. Rising prevalence of government‑funded infrastructure fosters uptake of rental solutions. Expanding investment in smart cities accelerates innovation in rental demand. Strategic partnerships between rental firms and public agencies propel commercialization. Growing awareness of efficiency benefits fosters reliance on rental platforms for infrastructure projects. Strong marketing campaigns accelerate visibility of rental solutions.
Region with largest share:
During the forecast period, the North America region is expected to hold the largest market share owing to cost savings over ownership boosting adoption across the United States and Canada. Strong construction and industrial infrastructure fosters visibility of rental platforms. Established rental companies accelerate commercialization of advanced solutions. Rising consumer preference for flexible access fosters consistent demand. Strategic collaborations between startups and contractors propel innovation. Expanding digital ecosystems accelerate accessibility of rental equipment.
Region with highest CAGR:
Over the forecast period, the Asia Pacific region is anticipated to exhibit the highest CAGR as cost savings over ownership accelerates adoption across China, India, Japan, and Southeast Asia. Rapid urbanization fosters rising demand for construction and infrastructure rentals. Government initiatives propel investment in smart city projects and industrial expansion. Rising middle‑class incomes accelerate willingness to pay for flexible rental solutions. Expanding digital marketplaces foster visibility of rental platforms. Strong marketing campaigns accelerate awareness of rental benefits.

Key players in the market
Some of the key players in Equipment & Tool Rental Platforms Market include United Rentals, Inc., Ashtead Group plc, Herc Holdings Inc., Loxam Group, Kiloutou Group, Boels Rental, Sunbelt Rentals, H&E Equipment Services, Inc., Kanamoto Co., Ltd., Nishio Rent All Co., Ltd., Aktio Corporation, Speedy Hire Plc, Ramirent Group, Home Depot, Inc. and Cramo Plc.
Key Developments:
In March 2024, Boels Rental announced the acquisition of Riwal, a specialist in aerial work platforms (AWP). This acquisition significantly expanded Boels’ fleet, expertise, and market presence, reinforcing its ambition to become Europe’s leading rental partner of choice and strengthening its position in both existing and new territories.
In February 2023, United Rentals completed the acquisition of Able Equipment Rental, Inc., a provider of aerial equipment, trucks, and contractor tools. This acquisition expanded United Rentals’ footprint in the Northeastern U.S., strengthening its specialty rental offerings and customer reach.
Equipment Types Covered:
• Construction Equipment
• Industrial Machinery
• Agricultural Equipment
• Material Handling Equipment
• Other Equipment Types
Rental Models Covered:
• Short-Term Rental
• Long-Term Rental
• On-Demand Rental
• Subscription-Based Rental
• Lease-to-Rent Models
• Other Rental Models
Pricing Models Covered:
• Hourly Rental
• Daily Rental
• Weekly Rental
• Monthly Rental
• Usage-Based Pricing
Customer Types Covered:
• Individual Users
• Small and Medium Enterprises
• Large Enterprises
End Users Covered:
• Construction
• Manufacturing
• Agriculture
• Mining
• Oil & Gas
• Infrastructure Development
• Other End Users
Regions Covered:
• North America
o United States
o Canada
o Mexico
• Europe
o United Kingdom
o Germany
o France
o Italy
o Spain
o Netherlands
o Belgium
o Sweden
o Switzerland
o Poland
o Rest of Europe
• Asia Pacific
o China
o Japan
o India
o South Korea
o Australia
o Indonesia
o Thailand
o Malaysia
o Singapore
o Vietnam
o Rest of Asia Pacific
• South America
o Brazil
o Argentina
o Colombia
o Chile
o Peru
o Rest of South America
• Rest of the World (RoW)
o Middle East
§ Saudi Arabia
§ United Arab Emirates
§ Qatar
§ Israel
§ Rest of Middle East
o Africa
§ South Africa
§ Egypt
§ Morocco
§ Rest of Africa
What our report offers:
- Market share assessments for the regional and country-level segments
- Strategic recommendations for the new entrants
- Covers Market data for the years 2023, 2024, 2025, 2026, 2027, 2028, 2030, 2032 and 2034
- Market Trends (Drivers, Constraints, Opportunities, Threats, Challenges, Investment Opportunities, and recommendations)
- Strategic recommendations in key business segments based on the market estimations
- Competitive landscaping mapping the key common trends
- Company profiling with detailed strategies, financials, and recent developments
- Supply chain trends mapping the latest technological advancements
Free Customization Offerings:
All the customers of this report will be entitled to receive one of the following free customization options:
• Company Profiling
o Comprehensive profiling of additional market players (up to 3)
o SWOT Analysis of key players (up to 3)
• Regional Segmentation
o Market estimations, Forecasts and CAGR of any prominent country as per the client's interest (Note: Depends on feasibility check)
• Competitive Benchmarking
o Benchmarking of key players based on product portfolio, geographical presence, and strategic alliances
Table of Contents
1 Executive Summary
1.1 Market Snapshot and Key Highlights
1.2 Growth Drivers, Challenges, and Opportunities
1.3 Competitive Landscape Overview
1.4 Strategic Insights and Recommendations
2 Research Framework
2.1 Study Objectives and Scope
2.2 Stakeholder Analysis
2.3 Research Assumptions and Limitations
2.4 Research Methodology
2.4.1 Data Collection (Primary and Secondary)
2.4.2 Data Modeling and Estimation Techniques
2.4.3 Data Validation and Triangulation
2.4.4 Analytical and Forecasting Approach
3 Market Dynamics and Trend Analysis
3.1 Market Definition and Structure
3.2 Key Market Drivers
3.3 Market Restraints and Challenges
3.4 Growth Opportunities and Investment Hotspots
3.5 Industry Threats and Risk Assessment
3.6 Technology and Innovation Landscape
3.7 Emerging and High-Growth Markets
3.8 Regulatory and Policy Environment
3.9 Impact of COVID-19 and Recovery Outlook
4 Competitive and Strategic Assessment
4.1 Porter's Five Forces Analysis
4.1.1 Supplier Bargaining Power
4.1.2 Buyer Bargaining Power
4.1.3 Threat of Substitutes
4.1.4 Threat of New Entrants
4.1.5 Competitive Rivalry
4.2 Market Share Analysis of Key Players
4.3 Product Benchmarking and Performance Comparison
5 Global Equipment & Tool Rental Platforms Market, By Equipment Type
5.1 Construction Equipment
5.2 Industrial Machinery
5.3 Agricultural Equipment
5.4 Material Handling Equipment
5.5 Other Equipment Types
6 Global Equipment & Tool Rental Platforms Market, By Rental Model
6.1 Short-Term Rental
6.2 Long-Term Rental
6.3 On-Demand Rental
6.4 Subscription-Based Rental
6.5 Lease-to-Rent Models
6.6 Other Rental Models
7 Global Equipment & Tool Rental Platforms Market, By Pricing Model
7.1 Hourly Rental
7.2 Daily Rental
7.3 Weekly Rental
7.4 Monthly Rental
7.5 Usage-Based Pricing
8 Global Equipment & Tool Rental Platforms Market, By Customer Type
8.1 Individual Users
8.2 Small and Medium Enterprises
8.3 Large Enterprises
9 Global Equipment & Tool Rental Platforms Market, By End User
9.1 Construction
9.2 Manufacturing
9.3 Agriculture
9.4 Mining
9.5 Oil & Gas
9.6 Infrastructure Development
9.7 Other End Users
10 Global Equipment & Tool Rental Platforms Market, By Geography
10.1 North America
10.1.1 United States
10.1.2 Canada
10.1.3 Mexico
10.2 Europe
10.2.1 United Kingdom
10.2.2 Germany
10.2.3 France
10.2.4 Italy
10.2.5 Spain
10.2.6 Netherlands
10.2.7 Belgium
10.2.8 Sweden
10.2.9 Switzerland
10.2.10 Poland
10.2.11 Rest of Europe
10.3 Asia Pacific
10.3.1 China
10.3.2 Japan
10.3.3 India
10.3.4 South Korea
10.3.5 Australia
10.3.6 Indonesia
10.3.7 Thailand
10.3.8 Malaysia
10.3.9 Singapore
10.3.10 Vietnam
10.3.11 Rest of Asia Pacific
10.4 South America
10.4.1 Brazil
10.4.2 Argentina
10.4.3 Colombia
10.4.4 Chile
10.4.5 Peru
10.4.6 Rest of South America
10.5 Rest of the World (RoW)
10.5.1 Middle East
10.5.1.1 Saudi Arabia
10.5.1.2 United Arab Emirates
10.5.1.3 Qatar
10.5.1.4 Israel
10.5.1.5 Rest of Middle East
10.5.2 Africa
10.5.2.1 South Africa
10.5.2.2 Egypt
10.5.2.3 Morocco
10.5.2.4 Rest of Africa
11 Strategic Market Intelligence
11.1 Industry Value Network and Supply Chain Assessment
11.2 White-Space and Opportunity Mapping
11.3 Product Evolution and Market Life Cycle Analysis
11.4 Channel, Distributor, and Go-to-Market Assessment
12 Industry Developments and Strategic Initiatives
12.1 Mergers and Acquisitions
12.2 Partnerships, Alliances, and Joint Ventures
12.3 New Product Launches and Certifications
12.4 Capacity Expansion and Investments
12.5 Other Strategic Initiatives
13 Company Profiles
13.1 United Rentals, Inc.
13.2 Ashtead Group plc
13.3 Herc Holdings Inc.
13.4 Loxam Group
13.5 Kiloutou Group
13.6 Boels Rental
13.7 Sunbelt Rentals
13.8 H&E Equipment Services, Inc.
13.9 Kanamoto Co., Ltd.
13.10 Nishio Rent All Co., Ltd.
13.11 Aktio Corporation
13.12 Speedy Hire Plc
13.13 Ramirent Group
13.14 Home Depot, Inc.
13.15 Cramo Plc
List of Tables
1 Global Equipment & Tool Rental Platforms Market Outlook, By Region (2023-2034) ($MN)
2 Global Equipment & Tool Rental Platforms Market, By Equipment Type (2023–2034) ($MN)
3 Global Equipment & Tool Rental Platforms Market, By Construction Equipment (2023–2034) ($MN)
4 Global Equipment & Tool Rental Platforms Market, By Industrial Machinery (2023–2034) ($MN)
5 Global Equipment & Tool Rental Platforms Market, By Agricultural Equipment (2023–2034) ($MN)
6 Global Equipment & Tool Rental Platforms Market, By Material Handling Equipment (2023–2034) ($MN)
7 Global Equipment & Tool Rental Platforms Market, By Other Equipment Types (2023–2034) ($MN)
8 Global Equipment & Tool Rental Platforms Market, By Rental Model (2023–2034) ($MN)
9 Global Equipment & Tool Rental Platforms Market, By Short-Term Rental (2023–2034) ($MN)
10 Global Equipment & Tool Rental Platforms Market, By Long-Term Rental (2023–2034) ($MN)
11 Global Equipment & Tool Rental Platforms Market, By On-Demand Rental (2023–2034) ($MN)
12 Global Equipment & Tool Rental Platforms Market, By Subscription-Based Rental (2023–2034) ($MN)
13 Global Equipment & Tool Rental Platforms Market, By Lease-to-Rent Models (2023–2034) ($MN)
14 Global Equipment & Tool Rental Platforms Market, By Other Rental Models (2023–2034) ($MN)
15 Global Equipment & Tool Rental Platforms Market, By Pricing Model (2023–2034) ($MN)
16 Global Equipment & Tool Rental Platforms Market, By Hourly Rental (2023–2034) ($MN)
17 Global Equipment & Tool Rental Platforms Market, By Daily Rental (2023–2034) ($MN)
18 Global Equipment & Tool Rental Platforms Market, By Weekly Rental (2023–2034) ($MN)
19 Global Equipment & Tool Rental Platforms Market, By Monthly Rental (2023–2034) ($MN)
20 Global Equipment & Tool Rental Platforms Market, By Usage-Based Pricing (2023–2034) ($MN)
21 Global Equipment & Tool Rental Platforms Market, By Customer Type (2023–2034) ($MN)
22 Global Equipment & Tool Rental Platforms Market, By Individual Users (2023–2034) ($MN)
23 Global Equipment & Tool Rental Platforms Market, By Small and Medium Enterprises (2023–2034) ($MN)
24 Global Equipment & Tool Rental Platforms Market, By Large Enterprises (2023–2034) ($MN)
25 Global Equipment & Tool Rental Platforms Market, By End User (2023–2034) ($MN)
26 Global Equipment & Tool Rental Platforms Market, By Construction (2023–2034) ($MN)
27 Global Equipment & Tool Rental Platforms Market, By Manufacturing (2023–2034) ($MN)
28 Global Equipment & Tool Rental Platforms Market, By Agriculture (2023–2034) ($MN)
29 Global Equipment & Tool Rental Platforms Market, By Mining (2023–2034) ($MN)
30 Global Equipment & Tool Rental Platforms Market, By Oil & Gas (2023–2034) ($MN)
31 Global Equipment & Tool Rental Platforms Market, By Infrastructure Development (2023–2034) ($MN)
32 Global Equipment & Tool Rental Platforms Market, By Other End Users (2023–2034) ($MN)
Note: Tables for North America, Europe, APAC, South America, and Rest of the World (RoW) are also represented in the same manner as above.
List of Figures
RESEARCH METHODOLOGY

We at ‘Stratistics’ opt for an extensive research approach which involves data mining, data validation, and data analysis. The various research sources include in-house repository, secondary research, competitor’s sources, social media research, client internal data, and primary research.
Our team of analysts prefers the most reliable and authenticated data sources in order to perform the comprehensive literature search. With access to most of the authenticated data bases our team highly considers the best mix of information through various sources to obtain extensive and accurate analysis.
Each report takes an average time of a month and a team of 4 industry analysts. The time may vary depending on the scope and data availability of the desired market report. The various parameters used in the market assessment are standardized in order to enhance the data accuracy.
Data Mining
The data is collected from several authenticated, reliable, paid and unpaid sources and is filtered depending on the scope & objective of the research. Our reports repository acts as an added advantage in this procedure. Data gathering from the raw material suppliers, distributors and the manufacturers is performed on a regular basis, this helps in the comprehensive understanding of the products value chain. Apart from the above mentioned sources the data is also collected from the industry consultants to ensure the objective of the study is in the right direction.
Market trends such as technological advancements, regulatory affairs, market dynamics (Drivers, Restraints, Opportunities and Challenges) are obtained from scientific journals, market related national & international associations and organizations.
Data Analysis
From the data that is collected depending on the scope & objective of the research the data is subjected for the analysis. The critical steps that we follow for the data analysis include:
- Product Lifecycle Analysis
- Competitor analysis
- Risk analysis
- Porters Analysis
- PESTEL Analysis
- SWOT Analysis
The data engineering is performed by the core industry experts considering both the Marketing Mix Modeling and the Demand Forecasting. The marketing mix modeling makes use of multiple-regression techniques to predict the optimal mix of marketing variables. Regression factor is based on a number of variables and how they relate to an outcome such as sales or profits.
Data Validation
The data validation is performed by the exhaustive primary research from the expert interviews. This includes telephonic interviews, focus groups, face to face interviews, and questionnaires to validate our research from all aspects. The industry experts we approach come from the leading firms, involved in the supply chain ranging from the suppliers, distributors to the manufacturers and consumers so as to ensure an unbiased analysis.
We are in touch with more than 15,000 industry experts with the right mix of consultants, CEO's, presidents, vice presidents, managers, experts from both supply side and demand side, executives and so on.
The data validation involves the primary research from the industry experts belonging to:
- Leading Companies
- Suppliers & Distributors
- Manufacturers
- Consumers
- Industry/Strategic Consultants
Apart from the data validation the primary research also helps in performing the fill gap research, i.e. providing solutions for the unmet needs of the research which helps in enhancing the reports quality.
For more details about research methodology, kindly write to us at info@strategymrc.com
Frequently Asked Questions
In case of any queries regarding this report, you can contact the customer service by filing the “Inquiry Before Buy” form available on the right hand side. You may also contact us through email: info@strategymrc.com or phone: +1-301-202-5929
Yes, the samples are available for all the published reports. You can request them by filling the “Request Sample” option available in this page.
Yes, you can request a sample with your specific requirements. All the customized samples will be provided as per the requirement with the real data masked.
All our reports are available in Digital PDF format. In case if you require them in any other formats, such as PPT, Excel etc you can submit a request through “Inquiry Before Buy” form available on the right hand side. You may also contact us through email: info@strategymrc.com or phone: +1-301-202-5929
We offer a free 15% customization with every purchase. This requirement can be fulfilled for both pre and post sale. You may send your customization requirements through email at info@strategymrc.com or call us on +1-301-202-5929.
We have 3 different licensing options available in electronic format.
- Single User Licence: Allows one person, typically the buyer, to have access to the ordered product. The ordered product cannot be distributed to anyone else.
- 2-5 User Licence: Allows the ordered product to be shared among a maximum of 5 people within your organisation.
- Corporate License: Allows the product to be shared among all employees of your organisation regardless of their geographical location.
All our reports are typically be emailed to you as an attachment.
To order any available report you need to register on our website. The payment can be made either through CCAvenue or PayPal payments gateways which accept all international cards.
We extend our support to 6 months post sale. A post sale customization is also provided to cover your unmet needs in the report.
Request Customization
We offer complimentary customization of up to 15% with every purchase. To share your customization requirements, feel free to email us at info@strategymrc.com or call us on +1-301-202-5929. .
Please Note: Customization within the 15% threshold is entirely free of charge. If your request exceeds this limit, we will conduct a feasibility assessment. Following that, a detailed quote and timeline will be provided.
WHY CHOOSE US ?

Assured Quality
Best in class reports with high standard of research integrity

24X7 Research Support
Continuous support to ensure the best customer experience.

Free Customization
Adding more values to your product of interest.

Safe & Secure Access
Providing a secured environment for all online transactions.

Trusted by 600+ Brands
Serving the most reputed brands across the world.