
Failure Analysis Market
Failure Analysis Market Forecasts to 2028 - Global Analysis By Equipment (Scanning Electron Microscope (SEM), Dual-Beam Systems), Testing (Physical Testing, Metallurgical Testin) and By Geography

|
Years Covered |
2020-2028 |
|
Estimated Year Value (2022) |
US $4.74 BN |
|
Projected Year Value (2028) |
US $8.54 BN |
|
CAGR (2022 - 2028) |
10.3% |
|
Regions Covered |
North America, Europe, Asia Pacific, South America, and Middle East & Africa |
|
Countries Covered |
US, Canada, Mexico, Germany, UK, Italy, France, Spain, Japan, China, India, Australia, New Zealand, South Korea, Rest of Asia Pacific, South America, Argentina, Brazil, Chile, Middle East & Africa, Saudi Arabia, UAE, Qatar, and South Africa |
|
Largest Market |
North America |
|
Highest Growing Market |
Asia Pacific |
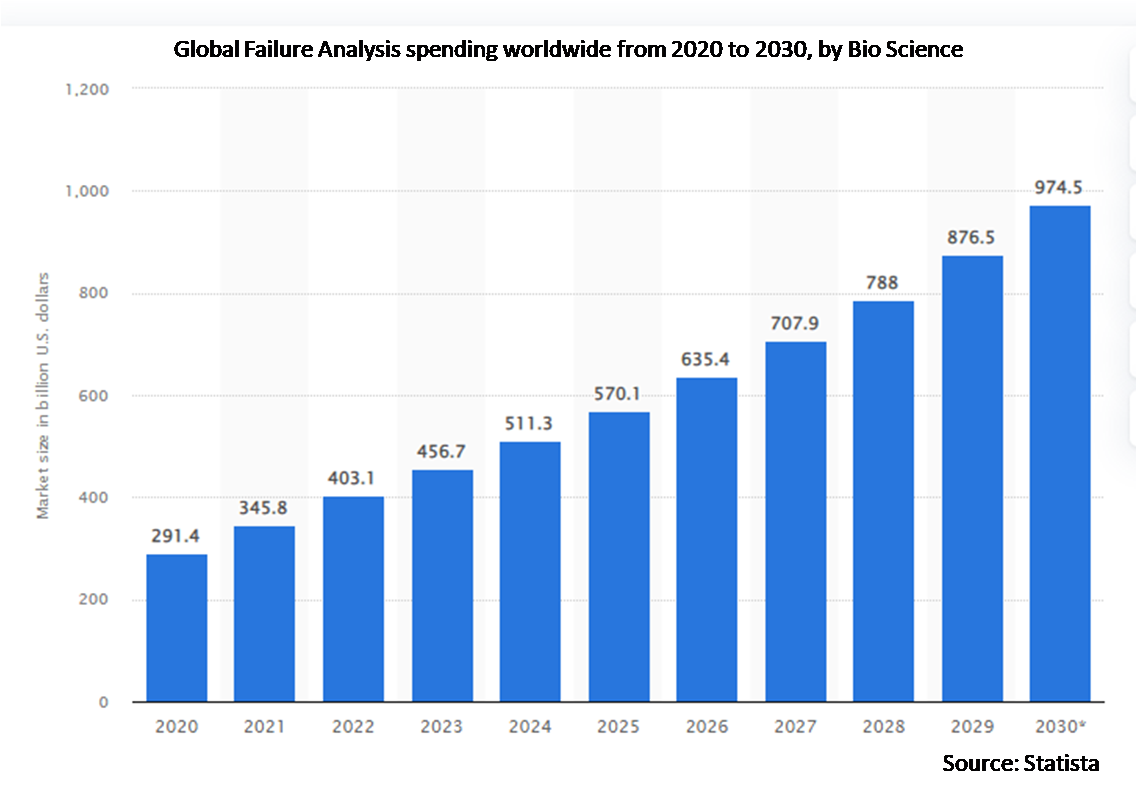
According to Stratistics MRC, the Global Failure Analysis Market is accounted for $4.74 billion in 2022 and is expected to reach $8.54 billion by 2028 growing at a CAGR of 10.3% during the forecast period. Failure analysis is a process in which the origin cause for the failure is recognized and the correction in the product is done. It is widely used in sectors such as material science, bioscience and other sectors. These processes mainly deal with the failures in structures, assemblies and components. The recognition of failure is a multilevel process which includes the physical investigation of the product. This process is done by the experts in those fields who can recognize the problem and who can make essential changes in the products.
According to Statistics Canada 2021, Canada invested CAD 81.6 billion in infrastructure assets in 2020, continuing the trend of investment made in the previous four years. These investments are crucial to address the country’s infrastructure gap, the estimate of which ranges from CAD 150 billion to CAD 1 trillion.
Market Dynamics:
Driver:
High growth of nanotechnology
Nanotechnology is an emerging technology in the market with different applications. It has been commercialized in various industries, owing to constant support provided by both public and private sectors across the globe. As a matter of fact, it has a massive potential to greatly enhance existing products and allows significant future opportunities. Furthermore, North America, Germany, France and the UK among others have also funded heavily in nanotechnology, which shows the importance a`nd rapid growth of the technology across the globe. Nanotechnology is an emerging field of research and has been growing during the last decade. Therefore, these factors are expected to drive growth of the global failure analysis equipment market during the forecast period.
Restraint:
High cost
Most industries lack the installation cost. The lack of funds to invest in a failure analysis system can affect the demand. It is an expensive technology that requires separate expenditures. Maintenance and service costs can add more expense to any organization. Hence it acts as one of the restraining factors for market growth.
Opportunity:
Technological advancements
The labour-intensive failure analysis by professionals is less effective than the technology. It can detect any failure in the product before the manufacturing process. These advanced features in the technology can save costs and time for any industry. Identifying the final products after manufacturing can lead to plenty of revenue losses to any firm. However, the exceptional features of the failure analysis technology to detect errors in products can save plenty of costs. Further, there is expected to be innovations and variation in the failure analysis market. With new variations, the demand from the end-users will rise for the market.
Threat:
Lack of skilled personnel
Operating and managing failure analysis equipment needs skilled personnel. These individuals are required to possess adequate training and knowledge regarding the equipment. Although such skilled professionals are available in developed countries. Hence, these factors threaten the growth of the market during the forecast period.
Covid 19 is changing the dynamics of many global markets. The outbreak of the virus is affecting the growth of industries. Global Failure Analysis Market is facing a few challenges in this period. There are direct as well as indirect effects of pandemic on the failure analysis market. The direct impacts on the market are supply chain disruptions and a slowdown in production. The economic crisis is affecting the market indirectly. Also, the less demand from the end-users is affecting the market growth. Failure analysis is a complex technology that requires experts. Due to the less number of professionals to operate and analyse system the work is slowing down. The market will have more demand in the upcoming years.
The Focused Ion Beam (FIB) Systems segment is expected to be the largest during the forecast period
The Focused Ion Beam (FIB) Systems segment is expected to be the largest during the forecast period the fastest growth of this segment can be attributed to the increasing adoption of FIB systems in material science and bioscience applications. The development of commercially focused FIBs has led to their increased applications in the field of material sciences. In addition to circuit editing and Transmission Electron Microscopy (TEM) sample preparation, FIBs can now be used for microstructural analysis and prototyping nanomachining.
The semiconductor segment is expected to have the highest CAGR during the forecast period
The semiconductor segment is expected to have the highest CAGR during the forecast period. The growing demand for miniature transistor chips, nanoelectronics, quantum dots, and optoelectronics is driving the market for failure analysis in the semiconductor industry. The electronics & semiconductor industry is one of the growing sectors globally, owing to the increased adoption of robotics and automation to produce electronics devices. The electronics & semiconductor industry requires high density, integrated, and miniaturized devices.
Region with highest share:
North America is projected to hold the largest market share during the forecast period North America is an early adopter of failure analysis techniques. The acceptance is higher to establish smooth manufacture and product delivery. There are prominent industries located in North America. The top-end users invest more in technology to provide the best quality products for customers.US is the key contributor to the Market. Both the automobile and energy industry has a high demand for the failure analysis process. Due to these factors, North America will sustain its top place in the global market.
Region with highest CAGR:
Asia Pacific is projected to have the highest CAGR over the forecast period the growth is attributed to the high concentration of semiconductor industries in countries such as Taiwan, China, Japan, South Korea and India. This order is expected to continue due to monumental growth in semiconductor technology and increasing investment in education and research infrastructure in this province.

Key players in the market
Some of the key players profiled in the Failure Analysis Market include FEI Company, Hitachi High, Technologies Corporation, Jeol Ltd., CARL Zeiss SMT GmbH, Intertek Group PLC, Thermo Fisher Scientific Inc, Motion X Corporation, Tescan Orsay Holding, A.S., EAG (Evans Analytical Group) Inc. , A&D Company Ltd., Raytheon Company (U.S.), Meyer Burger Technology, Canon Anelva Corporation, Veeco Instruments Inc., Bruker Corporation, Plasma-Therm, Scia Systems GmbH, EDAX, Inc., Innovative Circuits Engineering, Inc. and IXRF Systems, Inc.
Key Developments:
In September 2019: Thermo Fisher Scientific launched the Thermo Scientific Phenom ParticleX, a versatile and intuitive desktop Scanning Electron Microscope (SEM) solution that is designed to provide automotive suppliers and additive manufacturing companies faster quality control analyses of materials used in development and production.
In January 2020: JEOL Ltd. acquired all shares of INTEGRATED DYNAMIC ELECTRON SOLUTIONS, INC. (US), an entrepreneurial venture specialized in technologies related to transmission electron microscopy.
In December 2019: Hitachi High-Technologies Corporation developed a new advanced CD Measurement SEM (CD-SEM*1), CG7300. The CG7300 provides enhanced high-precision measurement and improved throughput performance.
Equipment’s Covered:
• Scanning Electron Microscope (SEM)
• Dual–Beam Systems
• Focused ION Beam System (FIB)
• Transmission Electron Microscope (TEM)
Technologies Covered:
• Broad ION Milling (BIM)
• Reactive ION Etching (RIE)
• Secondary ION Mass Spectroscopy (SIMS)
• Secondary ION Mass Spectroscopy (SIMS)
• Energy Dispersive X-Ray Spectroscopy (EDX)
• Focused ION Beam (FIB)
• Materials Technology
• Physical Technology
• Non-Destructive Technology (NDT)
Applications Covered:
• Bio Science
• Material Science
• Industrial Science
Regions Covered:
• North America
o US
o Canada
o Mexico
• Europe
o Germany
o UK
o Italy
o France
o Spain
o Rest of Europe
• Asia Pacific
o Japan
o China
o India
o Australia
o New Zealand
o South Korea
o Rest of Asia Pacific
• South America
o Argentina
o Brazil
o Chile
o Rest of South America
• Middle East & Africa
o Saudi Arabia
o UAE
o Qatar
o South Africa
o Rest of Middle East & Africa
What our report offers:
- Market share assessments for the regional and country-level segments
- Strategic recommendations for the new entrants
- Covers Market data for the years 2020, 2021, 2022, 2025 and 2028
- Market Trends (Drivers, Constraints, Opportunities, Threats, Challenges, Investment Opportunities, and recommendations)
- Strategic recommendations in key business segments based on the market estimations
- Competitive landscaping mapping the key common trends
- Company profiling with detailed strategies, financials, and recent developments
- Supply chain trends mapping the latest technological advancements
Free Customization Offerings:
All the customers of this report will be entitled to receive one of the following free customization options:
• Company Profiling
o Comprehensive profiling of additional market players (up to 3)
o SWOT Analysis of key players (up to 3)
• Regional Segmentation
o Market estimations, Forecasts and CAGR of any prominent country as per the client's interest (Note: Depends on feasibility check)
• Competitive Benchmarking
o Benchmarking of key players based on product portfolio, geographical presence, and strategic alliances
Table of Contents
1 Executive Summary
2 Preface
2.1 Abstract
2.2 Stake Holders
2.3 Research Scope
2.4 Research Methodology
2.4.1 Data Mining
2.4.2 Data Analysis
2.4.3 Data Validation
2.4.4 Research Approach
2.5 Research Sources
2.5.1 Primary Research Sources
2.5.2 Secondary Research Sources
2.5.3 Assumptions
3 Market Trend Analysis
3.1 Introduction
3.2 Drivers
3.3 Restraints
3.4 Opportunities
3.5 Threats
3.6 Technology Analysis
3.7 Application Analysis
3.8 Emerging Markets
3.9 Impact of Covid-19
4 Porters Five Force Analysis
4.1 Bargaining power of suppliers
4.2 Bargaining power of buyers
4.3 Threat of substitutes
4.4 Threat of new entrants
4.5 Competitive rivalry
5 Global Failure Analysis Market, By Equipment
5.1 Introduction
5.2 Scanning Electron Microscope (SEM)
5.3 Dual–Beam Systems
5.4 Focused ION Beam System (FIB)
5.5 Transmission Electron Microscope (TEM)
6 Global Failure Analysis Market, By Testing
6.1 Introduction
6.2 Physical Testing
6.3 Metallurgical Testing
6.4 Non-destructive Testing (NDT)
6.5 Materials Testing
6.6 Electronic Component Failure Analysis
6.7 Mechanical Testing
6.8 Chemical Testing
7 Global Failure Analysis Market, By Technology
7.1 Introduction
7.2 Broad ION Milling (BIM)
7.3 Reactive ION Etching (RIE)
7.4 Secondary ION Mass Spectroscopy (SIMS)
7.5 Energy Dispersive X-Ray Spectroscopy (EDX)
7.6 Focused ION Beam (FIB)
7.7 Materials Technology
7.8 Physics of Failure Analysis
7.9 Non-Destructive Technology (NDT)
7.1 Fault Tree Analysis(FTA)
7.11 Functional Failure Analysis
7.12 Destructive Physical Analysis
7.13 Sneak Circuit Analysis
7.14 Software Failure Analysis
7.15 Common-Mode Failure Analysis
7.16 Failure Modes Effect Analysis (FMEA)
7.17 Failure Modes, Effects, and Criticality Analysis (FMECA)
7.18 Other Technologies
8 Global Failure Analysis Market, By Application
8.1 Introduction
8.2 Bio Science
8.2.1 Neuroscience
8.2.2 Cellular Biology
8.2.3 Biomedical Engineering
8.2.4 Structural Biology
8.3 Material Science
8.3.1 Paper & Fiber Material
8.3.2 Polymer
8.3.3 Nanofabrication
8.3.4 Ceramic & Glass
8.3.5 Metals & Metallurgy
8.3.6 MEMS and Thin Film Production
8.3.7 Semiconductor Manufacturing
8.4 Industrial Science
8.4.1 Power Generation & Energy
8.4.2 Chemical
8.4.3 Automotive & Aerospace
8.4.4 Oil & Gas
8.4.5 Renewable Energy
8.4.6 Mining
8.4.7 Machinery & Tools
8.4.8 Other Industrial Science
9 Global Failure Analysis Market, By Geography
9.1 Introduction
9.2 North America
9.2.1 US
9.2.2 Canada
9.2.3 Mexico
9.3 Europe
9.3.1 Germany
9.3.2 UK
9.3.3 Italy
9.3.4 France
9.3.5 Spain
9.3.6 Rest of Europe
9.4 Asia Pacific
9.4.1 Japan
9.4.2 China
9.4.3 India
9.4.4 Australia
9.4.5 New Zealand
9.4.6 South Korea
9.4.7 Rest of Asia Pacific
9.5 South America
9.5.1 Argentina
9.5.2 Brazil
9.5.3 Chile
9.5.4 Rest of South America
9.6 Middle East & Africa
9.6.1 Saudi Arabia
9.6.2 UAE
9.6.3 Qatar
9.6.4 South Africa
9.6.5 Rest of Middle East & Africa
10 Key Developments
10.1 Agreements, Partnerships, Collaborations and Joint Ventures
10.2 Acquisitions & Mergers
10.3 New Product Launch
10.4 Expansions
10.5 Other Key Strategies
11 Company Profiling
11.1 FEI Company
11.2 Hitachi High-Technologies Corporation
11.3 Jeol Ltd.
11.4 CARL Zeiss SMT GmbH
11.5 Intertek Group PLC
11.6 Thermo Fisher Scientific Inc
11.7 Motion X Corporation
11.8 Tescan Orsay Holding, A.S.
11.9 EAG (Evans Analytical Group) Inc.
11.1 A&D Company Ltd.
11.11 Raytheon Company (U.S.)
11.12 Meyer Burger Technology
11.13 Canon Anelva Corporation
11.14 Veeco Instruments Inc.
11.15 Bruker Corporation
11.16 Plasma-Therm
11.17 Scia Systems GmbH
11.18 EDAX, Inc.
11.19 Innovative Circuits Engineering, Inc.
11.2 IXRF Systems, Inc.
List of Tables
1 Global Failure Analysis Market Outlook, By Region (2020-2028) (US $MN)
2 Global Failure Analysis Market Outlook, By Equipment (2020-2028) (US $MN)
3 Global Failure Analysis Market Outlook, By Scanning Electron Microscope (SEM) (2020-2028) (US $MN)
4 Global Failure Analysis Market Outlook, By Dual–Beam Systems (2020-2028) (US $MN)
5 Global Failure Analysis Market Outlook, By Focused ION Beam System (FIB) (2020-2028) (US $MN)
6 Global Failure Analysis Market Outlook, By Transmission Electron Microscope (TEM) (2020-2028) (US $MN)
7 Global Failure Analysis Market Outlook, By Testing (2020-2028) (US $MN)
8 Global Failure Analysis Market Outlook, By Physical Testing (2020-2028) (US $MN)
9 Global Failure Analysis Market Outlook, By Metallurgical Testing (2020-2028) (US $MN)
10 Global Failure Analysis Market Outlook, By Non-destructive Testing (NDT) (2020-2028) (US $MN)
11 Global Failure Analysis Market Outlook, By Materials Testing (2020-2028) (US $MN)
12 Global Failure Analysis Market Outlook, By Electronic Component Failure Analysis (2020-2028) (US $MN)
13 Global Failure Analysis Market Outlook, By Mechanical Testing (2020-2028) (US $MN)
14 Global Failure Analysis Market Outlook, By Chemical Testing (2020-2028) (US $MN)
15 Global Failure Analysis Market Outlook, By Technology (2020-2028) (US $MN)
16 Global Failure Analysis Market Outlook, By Broad ION Milling (BIM) (2020-2028) (US $MN)
17 Global Failure Analysis Market Outlook, By Reactive ION Etching (RIE) (2020-2028) (US $MN)
18 Global Failure Analysis Market Outlook, By Secondary ION Mass Spectroscopy (SIMS) (2020-2028) (US $MN)
19 Global Failure Analysis Market Outlook, By Energy Dispersive X-Ray Spectroscopy (EDX) (2020-2028) (US $MN)
20 Global Failure Analysis Market Outlook, By Focused ION Beam (FIB) (2020-2028) (US $MN)
21 Global Failure Analysis Market Outlook, By Materials Technology (2020-2028) (US $MN)
22 Global Failure Analysis Market Outlook, By Physics of Failure Analysis (2020-2028) (US $MN)
23 Global Failure Analysis Market Outlook, By Non-Destructive Technology (NDT) (2020-2028) (US $MN)
24 Global Failure Analysis Market Outlook, By Fault Tree Analysis(FTA) (2020-2028) (US $MN)
25 Global Failure Analysis Market Outlook, By Functional Failure Analysis (2020-2028) (US $MN)
26 Global Failure Analysis Market Outlook, By Destructive Physical Analysis (2020-2028) (US $MN)
27 Global Failure Analysis Market Outlook, By Sneak Circuit Analysis (2020-2028) (US $MN)
28 Global Failure Analysis Market Outlook, By Software Failure Analysis (2020-2028) (US $MN)
29 Global Failure Analysis Market Outlook, By Common-Mode Failure Analysis (2020-2028) (US $MN)
30 Global Failure Analysis Market Outlook, By Failure Modes Effect Analysis (FMEA) (2020-2028) (US $MN)
31 Global Failure Analysis Market Outlook, By Failure Modes, Effects, and Criticality Analysis (FMECA) (2020-2028) (US $MN)
32 Global Failure Analysis Market Outlook, By Other Technologies (2020-2028) (US $MN)
33 Global Failure Analysis Market Outlook, By Application (2020-2028) (US $MN)
34 Global Failure Analysis Market Outlook, By Bio Science (2020-2028) (US $MN)
35 Global Failure Analysis Market Outlook, By Neuroscience (2020-2028) (US $MN)
36 Global Failure Analysis Market Outlook, By Cellular Biology (2020-2028) (US $MN)
37 Global Failure Analysis Market Outlook, By Biomedical Engineering (2020-2028) (US $MN)
38 Global Failure Analysis Market Outlook, By Structural Biology (2020-2028) (US $MN)
39 Global Failure Analysis Market Outlook, By Material Science (2020-2028) (US $MN)
40 Global Failure Analysis Market Outlook, By Paper & Fiber Material (2020-2028) (US $MN)
41 Global Failure Analysis Market Outlook, By Polymer (2020-2028) (US $MN)
42 Global Failure Analysis Market Outlook, By Nanofabrication (2020-2028) (US $MN)
43 Global Failure Analysis Market Outlook, By Ceramic & Glass (2020-2028) (US $MN)
44 Global Failure Analysis Market Outlook, By Metals & Metallurgy (2020-2028) (US $MN)
45 Global Failure Analysis Market Outlook, By MEMS and Thin Film Production (2020-2028) (US $MN)
46 Global Failure Analysis Market Outlook, By Semiconductor Manufacturing (2020-2028) (US $MN)
47 Global Failure Analysis Market Outlook, By Industrial Science (2020-2028) (US $MN)
48 Global Failure Analysis Market Outlook, By Power Generation & Energy (2020-2028) (US $MN)
49 Global Failure Analysis Market Outlook, By Chemical (2020-2028) (US $MN)
50 Global Failure Analysis Market Outlook, By Automotive & Aerospace (2020-2028) (US $MN)
51 Global Failure Analysis Market Outlook, By Oil & Gas (2020-2028) (US $MN)
52 Global Failure Analysis Market Outlook, By Renewable Energy (2020-2028) (US $MN)
53 Global Failure Analysis Market Outlook, By Mining (2020-2028) (US $MN)
54 Global Failure Analysis Market Outlook, By Machinery & Tools (2020-2028) (US $MN)
55 Global Failure Analysis Market Outlook, By Other Industrial Science (2020-2028) (US $MN)
Note North America, Europe, Asia Pacific, South America and Middle East & Africa are represented in above manner.
List of Figures
RESEARCH METHODOLOGY

We at ‘Stratistics’ opt for an extensive research approach which involves data mining, data validation, and data analysis. The various research sources include in-house repository, secondary research, competitor’s sources, social media research, client internal data, and primary research.
Our team of analysts prefers the most reliable and authenticated data sources in order to perform the comprehensive literature search. With access to most of the authenticated data bases our team highly considers the best mix of information through various sources to obtain extensive and accurate analysis.
Each report takes an average time of a month and a team of 4 industry analysts. The time may vary depending on the scope and data availability of the desired market report. The various parameters used in the market assessment are standardized in order to enhance the data accuracy.
Data Mining
The data is collected from several authenticated, reliable, paid and unpaid sources and is filtered depending on the scope & objective of the research. Our reports repository acts as an added advantage in this procedure. Data gathering from the raw material suppliers, distributors and the manufacturers is performed on a regular basis, this helps in the comprehensive understanding of the products value chain. Apart from the above mentioned sources the data is also collected from the industry consultants to ensure the objective of the study is in the right direction.
Market trends such as technological advancements, regulatory affairs, market dynamics (Drivers, Restraints, Opportunities and Challenges) are obtained from scientific journals, market related national & international associations and organizations.
Data Analysis
From the data that is collected depending on the scope & objective of the research the data is subjected for the analysis. The critical steps that we follow for the data analysis include:
- Product Lifecycle Analysis
- Competitor analysis
- Risk analysis
- Porters Analysis
- PESTEL Analysis
- SWOT Analysis
The data engineering is performed by the core industry experts considering both the Marketing Mix Modeling and the Demand Forecasting. The marketing mix modeling makes use of multiple-regression techniques to predict the optimal mix of marketing variables. Regression factor is based on a number of variables and how they relate to an outcome such as sales or profits.
Data Validation
The data validation is performed by the exhaustive primary research from the expert interviews. This includes telephonic interviews, focus groups, face to face interviews, and questionnaires to validate our research from all aspects. The industry experts we approach come from the leading firms, involved in the supply chain ranging from the suppliers, distributors to the manufacturers and consumers so as to ensure an unbiased analysis.
We are in touch with more than 15,000 industry experts with the right mix of consultants, CEO's, presidents, vice presidents, managers, experts from both supply side and demand side, executives and so on.
The data validation involves the primary research from the industry experts belonging to:
- Leading Companies
- Suppliers & Distributors
- Manufacturers
- Consumers
- Industry/Strategic Consultants
Apart from the data validation the primary research also helps in performing the fill gap research, i.e. providing solutions for the unmet needs of the research which helps in enhancing the reports quality.
For more details about research methodology, kindly write to us at info@strategymrc.com
Frequently Asked Questions
In case of any queries regarding this report, you can contact the customer service by filing the “Inquiry Before Buy” form available on the right hand side. You may also contact us through email: info@strategymrc.com or phone: +1-301-202-5929
Yes, the samples are available for all the published reports. You can request them by filling the “Request Sample” option available in this page.
Yes, you can request a sample with your specific requirements. All the customized samples will be provided as per the requirement with the real data masked.
All our reports are available in Digital PDF format. In case if you require them in any other formats, such as PPT, Excel etc you can submit a request through “Inquiry Before Buy” form available on the right hand side. You may also contact us through email: info@strategymrc.com or phone: +1-301-202-5929
We offer a free 15% customization with every purchase. This requirement can be fulfilled for both pre and post sale. You may send your customization requirements through email at info@strategymrc.com or call us on +1-301-202-5929.
We have 3 different licensing options available in electronic format.
- Single User Licence: Allows one person, typically the buyer, to have access to the ordered product. The ordered product cannot be distributed to anyone else.
- 2-5 User Licence: Allows the ordered product to be shared among a maximum of 5 people within your organisation.
- Corporate License: Allows the product to be shared among all employees of your organisation regardless of their geographical location.
All our reports are typically be emailed to you as an attachment.
To order any available report you need to register on our website. The payment can be made either through CCAvenue or PayPal payments gateways which accept all international cards.
We extend our support to 6 months post sale. A post sale customization is also provided to cover your unmet needs in the report.
Request Customization
We offer complimentary customization of up to 15% with every purchase. To share your customization requirements, feel free to email us at info@strategymrc.com or call us on +1-301-202-5929. .
Please Note: Customization within the 15% threshold is entirely free of charge. If your request exceeds this limit, we will conduct a feasibility assessment. Following that, a detailed quote and timeline will be provided.
WHY CHOOSE US ?

Assured Quality
Best in class reports with high standard of research integrity

24X7 Research Support
Continuous support to ensure the best customer experience.

Free Customization
Adding more values to your product of interest.

Safe & Secure Access
Providing a secured environment for all online transactions.

Trusted by 600+ Brands
Serving the most reputed brands across the world.