
Flywheel Energy Storage System Market
Flywheel Energy Storage System Market Forecasts to 2030 - Global Analysis By Type (Low-Speed Flywheels and High-Speed Flywheels), Rim Type (Carbon-Fiber Composite Rim, Steel Rim and Aluminum Rim), Integration, Application, End User and By Geography

|
Years Covered |
2021-2030 |
|
Estimated Year Value (2023) |
US $1.42 BN |
|
Projected Year Value (2030) |
US $1.95 BN |
|
CAGR (2023 - 2030) |
4.4% |
|
Regions Covered |
North America, Europe, Asia Pacific, South America, and Middle East & Africa |
|
Countries Covered |
US, Canada, Mexico, Germany, UK, Italy, France, Spain, Japan, China, India, Australia, New Zealand, South Korea, Rest of Asia Pacific, South America, Argentina, Brazil, Chile, Middle East & Africa, Saudi Arabia, UAE, Qatar, and South Africa |
|
Largest Market |
Asia Pacific |
|
Highest Growing Market |
Europe |
According to Stratistics MRC, the Global Flywheel Energy Storage System Market is accounted for $1.42 billion in 2023 and is expected to reach $1.95 billion by 2030 growing at a CAGR of 4.4% during the forecast period. Flywheel energy storage systems store energy kinetically, converting excess electricity into rotational motion. During periods of low demand, the system accelerates a massive flywheel to store energy, and when demand spikes, it releases the stored energy by decelerating the flywheel. This rapid energy transfer enables quick response times, making flywheels valuable for grid stabilization and backup power. Their mechanical nature allows for high cycle efficiency and minimal degradation over time.
According to the International Energy Agency (IEA), by 2035, the developing nations will represent 80% of the total growth in energy production and consumption.
Market Dynamics:
Driver:
Increasing awareness of energy storage benefits
Flywheel system's quick response times, great energy economy, and dependability are becoming more desirable as utilities and industry increasingly realise the importance of effective energy management. Adoption of these systems is accelerated by this increased awareness as well as a developing comprehension of the function flywheel technology plays in grid stability and integration of renewable energy. The beneficial impact of knowledge is further amplified by technological improvements and a focus on sustainable energy solutions. This leads to the rise of the market and establishes flywheel energy storage as a major player in the changing energy environment.
Restraint:
Environmental concerns
Environmental concerns in Flywheel Energy Storage Systems (FESS) primarily arise from the materials used in construction and potential impacts during manufacturing and disposal. While FESS is generally considered cleaner than some alternatives, concerns linger about the environmental footprint. The extraction and processing of materials, as well as the end-of-life disposal, contributes to negative ecological effects. These concerns hinder the market growth.
Opportunity:
Mounting government support and incentives
Governments worldwide are increasingly recognizing the importance of energy storage for grid stability and renewable energy integration. By offering financial support, subsidies, and favourable policies, governments encourage the adoption of FESS technologies. This support not only reduces initial investment barriers for businesses and utilities but also fosters a conducive regulatory environment. As a result, the growing governmental backing acts as a catalyst, driving increased adoption of FESS and fostering a favourable market landscape for the technology.
Threat:
High initial costs
Flywheel Energy Storage Systems (FESS) incurs high initial costs due to the sophisticated engineering required for precision-machined components, advanced materials, and intricate control systems. The manufacturing and integration of high-speed rotating components contribute to elevated expenses. Businesses and utilities may be deterred by the upfront investment, choosing alternative energy storage options with perceived lower initial costs. This cost factor becomes a hindrance in the market, limiting widespread adoption.
Covid-19 Impact
The covid-19 pandemic has affected the flywheel energy storage system market significantly by causing disruptions in supply chains, project delays, and reduced investments. Lockdowns and restrictions have impacted manufacturing and installation processes, leading to a slowdown in market growth. However, the increasing focus on renewable energy and grid stability, coupled with government initiatives for sustainable solutions, driven the recovery and future growth of the flywheel energy storage system market as the global economy gradually stabilizes post-pandemic.
The renewable integration segment is expected to be the largest during the forecast period
The renewable integration segment is estimated to have a lucrative growth. Flywheel energy storage systems play a crucial role in renewable energy integration by addressing the intermittent nature of sources like wind and solar. FESS provides rapid response capabilities, efficiently storing excess energy during peak generation periods and releasing it when demand is high or renewable sources are inactive. This enables grid stabilization, frequency regulation, and ensures a consistent power supply. As renewable energy capacity grows, FESS serves as a valuable solution, enhancing the reliability of the grid and facilitating seamless integration of clean energy sources into existing power systems.
The industrial segment is expected to have the highest CAGR during the forecast period
The industrial segment is anticipated to witness the highest CAGR growth during the forecast period. Flywheel energy storage systems find valuable applications in the industrial sector by enhancing energy efficiency and providing reliable power solutions. In industries, FESS acts as an uninterruptible power supply, ensuring a stable power source during grid fluctuations or outages. Their rapid response and high energy density make them ideal for critical applications, preventing production disruptions. With these benefits, FESS contributes to grid stability, cost savings, and increased reliability in the industrial sector, making it a compelling energy storage solution.
Region with largest share:
Asia Pacific is projected to hold the largest market share during the forecast period. Rapid industrialization, increasing energy demand, and a shift towards renewable energy sources drive the adoption of FESS. Countries like China, Japan, and South Korea are investing heavily in energy storage technologies to enhance grid stability and support renewable integration. Additionally, supportive government policies, incentives, and initiatives for sustainable energy solutions contribute to the market's expansion. The Asia-Pacific FESS market is poised for further development, driven by a combination of economic growth, energy transition goals, and favourable regulatory environments in the region.
Region with highest CAGR:
Europe is projected to have the highest CAGR over the forecast period. Europe is experiencing robust growth due to the region's emphasis on renewable energy integration and grid stability. Government initiatives, stringent environmental regulations, and incentives for energy storage technologies contribute to market expansion. As Europe continues its transition to cleaner energy sources, the FESS market is poised for further development, with increased investments and partnerships shaping a dynamic and promising landscape for flywheel technology in the region.

Key players in the market
Some of the key players profiled in the Flywheel Energy Storage System Market include Kinetic Traction Systems, Beacon Power LLC, Active Power, Temporal Power Limited, Powerthru, Vycon Energy, Amber Kinetics, Energiestro, Rheinmetall AG, Siemens AG, The Boeing Company, Adaptive Balancing Power GmbH, GKN Hybrid Power Limited, Pentadyne Power Corporation, STORNETIC GmbH and Calnetix Technologies LLC.
Key Developments:
In July 2022, Active Power partnered with Central Power to bring live PowerHouse power outage demonstrations alongside Central Power standby generators. The PowerHouse has the company’s flagship cleansource plus MMS 1.33MW UPS with automatic transfer.
In June 2022, Adaptive Balancing Power delivered a new charging infrastructure with flywheel storage, enabling switching to e-buses in the area even without expanding the power grids. The pantograph charging station using the high-performance flywheel mass storage will likely go into operation after the test phase in regular driving operations.
Types Covered:
• Low-Speed Flywheels
• High-Speed Flywheels
Rim Types Covered:
• Carbon-Fiber Composite Rim
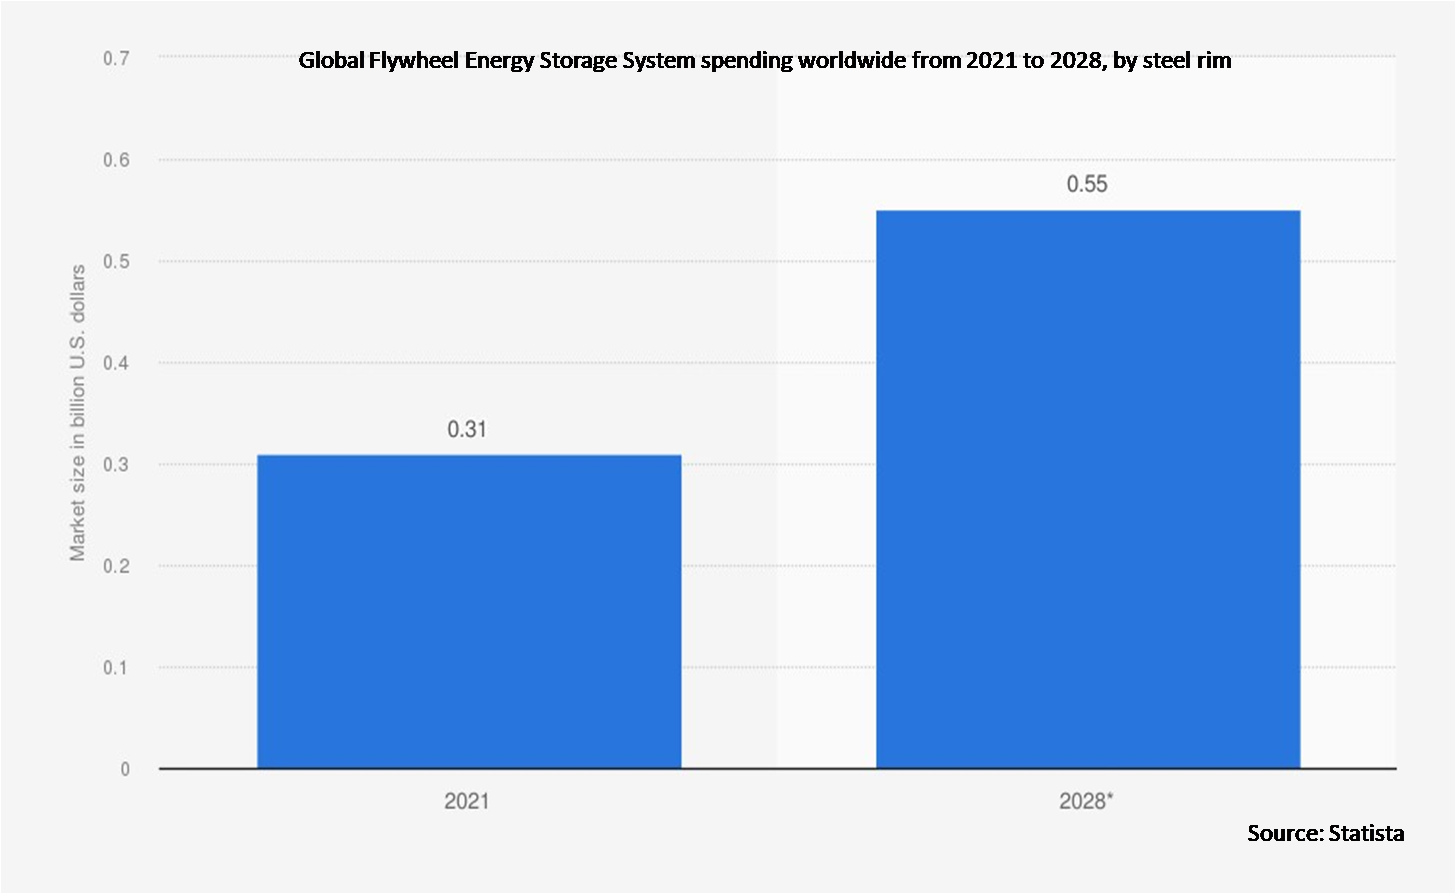
• Steel Rim
• Aluminum Rim
Integrations Covered:
• Grid-Tied
• Off-Grid
Applications Covered:
• Uninterruptible Power Supply (UPS)
• Grid Storage
• Renewable Integration
• Data Centers
• Transportation
• Other Applications
End Users Covered:
• Automotive
• Defense & Aerospace
• Healthcare
• Residential
• Commercial
• Industrial
• Utilities
• Other End Users
Regions Covered:
• North America
o US
o Canada
o Mexico
• Europe
o Germany
o UK
o Italy
o France
o Spain
o Rest of Europe
• Asia Pacific
o Japan
o China
o India
o Australia
o New Zealand
o South Korea
o Rest of Asia Pacific
• South America
o Argentina
o Brazil
o Chile
o Rest of South America
• Middle East & Africa
o Saudi Arabia
o UAE
o Qatar
o South Africa
o Rest of Middle East & Africa
What our report offers:
- Market share assessments for the regional and country-level segments
- Strategic recommendations for the new entrants
- Covers Market data for the years 2021, 2022, 2023, 2026, and 2030
- Market Trends (Drivers, Constraints, Opportunities, Threats, Challenges, Investment Opportunities, and recommendations)
- Strategic recommendations in key business segments based on the market estimations
- Competitive landscaping mapping the key common trends
- Company profiling with detailed strategies, financials, and recent developments
- Supply chain trends mapping the latest technological advancements
Free Customization Offerings:
All the customers of this report will be entitled to receive one of the following free customization options:
• Company Profiling
o Comprehensive profiling of additional market players (up to 3)
o SWOT Analysis of key players (up to 3)
• Regional Segmentation
o Market estimations, Forecasts and CAGR of any prominent country as per the client's interest (Note: Depends on feasibility check)
• Competitive Benchmarking
o Benchmarking of key players based on product portfolio, geographical presence, and strategic alliances
Table of Contents
1 Executive Summary
2 Preface
2.1 Abstract
2.2 Stake Holders
2.3 Research Scope
2.4 Research Methodology
2.4.1 Data Mining
2.4.2 Data Analysis
2.4.3 Data Validation
2.4.4 Research Approach
2.5 Research Sources
2.5.1 Primary Research Sources
2.5.2 Secondary Research Sources
2.5.3 Assumptions
3 Market Trend Analysis
3.1 Introduction
3.2 Drivers
3.3 Restraints
3.4 Opportunities
3.5 Threats
3.6 Application Analysis
3.7 End User Analysis
3.8 Emerging Markets
3.9 Impact of Covid-19
4 Porters Five Force Analysis
4.1 Bargaining power of suppliers
4.2 Bargaining power of buyers
4.3 Threat of substitutes
4.4 Threat of new entrants
4.5 Competitive rivalry
5 Global Flywheel Energy Storage System Market, By Type
5.1 Introduction
5.2 Low-Speed Flywheels
5.3 High-Speed Flywheels
6 Global Flywheel Energy Storage System Market, By Rim Type
6.1 Introduction
6.2 Carbon-Fiber Composite Rim
6.3 Steel Rim
6.4 Aluminum Rim
7 Global Flywheel Energy Storage System Market, By Integration
7.1 Introduction
7.2 Grid-Tied
7.3 Off-Grid
8 Global Flywheel Energy Storage System Market, By Application
8.1 Introduction
8.2 Uninterruptible Power Supply (UPS)
8.3 Grid Storage
8.4 Renewable Integration
8.5 Data Centers
8.6 Transportation
8.7 Other Applications
9 Global Flywheel Energy Storage System Market, By End User
9.1 Introduction
9.2 Automotive
9.3 Defense & Aerospace
9.4 Healthcare
9.5 Residential
9.6 Commercial
9.7 Industrial
9.8 Utilities
9.9 Other End Users
10 Global Flywheel Energy Storage System Market, By Geography
10.1 Introduction
10.2 North America
10.2.1 US
10.2.2 Canada
10.2.3 Mexico
10.3 Europe
10.3.1 Germany
10.3.2 UK
10.3.3 Italy
10.3.4 France
10.3.5 Spain
10.3.6 Rest of Europe
10.4 Asia Pacific
10.4.1 Japan
10.4.2 China
10.4.3 India
10.4.4 Australia
10.4.5 New Zealand
10.4.6 South Korea
10.4.7 Rest of Asia Pacific
10.5 South America
10.5.1 Argentina
10.5.2 Brazil
10.5.3 Chile
10.5.4 Rest of South America
10.6 Middle East & Africa
10.6.1 Saudi Arabia
10.6.2 UAE
10.6.3 Qatar
10.6.4 South Africa
10.6.5 Rest of Middle East & Africa
11 Key Developments
11.1 Agreements, Partnerships, Collaborations and Joint Ventures
11.2 Acquisitions & Mergers
11.3 New Product Launch
11.4 Expansions
11.5 Other Key Strategies
12 Company Profiling
12.1 Kinetic Traction Systems
12.2 Beacon Power LLC
12.3 Active Power
12.4 Temporal Power Limited
12.5 Powerthru
12.6 Vycon Energy
12.7 Amber Kinetics
12.8 Energiestro
12.9 Rheinmetall AG
12.10 Siemens AG
12.11 The Boeing Company
12.12 Adaptive Balancing Power GmbH
12.13 GKN Hybrid Power Limited
12.14 Pentadyne Power Corporation
12.15 STORNETIC GmbH
12.16 Calnetix Technologies LLC
List of Tables
1 Global Flywheel Energy Storage System Market Outlook, By Region (2021-2030) ($MN)
2 Global Flywheel Energy Storage System Market Outlook, By Type (2021-2030) ($MN)
3 Global Flywheel Energy Storage System Market Outlook, By Low-Speed Flywheels (2021-2030) ($MN)
4 Global Flywheel Energy Storage System Market Outlook, By High-Speed Flywheels (2021-2030) ($MN)
5 Global Flywheel Energy Storage System Market Outlook, By Rim Type (2021-2030) ($MN)
6 Global Flywheel Energy Storage System Market Outlook, By Carbon-Fiber Composite Rim (2021-2030) ($MN)
7 Global Flywheel Energy Storage System Market Outlook, By Steel Rim (2021-2030) ($MN)
8 Global Flywheel Energy Storage System Market Outlook, By Aluminum Rim (2021-2030) ($MN)
9 Global Flywheel Energy Storage System Market Outlook, By Integration (2021-2030) ($MN)
10 Global Flywheel Energy Storage System Market Outlook, By Grid-Tied (2021-2030) ($MN)
11 Global Flywheel Energy Storage System Market Outlook, By Off-Grid (2021-2030) ($MN)
12 Global Flywheel Energy Storage System Market Outlook, By Application (2021-2030) ($MN)
13 Global Flywheel Energy Storage System Market Outlook, By Uninterruptible Power Supply (UPS) (2021-2030) ($MN)
14 Global Flywheel Energy Storage System Market Outlook, By Grid Storage (2021-2030) ($MN)
15 Global Flywheel Energy Storage System Market Outlook, By Renewable Integration (2021-2030) ($MN)
16 Global Flywheel Energy Storage System Market Outlook, By Data Centers (2021-2030) ($MN)
17 Global Flywheel Energy Storage System Market Outlook, By Transportation (2021-2030) ($MN)
18 Global Flywheel Energy Storage System Market Outlook, By Other Applications (2021-2030) ($MN)
19 Global Flywheel Energy Storage System Market Outlook, By End User (2021-2030) ($MN)
20 Global Flywheel Energy Storage System Market Outlook, By Automotive (2021-2030) ($MN)
21 Global Flywheel Energy Storage System Market Outlook, By Defense & Aerospace (2021-2030) ($MN)
22 Global Flywheel Energy Storage System Market Outlook, By Healthcare (2021-2030) ($MN)
23 Global Flywheel Energy Storage System Market Outlook, By Residential (2021-2030) ($MN)
24 Global Flywheel Energy Storage System Market Outlook, By Commercial (2021-2030) ($MN)
25 Global Flywheel Energy Storage System Market Outlook, By Industrial (2021-2030) ($MN)
26 Global Flywheel Energy Storage System Market Outlook, By Utilities (2021-2030) ($MN)
27 Global Flywheel Energy Storage System Market Outlook, By Other End Users (2021-2030) ($MN)
Note: Tables for North America, Europe, APAC, South America, and Middle East & Africa Regions are also represented in the same manner as above.
List of Figures
RESEARCH METHODOLOGY

We at ‘Stratistics’ opt for an extensive research approach which involves data mining, data validation, and data analysis. The various research sources include in-house repository, secondary research, competitor’s sources, social media research, client internal data, and primary research.
Our team of analysts prefers the most reliable and authenticated data sources in order to perform the comprehensive literature search. With access to most of the authenticated data bases our team highly considers the best mix of information through various sources to obtain extensive and accurate analysis.
Each report takes an average time of a month and a team of 4 industry analysts. The time may vary depending on the scope and data availability of the desired market report. The various parameters used in the market assessment are standardized in order to enhance the data accuracy.
Data Mining
The data is collected from several authenticated, reliable, paid and unpaid sources and is filtered depending on the scope & objective of the research. Our reports repository acts as an added advantage in this procedure. Data gathering from the raw material suppliers, distributors and the manufacturers is performed on a regular basis, this helps in the comprehensive understanding of the products value chain. Apart from the above mentioned sources the data is also collected from the industry consultants to ensure the objective of the study is in the right direction.
Market trends such as technological advancements, regulatory affairs, market dynamics (Drivers, Restraints, Opportunities and Challenges) are obtained from scientific journals, market related national & international associations and organizations.
Data Analysis
From the data that is collected depending on the scope & objective of the research the data is subjected for the analysis. The critical steps that we follow for the data analysis include:
- Product Lifecycle Analysis
- Competitor analysis
- Risk analysis
- Porters Analysis
- PESTEL Analysis
- SWOT Analysis
The data engineering is performed by the core industry experts considering both the Marketing Mix Modeling and the Demand Forecasting. The marketing mix modeling makes use of multiple-regression techniques to predict the optimal mix of marketing variables. Regression factor is based on a number of variables and how they relate to an outcome such as sales or profits.
Data Validation
The data validation is performed by the exhaustive primary research from the expert interviews. This includes telephonic interviews, focus groups, face to face interviews, and questionnaires to validate our research from all aspects. The industry experts we approach come from the leading firms, involved in the supply chain ranging from the suppliers, distributors to the manufacturers and consumers so as to ensure an unbiased analysis.
We are in touch with more than 15,000 industry experts with the right mix of consultants, CEO's, presidents, vice presidents, managers, experts from both supply side and demand side, executives and so on.
The data validation involves the primary research from the industry experts belonging to:
- Leading Companies
- Suppliers & Distributors
- Manufacturers
- Consumers
- Industry/Strategic Consultants
Apart from the data validation the primary research also helps in performing the fill gap research, i.e. providing solutions for the unmet needs of the research which helps in enhancing the reports quality.
For more details about research methodology, kindly write to us at info@strategymrc.com
Frequently Asked Questions
In case of any queries regarding this report, you can contact the customer service by filing the “Inquiry Before Buy” form available on the right hand side. You may also contact us through email: info@strategymrc.com or phone: +1-301-202-5929
Yes, the samples are available for all the published reports. You can request them by filling the “Request Sample” option available in this page.
Yes, you can request a sample with your specific requirements. All the customized samples will be provided as per the requirement with the real data masked.
All our reports are available in Digital PDF format. In case if you require them in any other formats, such as PPT, Excel etc you can submit a request through “Inquiry Before Buy” form available on the right hand side. You may also contact us through email: info@strategymrc.com or phone: +1-301-202-5929
We offer a free 15% customization with every purchase. This requirement can be fulfilled for both pre and post sale. You may send your customization requirements through email at info@strategymrc.com or call us on +1-301-202-5929.
We have 3 different licensing options available in electronic format.
- Single User Licence: Allows one person, typically the buyer, to have access to the ordered product. The ordered product cannot be distributed to anyone else.
- 2-5 User Licence: Allows the ordered product to be shared among a maximum of 5 people within your organisation.
- Corporate License: Allows the product to be shared among all employees of your organisation regardless of their geographical location.
All our reports are typically be emailed to you as an attachment.
To order any available report you need to register on our website. The payment can be made either through CCAvenue or PayPal payments gateways which accept all international cards.
We extend our support to 6 months post sale. A post sale customization is also provided to cover your unmet needs in the report.
Request Customization
We offer complimentary customization of up to 15% with every purchase. To share your customization requirements, feel free to email us at info@strategymrc.com or call us on +1-301-202-5929. .
Please Note: Customization within the 15% threshold is entirely free of charge. If your request exceeds this limit, we will conduct a feasibility assessment. Following that, a detailed quote and timeline will be provided.
WHY CHOOSE US ?

Assured Quality
Best in class reports with high standard of research integrity

24X7 Research Support
Continuous support to ensure the best customer experience.

Free Customization
Adding more values to your product of interest.

Safe & Secure Access
Providing a secured environment for all online transactions.

Trusted by 600+ Brands
Serving the most reputed brands across the world.