
Fracking Proppants Market
Fracking Proppants Market Forecasts to 2028 – Global Analysis By Product (Resin Coated Proppants, Ceramic Proppants), Application (Coal Bed Methane, Tight Gas, Shale Gas) and By Geography

|
Years Covered |
2020-2028 |
|
Estimated Year Value (2022) |
US $156.57 BN |
|
Projected Year Value (2028) |
US $412.04 BN |
|
CAGR (2022 - 2028) |
17.5% |
|
Regions Covered |
North America, Europe, Asia Pacific, South America, and Middle East & Africa |
|
Countries Covered |
US, Canada, Mexico, Germany, UK, Italy, France, Spain, Japan, China, India, Australia, New Zealand, South Korea, Rest of Asia Pacific, South America, Argentina, Brazil, Chile, Middle East & Africa, Saudi Arabia, UAE, Qatar, and South Africa |
|
Largest Market |
Europe |
|
Highest Growing Market |
Asia Pacific |
According to Stratistics MRC, the Global Fracking Proppants Market is accounted for $156.57 billion in 2022 and is expected to reach $412.04 billion by 2028 growing at a CAGR of 17.5% during the forecast period. Fracking proppant is a hard material used to seize open cracks in the wellbore which are generated by the procedure of hydraulic fracturing, providing a conduit for hydrocarbons to access the wellbore. Hydraulic fracturing involves the usage of a fluid mixture consisting of one or more additives, typically water as a base fluid and a proppant such as sand. The mixture is pumped into a well under pressure with the help of pumps at the surface to bring fractures in the target zone or the geological development.
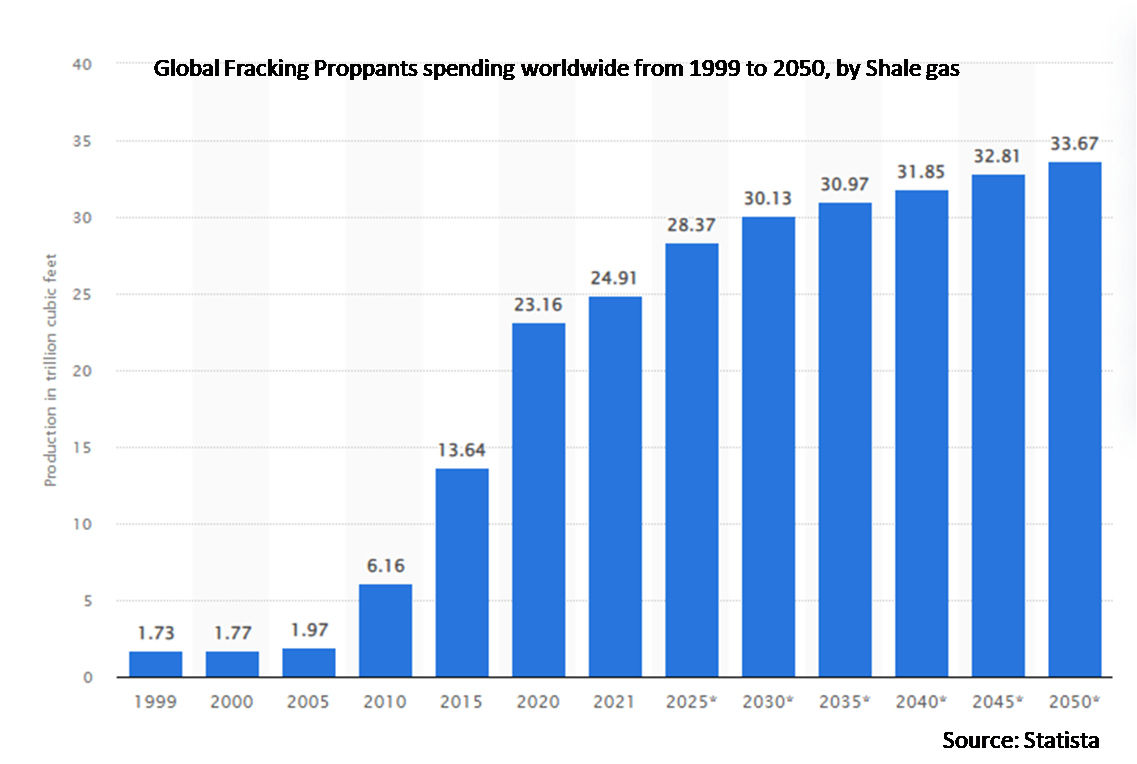
According to EIA, the production from shale gas and tight oil will increase from about 14 trillion cubic feet (Tcf) in 2015 to 29 Tcf in 2040, thereby enhancing the market demand. As per the statistics provided by the US Energy Information Administration (EIA), the natural gas production globally is expected to increase from 342 billion cubic feet per day in 2015 to 554 billion cubic feet per day (bcf/d) by the year 2040.Canada has been producing shale gas since 2008, and the production is expected to increase and to account for 30% of Canada’s total natural gas production by 2040. According to the US Energy Information Administration (EIA), the crude oil production reached 12.23 million barrels per day (b/d) in 2019, 1.24 million b/d more than 2018 levels in United States. In the Offshore Federal Gulf of Mexico (the U.S. controlled waters in the Gulf of Mexico), new projects contributed to the region’s growth in production in 2019. Oil and natural gas producers brought online seven new projects in 2019, with nine more projects being expected to come online by the end of 2020.
Market Dynamics:
Driver:
Directional Drilling and Hydraulic Stimulation Technology
Reversing drilling and hydraulic stimulation techniques have been the driving forces behind the recovery of unconventional energy resources including shale gas, tight sands gas, and coal bed methane. Natural gas is trapped in fine, isolated porosity and adsorbed onto the shale's other organic elements. Because of the shale's somewhat impermeable character, more surface area must be created in order to recover trapped natural gas in commercially acceptable volumes. Directional drilling allows high recovery rates from intersecting cracks in the shale, whereas hydraulic stimulation fractures the shale to offer the large surface area necessary for gas retrieval. Hydraulic stimulation, often known as "hydrofracturing" in the industry, is a crucial method for developing and maintaining high-permeability channels for resource recovery throughout the well's life. This is generally accomplished by injecting slurry of surfactants, corrosives, and aggregates into the well bore under pressure to induce and sustain fractures. This act as one of the driver for the market growth.
Restraint:
High cost
Ceramic proppants is an engineered product manufactured from sintered bauxite, kaolin, and magnesium silicate or mixtures of bauxite and kaolin using an energy-intensive manufacturing process. This manufacturing process is complex as the proppants must have uniform size, shape, sphericity, and roundness to yield higher porosity and permeability of the proppants bed. Ceramic proppants have higher strength and crush resistance than frac sand, as they can withstand closure stresses up to 20,000 psi. Ceramic proppants are costlier than uncoated or resin-coated proppants as it is an engineered product with a more complex manufacturing process.
Opportunity:
Investigation of unconventional oil and gas reserves growing
One of the most active fields of the geological sciences is hydrocarbon exploration. Petroleum geologists tasked with finding oil and natural gas confronts a challenging task: oil and gas reserves are difficult to locate, and drilling in the incorrect location loses time and resources. Furthermore, the traditional oil supply has reached its limit, while demand for liquid fuels continues to rise. To solve the oil supply and demand dilemma, one method is to look for new, unconventional oil sources. Unconventional oil is defined differently by different people, although it commonly refers to oil shale, oil sands, ultra-deepwater oil, extremely heavy oil, tight oil, and Arctic oil. Unconventional oils are heavier and contain more carbon and sulphur than standard oils. They also contain contaminants, making refinement more challenging. In comparison to their more easily available conventional equivalents, unconventional oils are more difficult to extract and require specific equipment and technology to deal with their location and/or composition.
Threat:
Water accessibility and contamination concerns
Companies generally use a range of water sources such as rivers, lakes, groundwater, discharge water from industrial or city wastewater treatment plants, and re-used fracturing water. Temporary pipelines or trucks are used to carry the water to drilling locations. Companies attempt to use a mix of water sources depending on the region and the proximity of water sources. On average, 3 million gallons of water is required per well for hydraulic fracturing. However, this quantity varies widely across provinces. It also depends on how many stages of fracturing are conducted at a well. There are two distinct problems concerning water use in hydraulic fracturing. First, the limited availability of water for hydraulic fracturing, and second, concerns related to water contamination due to fracturing chemicals. The COVID-19 outbreak has negatively impacted the proppants industry due to supply chain disruption, operational challenges, transportation delays, and travel restrictions. The oil and gas sector has been severely affected by the pandemic and has postponed exploration activities.
The Shale Gas segment is expected to be the largest during the forecast period
The Shale Gas segment is expected to be the largest during the forecast period. The growing application of proppants is predictable to boost this segment in the coming years. Shale gas, which comprises 70 to 90 percent of methane, helps generate electricity and acts as a domestic source for heating and cooking.
The Frac Sand segment is expected to have the highest CAGR during the forecast period
The Frac Sand segment is expected to have the highest CAGR during the forecast period. Frac sandare high-purity quartz sand which is very round and durable grains. They offer crush-resistant, which helps them to be used as a fracking material in the petroleum industry.
Region with highest share:
Europe is projected to hold the largest market share during the forecast period, owing to the high-rise of hydraulic fracking in the province. Hydraulic fracking involves the use of proppants for the extraction of energy sources such as shale gas and tight gas. Furthermore, the rising demand for unconventional energy sources due to their several advantages over conventional sources in terms of pollution has led to the rise in hydraulic fracking along with horizontal drilling in the province. This has led to a rise in regional demand.
Region with highest CAGR:
Asia Pacific is projected to have the highest CAGR over the forecast period, due to the existence of enormous shale gas reserves and hydraulic fracturing projects in China and Australia coupled with potential shale gas extraction projects in India. Governments of countries like China and India have announced plans to develop shale gas reserves as a part of their 12th five-year plans, which is anticipated to have a positive impact on market growth.

Key players in the market:
Some of the key players profiled in the Fracking Proppants Market include Yixing Orient Petroleum Proppant Co. Ltd, Unimin Corporation, U.S. Silica, Saint-Gobain, Preferred Sands, COVIA, Mineracao Curimbaba Ltd, Hi crush LP Partners, Fores Ltd, Fairmount Santrol, Carbo Ceramic, Baker Hughes, Atlas Resin Proppants LP, COVIA.
Key Developments:
In May 2019, Hi-Crush Inc. acquired Proppant Logistics LLC which owns Pronghorn Logistics LLC. The company provides end-to end logistic services for proppants.
In December 2021: Covia, announced that its Industrial Segment will adopt a price rise of up to 15% across all product lines beginning January 1, 2022. This step is important to assist balance sustained and considerable inflationary pressures in a variety of sectors, including energy, steel, packaging, transportation, labour, resins, and additives, and will enable Covia to retain its service and value to industrial clients.
Fracturing Technologies Covered:
• Natural Induced Hydraulic Fracturing
• Polylactic Acid Base Fiber Technology
• Induced Hydraulic Fracturing
Products Covered:
• Resin Coated Proppants
• Ceramic Proppants
• Frac Sand
Applications Covered:
• Coal Bed Methane
• Tight Gas
• Shale Gas
Regions Covered:
• North America
o US
o Canada
o Mexico
• Europe
o Germany
o UK
o Italy
o France
o Spain
o Rest of Europe
• Asia Pacific
o Japan
o China
o India
o Australia
o New Zealand
o South Korea
o Rest of Asia Pacific
• South America
o Argentina
o Brazil
o Chile
o Rest of South America
• Middle East & Africa
o Saudi Arabia
o UAE
o Qatar
o South Africa
o Rest of Middle East & Africa
What our report offers:
- Market share assessments for the regional and country-level segments
- Strategic recommendations for the new entrants
- Covers Market data for the years 2020, 2021, 2022, 2025 and 2028
- Market Trends (Drivers, Constraints, Opportunities, Threats, Challenges, Investment Opportunities, and recommendations)
- Strategic recommendations in key business segments based on the market estimations
- Competitive landscaping mapping the key common trends
- Company profiling with detailed strategies, financials, and recent developments
- Supply chain trends mapping the latest technological advancements
Free Customization Offerings:
All the customers of this report will be entitled to receive one of the following free customization options:
• Company Profiling
o Comprehensive profiling of additional market players (up to 3)
o SWOT Analysis of key players (up to 3)
• Regional Segmentation
o Market estimations, Forecasts and CAGR of any prominent country as per the client's interest (Note: Depends on feasibility check)
• Competitive Benchmarking
o Benchmarking of key players based on product portfolio, geographical presence, and strategic alliances
Table of Contents
1 Executive Summary
2 Preface
2.1 Abstract
2.2 Stake Holders
2.3 Research Scope
2.4 Research Methodology
2.4.1 Data Mining
2.4.2 Data Analysis
2.4.3 Data Validation
2.4.4 Research Approach
2.5 Research Sources
2.5.1 Primary Research Sources
2.5.2 Secondary Research Sources
2.5.3 Assumptions
3 Market Trend Analysis
3.1 Introduction
3.2 Drivers
3.3 Restraints
3.4 Opportunities
3.5 Threats
3.6 Technology Analysis
3.7 Product Analysis
3.8 Application Analysis
3.9 Emerging Markets
3.10 Impact of Covid-19
4 Porters Five Force Analysis
4.1 Bargaining power of suppliers
4.2 Bargaining power of buyers
4.3 Threat of substitutes
4.4 Threat of new entrants
4.5 Competitive rivalry
5 Global Fracking Proppants Market, By Fracturing Technology
5.1 Introduction
5.2 Natural Induced Hydraulic Fracturing
5.3 Polylactic Acid Base Fiber Technology
5.4 Induced Induced Hydraulic Fracturing
6 Global Fracking Proppants Market, By Product
6.1 Introduction
6.2 Resin Coated Proppants
6.3 Ceramic Proppants
6.4 Frac Sand
7 Global Fracking Proppants Market, By Application
7.1 Introduction
7.2 Coal Bed Methane
7.3 Tight Gas
7.4 Shale Gas
7.5 Other Applications
8 Global Fracking Proppants Market, By Geography
8.1 Introduction
8.2 North America
8.2.1 US
8.2.2 Canada
8.2.3 Mexico
8.3 Europe
8.3.1 Germany
8.3.2 UK
8.3.3 Italy
8.3.4 France
8.3.5 Spain
8.3.6 Rest of Europe
8.4 Asia Pacific
8.4.1 Japan
8.4.2 China
8.4.3 India
8.4.4 Australia
8.4.5 New Zealand
8.4.6 South Korea
8.4.7 Rest of Asia Pacific
8.5 South America
8.5.1 Argentina
8.5.2 Brazil
8.5.3 Chile
8.5.4 Rest of South America
8.6 Middle East & Africa
8.6.1 Saudi Arabia
8.6.2 UAE
8.6.3 Qatar
8.6.4 South Africa
8.6.5 Rest of Middle East & Africa
9 Key Developments
9.1 Agreements, Partnerships, Collaborations and Joint Ventures
9.2 Acquisitions & Mergers
9.3 New Product Launch
9.4 Expansions
9.5 Other Key Strategies
10 Company Profiling
10.1 Baker Hughes
10.2 Saint-Gobain
10.3 Mineracao Curimbaba Ltd
10.4 Momentive
10.5 Fairmount Santrol
10.6 Carbo Ceramic
10.7 Unimin Corporation
10.8 U.S. Silica
10.9 Preferred Sands
10.10 Atlas Resin Proppants LP
10.11 Yixing Orient Petroleum Proppant Co. Ltd
10.12 Fores Ltd
10.13 Hi crush LP Partners
List of Tables
1 Global Fracking Proppants Market Outlook, By Region (2020-2028) (US $MN)
2 Global Fracking Proppants Market Outlook, By Fracturing Technology (2020-2028) (US $MN)
3 Global Fracking Proppants Market Outlook, By Natural Induced Hydraulic Fracturing (2020-2028) (US $MN)
4 Global Fracking Proppants Market Outlook, By Polylactic Acid Base Fiber Technology (2020-2028) (US $MN)
5 Global Fracking Proppants Market Outlook, By Induced Hydraulic Fracturing (2020-2028) (US $MN)
6 Global Fracking Proppants Market Outlook, By Product (2020-2028) (US $MN)
7 Global Fracking Proppants Market Outlook, By Resin Coated Proppants (2020-2028) (US $MN)
8 Global Fracking Proppants Market Outlook, By Ceramic Proppants (2020-2028) (US $MN)
9 Global Fracking Proppants Market Outlook, By Frac Sand (2020-2028) (US $MN)
10 Global Fracking Proppants Market Outlook, By Application (2020-2028) (US $MN)
11 Global Fracking Proppants Market Outlook, By Coal Bed Methane (2020-2028) (US $MN)
12 Global Fracking Proppants Market Outlook, By Tight Gas (2020-2028) (US $MN)
13 Global Fracking Proppants Market Outlook, By Shale Gas (2020-2028) (US $MN)
14 Global Fracking Proppants Market Outlook, By Other Applications (2020-2028) (US $MN)
15 North America Fracking Proppants Market Outlook, By Country (2020-2028) (US $MN)
16 North America Fracking Proppants Market Outlook, By Fracturing Technology (2020-2028) (US $MN)
17 North America Fracking Proppants Market Outlook, By Natural Induced Hydraulic Fracturing (2020-2028) (US $MN)
18 North America Fracking Proppants Market Outlook, By Polylactic Acid Base Fiber Technology (2020-2028) (US $MN)
19 North America Fracking Proppants Market Outlook, By Induced Hydraulic Fracturing (2020-2028) (US $MN)
20 North America Fracking Proppants Market Outlook, By Product (2020-2028) (US $MN)
21 North America Fracking Proppants Market Outlook, By Resin Coated Proppants (2020-2028) (US $MN)
22 North America Fracking Proppants Market Outlook, By Ceramic Proppants (2020-2028) (US $MN)
23 North America Fracking Proppants Market Outlook, By Frac Sand (2020-2028) (US $MN)
24 North America Fracking Proppants Market Outlook, By Application (2020-2028) (US $MN)
25 North America Fracking Proppants Market Outlook, By Coal Bed Methane (2020-2028) (US $MN)
26 North America Fracking Proppants Market Outlook, By Tight Gas (2020-2028) (US $MN)
27 North America Fracking Proppants Market Outlook, By Shale Gas (2020-2028) (US $MN)
28 North America Fracking Proppants Market Outlook, By Other Applications (2020-2028) (US $MN)
29 Europe Fracking Proppants Market Outlook, By Country (2020-2028) (US $MN)
30 Europe Fracking Proppants Market Outlook, By Fracturing Technology (2020-2028) (US $MN)
31 Europe Fracking Proppants Market Outlook, By Natural Induced Hydraulic Fracturing (2020-2028) (US $MN)
32 Europe Fracking Proppants Market Outlook, By Polylactic Acid Base Fiber Technology (2020-2028) (US $MN)
33 Europe Fracking Proppants Market Outlook, By Induced Hydraulic Fracturing (2020-2028) (US $MN)
34 Europe Fracking Proppants Market Outlook, By Product (2020-2028) (US $MN)
35 Europe Fracking Proppants Market Outlook, By Resin Coated Proppants (2020-2028) (US $MN)
36 Europe Fracking Proppants Market Outlook, By Ceramic Proppants (2020-2028) (US $MN)
37 Europe Fracking Proppants Market Outlook, By Frac Sand (2020-2028) (US $MN)
38 Europe Fracking Proppants Market Outlook, By Application (2020-2028) (US $MN)
39 Europe Fracking Proppants Market Outlook, By Coal Bed Methane (2020-2028) (US $MN)
40 Europe Fracking Proppants Market Outlook, By Tight Gas (2020-2028) (US $MN)
41 Europe Fracking Proppants Market Outlook, By Shale Gas (2020-2028) (US $MN)
42 Europe Fracking Proppants Market Outlook, By Other Applications (2020-2028) (US $MN)
43 Asia Pacific Fracking Proppants Market Outlook, By Country (2020-2028) (US $MN)
44 Asia Pacific Fracking Proppants Market Outlook, By Fracturing Technology (2020-2028) (US $MN)
45 Asia Pacific Fracking Proppants Market Outlook, By Natural Induced Hydraulic Fracturing (2020-2028) (US $MN)
46 Asia Pacific Fracking Proppants Market Outlook, By Polylactic Acid Base Fiber Technology (2020-2028) (US $MN)
47 Asia Pacific Fracking Proppants Market Outlook, By Induced Hydraulic Fracturing (2020-2028) (US $MN)
48 Asia Pacific Fracking Proppants Market Outlook, By Product (2020-2028) (US $MN)
49 Asia Pacific Fracking Proppants Market Outlook, By Resin Coated Proppants (2020-2028) (US $MN)
50 Asia Pacific Fracking Proppants Market Outlook, By Ceramic Proppants (2020-2028) (US $MN)
51 Asia Pacific Fracking Proppants Market Outlook, By Frac Sand (2020-2028) (US $MN)
52 Asia Pacific Fracking Proppants Market Outlook, By Application (2020-2028) (US $MN)
53 Asia Pacific Fracking Proppants Market Outlook, By Coal Bed Methane (2020-2028) (US $MN)
54 Asia Pacific Fracking Proppants Market Outlook, By Tight Gas (2020-2028) (US $MN)
55 Asia Pacific Fracking Proppants Market Outlook, By Shale Gas (2020-2028) (US $MN)
56 Asia Pacific Fracking Proppants Market Outlook, By Other Applications (2020-2028) (US $MN)
57 South America Fracking Proppants Market Outlook, By Country (2020-2028) (US $MN)
58 South America Fracking Proppants Market Outlook, By Fracturing Technology (2020-2028) (US $MN)
59 South America Fracking Proppants Market Outlook, By Natural Induced Hydraulic Fracturing (2020-2028) (US $MN)
60 South America Fracking Proppants Market Outlook, By Polylactic Acid Base Fiber Technology (2020-2028) (US $MN)
61 South America Fracking Proppants Market Outlook, By Induced Hydraulic Fracturing (2020-2028) (US $MN)
62 South America Fracking Proppants Market Outlook, By Product (2020-2028) (US $MN)
63 South America Fracking Proppants Market Outlook, By Resin Coated Proppants (2020-2028) (US $MN)
64 South America Fracking Proppants Market Outlook, By Ceramic Proppants (2020-2028) (US $MN)
65 South America Fracking Proppants Market Outlook, By Frac Sand (2020-2028) (US $MN)
66 South America Fracking Proppants Market Outlook, By Application (2020-2028) (US $MN)
67 South America Fracking Proppants Market Outlook, By Coal Bed Methane (2020-2028) (US $MN)
68 South America Fracking Proppants Market Outlook, By Tight Gas (2020-2028) (US $MN)
69 South America Fracking Proppants Market Outlook, By Shale Gas (2020-2028) (US $MN)
70 South America Fracking Proppants Market Outlook, By Other Applications (2020-2028) (US $MN)
71 Middle East & Africa Fracking Proppants Market Outlook, By Country (2020-2028) (US $MN)
72 Middle East & Africa Fracking Proppants Market Outlook, By Fracturing Technology (2020-2028) (US $MN)
73 Middle East & Africa Fracking Proppants Market Outlook, By Natural Induced Hydraulic Fracturing (2020-2028) (US $MN)
74 Middle East & Africa Fracking Proppants Market Outlook, By Polylactic Acid Base Fiber Technology (2020-2028) (US $MN)
75 Middle East & Africa Fracking Proppants Market Outlook, By Induced Hydraulic Fracturing (2020-2028) (US $MN)
76 Middle East & Africa Fracking Proppants Market Outlook, By Product (2020-2028) (US $MN)
77 Middle East & Africa Fracking Proppants Market Outlook, By Resin Coated Proppants (2020-2028) (US $MN)
78 Middle East & Africa Fracking Proppants Market Outlook, By Ceramic Proppants (2020-2028) (US $MN)
79 Middle East & Africa Fracking Proppants Market Outlook, By Frac Sand (2020-2028) (US $MN)
80 Middle East & Africa Fracking Proppants Market Outlook, By Application (2020-2028) (US $MN)
81 Middle East & Africa Fracking Proppants Market Outlook, By Coal Bed Methane (2020-2028) (US $MN)
82 Middle East & Africa Fracking Proppants Market Outlook, By Tight Gas (2020-2028) (US $MN)
83 Middle East & Africa Fracking Proppants Market Outlook, By Shale Gas (2020-2028) (US $MN)
84 Middle East & Africa Fracking Proppants Market Outlook, By Other Applications (2020-2028) (US $MN)
List of Figures
RESEARCH METHODOLOGY

We at ‘Stratistics’ opt for an extensive research approach which involves data mining, data validation, and data analysis. The various research sources include in-house repository, secondary research, competitor’s sources, social media research, client internal data, and primary research.
Our team of analysts prefers the most reliable and authenticated data sources in order to perform the comprehensive literature search. With access to most of the authenticated data bases our team highly considers the best mix of information through various sources to obtain extensive and accurate analysis.
Each report takes an average time of a month and a team of 4 industry analysts. The time may vary depending on the scope and data availability of the desired market report. The various parameters used in the market assessment are standardized in order to enhance the data accuracy.
Data Mining
The data is collected from several authenticated, reliable, paid and unpaid sources and is filtered depending on the scope & objective of the research. Our reports repository acts as an added advantage in this procedure. Data gathering from the raw material suppliers, distributors and the manufacturers is performed on a regular basis, this helps in the comprehensive understanding of the products value chain. Apart from the above mentioned sources the data is also collected from the industry consultants to ensure the objective of the study is in the right direction.
Market trends such as technological advancements, regulatory affairs, market dynamics (Drivers, Restraints, Opportunities and Challenges) are obtained from scientific journals, market related national & international associations and organizations.
Data Analysis
From the data that is collected depending on the scope & objective of the research the data is subjected for the analysis. The critical steps that we follow for the data analysis include:
- Product Lifecycle Analysis
- Competitor analysis
- Risk analysis
- Porters Analysis
- PESTEL Analysis
- SWOT Analysis
The data engineering is performed by the core industry experts considering both the Marketing Mix Modeling and the Demand Forecasting. The marketing mix modeling makes use of multiple-regression techniques to predict the optimal mix of marketing variables. Regression factor is based on a number of variables and how they relate to an outcome such as sales or profits.
Data Validation
The data validation is performed by the exhaustive primary research from the expert interviews. This includes telephonic interviews, focus groups, face to face interviews, and questionnaires to validate our research from all aspects. The industry experts we approach come from the leading firms, involved in the supply chain ranging from the suppliers, distributors to the manufacturers and consumers so as to ensure an unbiased analysis.
We are in touch with more than 15,000 industry experts with the right mix of consultants, CEO's, presidents, vice presidents, managers, experts from both supply side and demand side, executives and so on.
The data validation involves the primary research from the industry experts belonging to:
- Leading Companies
- Suppliers & Distributors
- Manufacturers
- Consumers
- Industry/Strategic Consultants
Apart from the data validation the primary research also helps in performing the fill gap research, i.e. providing solutions for the unmet needs of the research which helps in enhancing the reports quality.
For more details about research methodology, kindly write to us at info@strategymrc.com
Frequently Asked Questions
In case of any queries regarding this report, you can contact the customer service by filing the “Inquiry Before Buy” form available on the right hand side. You may also contact us through email: info@strategymrc.com or phone: +1-301-202-5929
Yes, the samples are available for all the published reports. You can request them by filling the “Request Sample” option available in this page.
Yes, you can request a sample with your specific requirements. All the customized samples will be provided as per the requirement with the real data masked.
All our reports are available in Digital PDF format. In case if you require them in any other formats, such as PPT, Excel etc you can submit a request through “Inquiry Before Buy” form available on the right hand side. You may also contact us through email: info@strategymrc.com or phone: +1-301-202-5929
We offer a free 15% customization with every purchase. This requirement can be fulfilled for both pre and post sale. You may send your customization requirements through email at info@strategymrc.com or call us on +1-301-202-5929.
We have 3 different licensing options available in electronic format.
- Single User Licence: Allows one person, typically the buyer, to have access to the ordered product. The ordered product cannot be distributed to anyone else.
- 2-5 User Licence: Allows the ordered product to be shared among a maximum of 5 people within your organisation.
- Corporate License: Allows the product to be shared among all employees of your organisation regardless of their geographical location.
All our reports are typically be emailed to you as an attachment.
To order any available report you need to register on our website. The payment can be made either through CCAvenue or PayPal payments gateways which accept all international cards.
We extend our support to 6 months post sale. A post sale customization is also provided to cover your unmet needs in the report.
Request Customization
We provide a free 15% customization on every purchase. This requirement can be fulfilled for both pre and post sale. You may send your customization requirements through email at info@strategymrc.com or call us on +1-301-202-5929.
Note: This customization is absolutely free until it falls under the 15% bracket. If your requirement exceeds this a feasibility check will be performed. Post that, a quote will be provided along with the timelines.
WHY CHOOSE US ?

Assured Quality
Best in class reports with high standard of research integrity

24X7 Research Support
Continuous support to ensure the best customer experience.

Free Customization
Adding more values to your product of interest.

Safe & Secure Access
Providing a secured environment for all online transactions.

Trusted by 600+ Brands
Serving the most reputed brands across the world.