
G Meter Market
G Meter Market Forecasts to 2030 - Global Analysis By Product (MEMS G Meter, Piezoelectric G Meter, Analog G Meter, Digital G Meter and Other Products), Application (Consumer Electronics, Military Aircrafts, Civil Aircrafts, Automotive and Healthcare) and By Geography

|
Years Covered |
2021-2030 |
|
Estimated Year Value (2023) |
US $6.65 BN |
|
Projected Year Value (2030) |
US $12.26 BN |
|
CAGR (2023 - 2030) |
9.13% |
|
Regions Covered |
North America, Europe, Asia Pacific, South America, and Middle East & Africa |
|
Countries Covered |
US, Canada, Mexico, Germany, UK, Italy, France, Spain, Japan, China, India, Australia, New Zealand, South Korea, Rest of Asia Pacific, South America, Argentina, Brazil, Chile, Middle East & Africa, Saudi Arabia, UAE, Qatar, and South Africa |
|
Largest Market |
North America |
|
Highest Growing Market |
Asia Pacific |
According to Stratistics MRC, the Global G Meters Market is accounted for $6.65 billion in 2023 and is expected to reach $12.26 billion by 2030 growing at a CAGR of 9.13% during the forecast period. An electromechanical tool called a "G meter" is used to quantify static or dynamic acceleration forces. A common name for them is an accelerometer. Capacitive plate movement between each other is used to calculate the acceleration. G meters are also used to measure how quickly an object can change direction within a predetermined amount of time. Piezoelectric effect and capacitance sensing are two methods by which accelerometers can operate. The piezoelectricity was measured using G meters as well. Depending on the kind of interface the developer uses these meters per second-square or in G-forces as their units of measurement. They are capable of measuring accelerations along one, two, or three axes. There are three different kinds of G meters: MEMS, piezoelectric, and piezoresistive.
According to the National Highway Traffic Safety Administration (NHTSA), the use of g-meters in vehicle testing and analysis can provide important data on the forces and stresses experienced by a vehicle and its occupants, helping to improve safety and reduce the risk of accidents and injuries. NHTSA recommends the use of g-meters in testing and analysis of vehicle safety systems and designs.
Market Dynamics:
Driver:
Enhanced driving performance
The global G Meters market expected to drive growth during the forecast period. G-meters can yield a lot of information on the forces that a vehicle encounters during acceleration, braking, and cornering. The design and functionality of a vehicle can be improved in a number of ways using this data. G-meter data, for instance, can be utilized to optimize the suspension settings, modify the aerodynamics, or choose the optimum tires for a specific driving situation. Engineers can enhance the handling, stability, and general performance of a vehicle by making changes based on g-meter data.
Restraint:
Expensive maintenance costs
The global G Meters market expected to hinder growth during the forecast period. One of the biggest obstacles to the market's growth is the high expense of maintaining G meters as load variables on the body increase. G-meters can be costly to buy and install in a car, especially if they are high-precision tools made for professional testing or racing. Because of this, they could be out of reach for some users, especially those on a restricted budget or who do not need the high level of precision that expensive g-meters can deliver.
Opportunity:
Training and development for drivers
The global G Meters market expected to drive growth during the forecast period. G-meters can be a useful tool for developing and teaching drivers. Drivers can learn to adjust their driving style for best performance and safety by keeping track of the g-forces felt throughout various driving manoeuvres. A g-meter, for instance, can help a driver determine how much lateral or longitudinal force they can withstand through a specific turn and then concentrate on refining their technique to lessen the amount of force felt. The performance of several drivers can also be compared using G-meters, allowing for more focused training and advancement.
Threat:
Insufficient utility for driving on a daily basis
The global G Meters market expected to hamper growth during the forecast period. G-meters are important for testing, racing, and driver training; however, they might not be very helpful for regular driving. Normal driving conditions often include g-forces that are considerably below the upper limits of what most vehicles and drivers can tolerate; therefore, the data a g-meter provides may not be very helpful under these circumstances. The data provided by some g-meters may also need specialized software or tools to be analyzed, which can further reduce its value for regular drivers.
Covid-19 Impact:
Due to the COVID pandemic's severe effects on the automotive industry, the market was significantly impacted. Additionally, the mechanical automation sector's production capacities have decreased as a result of the strict lockdown conditions. A crucial supportive factor that is anticipated to restrain the market's growth is the lack of supply to inventories around the world as a result of transportation and shipment failures during the pandemic. Moreover, Due to increased manufacturing by major market players and the rescheduling of shipments halted during the pandemic period toward inventories and distributors around the world, factors such as the reopening of G Meter production facilities post-pandemic and the restoration of transportation capabilities are expected to propel market growth during the forecast period.
The MEMS g meter segment is expected to be the largest during the forecast period
The MEMS G Meter segment is expected to have a largest share over the forecast period. The MEMS G Meter is a tool used for irrigation that measures the amount of water in the soil. It utilizes two platinum electrodes connected by a stainless steel meshwork and operates on an electrochemical principle. As water percolates through the soil to reach the meter, an electrical current is created by the flow of electricity between the electrodes and is measured. A significant factor supporting the segment's growth over the projection period is the growing influence of G meters over MEMS-driven systems like rovers, micro-drones, and military applications in emerging economies.
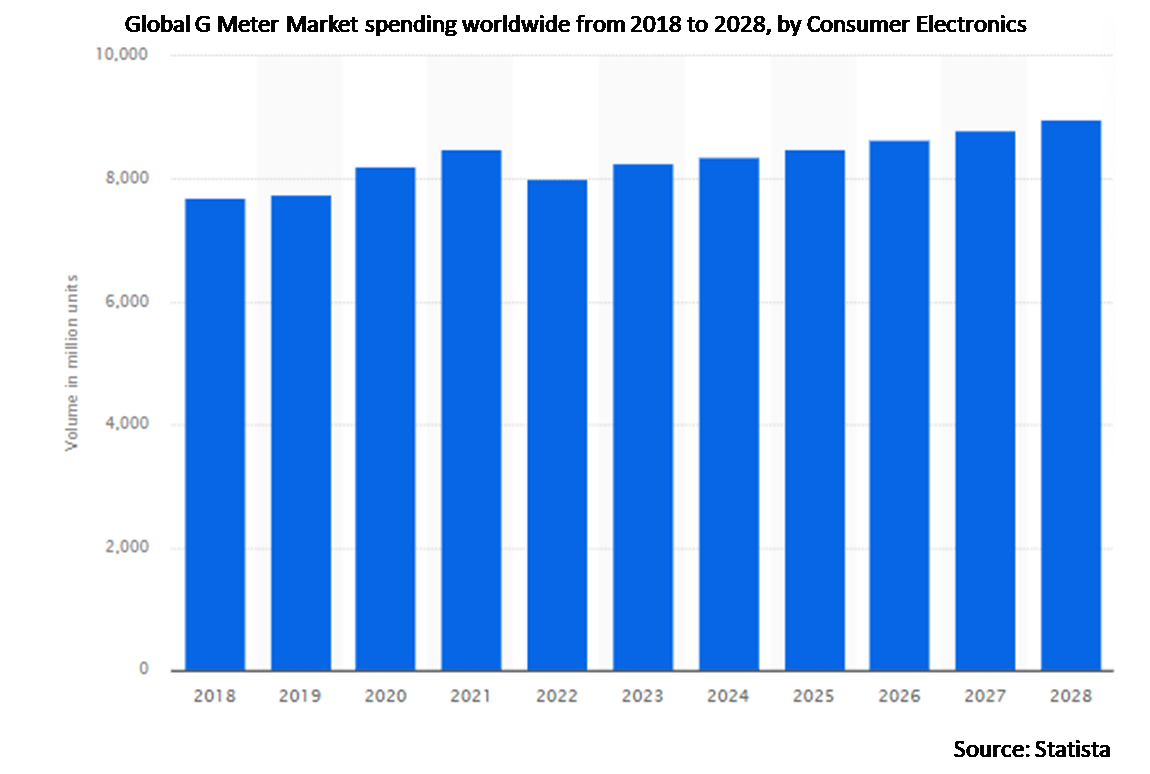
The Consumer electronics segment is expected to have the highest CAGR during the forecast period
The Consumer electronics segment is anticipated to witness the fastest CAGR growth during the forecast period. The growing prevalence of geophones in smartphones has increased the demand for precise gravimetry instruments that are sensitive enough not to be affected by accidental drops or shakes. In comparison to MEMS devices, which measure mass more precisely than piezoresistive devices, piezoelectric g-meters are more affordable and easier to use, which has led to their significant adoption.
Region with largest share:
The North America region market is estimated to witness a largest share of the global G Meters market during the forecast period. A significant factor driving market expansion is the exponential rise of digital G meters in the area. Additionally, manufacturers' growing interest in R&D for G-meter production is a crucial factor expected to drive the market forward. In addition, the region's diverse use of G meters in industries like aerospace, transportation, and defense is a factor in the market's expansion.
Region with highest CAGR:
Asia-Pacific is most likely to experience the fastest growth during the forecast period. The gradual adoption of novel products in the automotive industry by the region is credited with driving market growth in the area. Manufacturers are mainly concentrating on the adoption of speed calculation technologies in passenger cars and commercial vehicles, with China dominating the market and being followed by India and Japan. Due to rising foreign investment and supportive government industrialization policies in a variety of industries, including manufacturing, construction, energy and utilities, among others, Asia Pacific has been experiencing rapid economic growth.

Key players in the market
Some of the key players in G Meters market include Al Cielo, Duotech, Falcon Gauge, Flight Data Systems, Grand Rapids Technologies , Honeywell International., Inc., Kearfott, KVH Industries, Meggitt, Murata Manufacturing , Northrop Grumman, NXP Semiconductors, Robert Bosch, Rockwell Automation , Safran Colibrys, STMicroelectronics, TDK Corp, Turnkey Instruments and Vans Aircraft.
Key Developments:
In February 2023, KVH Industries, Inc, today announced that it has entered into a support agreement with Black Diamond Capital Management, L.L.C. and certain of its affiliates.
In February 2023, The Technology M&A and Activism and Takeover Defense teams advised KVH Industries, Inc. (Nasdaq: KVHI) and its Board of Directors in connection with its definitive cooperation agreement with Black Diamond Capital Management, L.L.C. and certain of its affiliates.
In February 2022, Honeywell India’s philanthropic arm, Honeywell Hometown Solutions India Foundation (HHSIF), and the Indian Institute of Science’s Society for Innovation and Development (SID) have extended their partnership to support 13 new startups to promote deep science research and development (R&D) and local innovation.
Products Covered:
• MEMS G Meter
• Piezoelectric G Meter
• Analog G Meters
• Digital G Meters
• Piezoresistive G Meter
• Other Products
Applications Covered:
• Consumer Electronics
• Military Aircrafts
• Civil Aircrafts
• Automotive
• Healthcare
• General Industrial
• Other Applications
Regions Covered:
• North America
o US
o Canada
o Mexico
• Europe
o Germany
o UK
o Italy
o France
o Spain
o Rest of Europe
• Asia Pacific
o Japan
o China
o India
o Australia
o New Zealand
o South Korea
o Rest of Asia Pacific
• South America
o Argentina
o Brazil
o Chile
o Rest of South America
• Middle East & Africa
o Saudi Arabia
o UAE
o Qatar
o South Africa
o Rest of Middle East & Africa
What our report offers:
- Market share assessments for the regional and country-level segments
- Strategic recommendations for the new entrants
- Covers Market data for the years 2021, 2022, 2023, 2026, and 2030
- Market Trends (Drivers, Constraints, Opportunities, Threats, Challenges, Investment Opportunities, and recommendations)
- Strategic recommendations in key business segments based on the market estimations
- Competitive landscaping mapping the key common trends
- Company profiling with detailed strategies, financials, and recent developments
- Supply chain trends mapping the latest technological advancements
Free Customization Offerings:
All the customers of this report will be entitled to receive one of the following free customization options:
• Company Profiling
o Comprehensive profiling of additional market players (up to 3)
o SWOT Analysis of key players (up to 3)
• Regional Segmentation
o Market estimations, Forecasts and CAGR of any prominent country as per the client's interest (Note: Depends on feasibility check)
• Competitive Benchmarking
Benchmarking of key players based on product portfolio, geographical presence, and strategic alliances
Table of Contents
1 Executive Summary
2 Preface
2.1 Abstract
2.2 Stake Holders
2.3 Research Scope
2.4 Research Methodology
2.4.1 Data Mining
2.4.2 Data Analysis
2.4.3 Data Validation
2.4.4 Research Approach
2.5 Research Sources
2.5.1 Primary Research Sources
2.5.2 Secondary Research Sources
2.5.3 Assumptions
3 Market Trend Analysis
3.1 Introduction
3.2 Drivers
3.3 Restraints
3.4 Opportunities
3.5 Threats
3.6 Product Analysis
3.7 Application Analysis
3.8 Emerging Markets
3.9 Impact of Covid-19
4 Porters Five Force Analysis
4.1 Bargaining power of suppliers
4.2 Bargaining power of buyers
4.3 Threat of substitutes
4.4 Threat of new entrants
4.5 Competitive rivalry
5 Global G Meter Market, By Product
5.1 Introduction
5.2 MEMS G Meter
5.3 Piezoelectric G Meter
5.4 Analog G Meter
5.5 Digital G Meter
5.6 Piezoresistive G Meter
5.7 Other Products
6 Global G Meter Market, By Application
6.1 Introduction
6.2 Consumer Electronics
6.3 Military Aircrafts
6.4 Civil Aircrafts
6.5 Automotive
6.6 Healthcare
6.7 General Industrial
6.8 Other Applications
7 Global G Meter Market, By Geography
7.1 Introduction
7.2 North America
7.2.1 US
7.2.2 Canada
7.2.3 Mexico
7.3 Europe
7.3.1 Germany
7.3.2 UK
7.3.3 Italy
7.3.4 France
7.3.5 Spain
7.3.6 Rest of Europe
7.4 Asia Pacific
7.4.1 Japan
7.4.2 China
7.4.3 India
7.4.4 Australia
7.4.5 New Zealand
7.4.6 South Korea
7.4.7 Rest of Asia Pacific
7.5 South America
7.5.1 Argentina
7.5.2 Brazil
7.5.3 Chile
7.5.4 Rest of South America
7.6 Middle East & Africa
7.6.1 Saudi Arabia
7.6.2 UAE
7.6.3 Qatar
7.6.4 South Africa
7.6.5 Rest of Middle East & Africa
8 Key Developments
8.1 Agreements, Partnerships, Collaborations and Joint Ventures
8.2 Acquisitions & Mergers
8.3 New Product Launch
8.4 Expansions
8.5 Other Key Strategies
9 Company Profiling
9.1 Al Cielo
9.2 Duotech
9.3 Falcon Gauge
9.4 Flight Data Systems
9.5 Grand Rapids Technologies
9.6 Honeywell International., Inc.
9.7 Kearfott
9.8 KVH Industries
9.9 Meggitt
9.10 Murata Manufacturing
9.11 Northrop Grumman
9.12 NXP Semiconductors
9.13 Robert Bosch
9.14 Rockwell Automation
9.15 Safran Colibrys
9.16 STMicroelectronics
9.17 TDK Corp
9.18 Turnkey Instruments
9.19 Vans Aircraft
List of Tables
1 Global G Meter Market Outlook, By Region (2021-2030) ($MN)
2 Global G Meter Market Outlook, By Product (2021-2030) ($MN)
3 Global G Meter Market Outlook, By MEMS G Meter (2021-2030) ($MN)
4 Global G Meter Market Outlook, By Piezoelectric G Meter (2021-2030) ($MN)
5 Global G Meter Market Outlook, By Analog G Meter (2021-2030) ($MN)
6 Global G Meter Market Outlook, By Digital G Meter (2021-2030) ($MN)
7 Global G Meter Market Outlook, By Piezoresistive G Meter (2021-2030) ($MN)
8 Global G Meter Market Outlook, By Other Products (2021-2030) ($MN)
9 Global G Meter Market Outlook, By Application (2021-2030) ($MN)
10 Global G Meter Market Outlook, By Consumer Electronics (2021-2030) ($MN)
11 Global G Meter Market Outlook, By Military Aircrafts (2021-2030) ($MN)
12 Global G Meter Market Outlook, By Civil Aircrafts (2021-2030) ($MN)
13 Global G Meter Market Outlook, By Automotive (2021-2030) ($MN)
14 Global G Meter Market Outlook, By Healthcare (2021-2030) ($MN)
15 Global G Meter Market Outlook, By General Industrial (2021-2030) ($MN)
16 Global G Meter Market Outlook, By Other Applications (2021-2030) ($MN)
17 North America G Meter Market Outlook, By Country (2021-2030) ($MN)
18 North America G Meter Market Outlook, By Product (2021-2030) ($MN)
19 North America G Meter Market Outlook, By MEMS G Meter (2021-2030) ($MN)
20 North America G Meter Market Outlook, By Piezoelectric G Meter (2021-2030) ($MN)
21 North America G Meter Market Outlook, By Analog G Meter (2021-2030) ($MN)
22 North America G Meter Market Outlook, By Digital G Meter (2021-2030) ($MN)
23 North America G Meter Market Outlook, By Piezoresistive G Meter (2021-2030) ($MN)
24 North America G Meter Market Outlook, By Other Products (2021-2030) ($MN)
25 North America G Meter Market Outlook, By Application (2021-2030) ($MN)
26 North America G Meter Market Outlook, By Consumer Electronics (2021-2030) ($MN)
27 North America G Meter Market Outlook, By Military Aircrafts (2021-2030) ($MN)
28 North America G Meter Market Outlook, By Civil Aircrafts (2021-2030) ($MN)
29 North America G Meter Market Outlook, By Automotive (2021-2030) ($MN)
30 North America G Meter Market Outlook, By Healthcare (2021-2030) ($MN)
31 North America G Meter Market Outlook, By General Industrial (2021-2030) ($MN)
32 North America G Meter Market Outlook, By Other Applications (2021-2030) ($MN)
33 Europe G Meter Market Outlook, By Country (2021-2030) ($MN)
34 Europe G Meter Market Outlook, By Product (2021-2030) ($MN)
35 Europe G Meter Market Outlook, By MEMS G Meter (2021-2030) ($MN)
36 Europe G Meter Market Outlook, By Piezoelectric G Meter (2021-2030) ($MN)
37 Europe G Meter Market Outlook, By Analog G Meter (2021-2030) ($MN)
38 Europe G Meter Market Outlook, By Digital G Meter (2021-2030) ($MN)
39 Europe G Meter Market Outlook, By Piezoresistive G Meter (2021-2030) ($MN)
40 Europe G Meter Market Outlook, By Other Products (2021-2030) ($MN)
41 Europe G Meter Market Outlook, By Application (2021-2030) ($MN)
42 Europe G Meter Market Outlook, By Consumer Electronics (2021-2030) ($MN)
43 Europe G Meter Market Outlook, By Military Aircrafts (2021-2030) ($MN)
44 Europe G Meter Market Outlook, By Civil Aircrafts (2021-2030) ($MN)
45 Europe G Meter Market Outlook, By Automotive (2021-2030) ($MN)
46 Europe G Meter Market Outlook, By Healthcare (2021-2030) ($MN)
47 Europe G Meter Market Outlook, By General Industrial (2021-2030) ($MN)
48 Europe G Meter Market Outlook, By Other Applications (2021-2030) ($MN)
49 Asia Pacific G Meter Market Outlook, By Country (2021-2030) ($MN)
50 Asia Pacific G Meter Market Outlook, By Product (2021-2030) ($MN)
51 Asia Pacific G Meter Market Outlook, By MEMS G Meter (2021-2030) ($MN)
52 Asia Pacific G Meter Market Outlook, By Piezoelectric G Meter (2021-2030) ($MN)
53 Asia Pacific G Meter Market Outlook, By Analog G Meter (2021-2030) ($MN)
54 Asia Pacific G Meter Market Outlook, By Digital G Meter (2021-2030) ($MN)
55 Asia Pacific G Meter Market Outlook, By Piezoresistive G Meter (2021-2030) ($MN)
56 Asia Pacific G Meter Market Outlook, By Other Products (2021-2030) ($MN)
57 Asia Pacific G Meter Market Outlook, By Application (2021-2030) ($MN)
58 Asia Pacific G Meter Market Outlook, By Consumer Electronics (2021-2030) ($MN)
59 Asia Pacific G Meter Market Outlook, By Military Aircrafts (2021-2030) ($MN)
60 Asia Pacific G Meter Market Outlook, By Civil Aircrafts (2021-2030) ($MN)
61 Asia Pacific G Meter Market Outlook, By Automotive (2021-2030) ($MN)
62 Asia Pacific G Meter Market Outlook, By Healthcare (2021-2030) ($MN)
63 Asia Pacific G Meter Market Outlook, By General Industrial (2021-2030) ($MN)
64 Asia Pacific G Meter Market Outlook, By Other Applications (2021-2030) ($MN)
65 South America G Meter Market Outlook, By Country (2021-2030) ($MN)
66 South America G Meter Market Outlook, By Product (2021-2030) ($MN)
67 South America G Meter Market Outlook, By MEMS G Meter (2021-2030) ($MN)
68 South America G Meter Market Outlook, By Piezoelectric G Meter (2021-2030) ($MN)
69 South America G Meter Market Outlook, By Analog G Meter (2021-2030) ($MN)
70 South America G Meter Market Outlook, By Digital G Meter (2021-2030) ($MN)
71 South America G Meter Market Outlook, By Piezoresistive G Meter (2021-2030) ($MN)
72 South America G Meter Market Outlook, By Other Products (2021-2030) ($MN)
73 South America G Meter Market Outlook, By Application (2021-2030) ($MN)
74 South America G Meter Market Outlook, By Consumer Electronics (2021-2030) ($MN)
75 South America G Meter Market Outlook, By Military Aircrafts (2021-2030) ($MN)
76 South America G Meter Market Outlook, By Civil Aircrafts (2021-2030) ($MN)
77 South America G Meter Market Outlook, By Automotive (2021-2030) ($MN)
78 South America G Meter Market Outlook, By Healthcare (2021-2030) ($MN)
79 South America G Meter Market Outlook, By General Industrial (2021-2030) ($MN)
80 South America G Meter Market Outlook, By Other Applications (2021-2030) ($MN)
81 Middle East & Africa G Meter Market Outlook, By Country (2021-2030) ($MN)
82 Middle East & Africa G Meter Market Outlook, By Product (2021-2030) ($MN)
83 Middle East & Africa G Meter Market Outlook, By MEMS G Meter (2021-2030) ($MN)
84 Middle East & Africa G Meter Market Outlook, By Piezoelectric G Meter (2021-2030) ($MN)
85 Middle East & Africa G Meter Market Outlook, By Analog G Meter (2021-2030) ($MN)
86 Middle East & Africa G Meter Market Outlook, By Digital G Meter (2021-2030) ($MN)
87 Middle East & Africa G Meter Market Outlook, By Piezoresistive G Meter (2021-2030) ($MN)
88 Middle East & Africa G Meter Market Outlook, By Other Products (2021-2030) ($MN)
89 Middle East & Africa G Meter Market Outlook, By Application (2021-2030) ($MN)
90 Middle East & Africa G Meter Market Outlook, By Consumer Electronics (2021-2030) ($MN)
91 Middle East & Africa G Meter Market Outlook, By Military Aircrafts (2021-2030) ($MN)
92 Middle East & Africa G Meter Market Outlook, By Civil Aircrafts (2021-2030) ($MN)
93 Middle East & Africa G Meter Market Outlook, By Automotive (2021-2030) ($MN)
94 Middle East & Africa G Meter Market Outlook, By Healthcare (2021-2030) ($MN)
95 Middle East & Africa G Meter Market Outlook, By General Industrial (2021-2030) ($MN)
96 Middle East & Africa G Meter Market Outlook, By Other Applications (2021-2030) ($MN)
List of Figures
RESEARCH METHODOLOGY

We at ‘Stratistics’ opt for an extensive research approach which involves data mining, data validation, and data analysis. The various research sources include in-house repository, secondary research, competitor’s sources, social media research, client internal data, and primary research.
Our team of analysts prefers the most reliable and authenticated data sources in order to perform the comprehensive literature search. With access to most of the authenticated data bases our team highly considers the best mix of information through various sources to obtain extensive and accurate analysis.
Each report takes an average time of a month and a team of 4 industry analysts. The time may vary depending on the scope and data availability of the desired market report. The various parameters used in the market assessment are standardized in order to enhance the data accuracy.
Data Mining
The data is collected from several authenticated, reliable, paid and unpaid sources and is filtered depending on the scope & objective of the research. Our reports repository acts as an added advantage in this procedure. Data gathering from the raw material suppliers, distributors and the manufacturers is performed on a regular basis, this helps in the comprehensive understanding of the products value chain. Apart from the above mentioned sources the data is also collected from the industry consultants to ensure the objective of the study is in the right direction.
Market trends such as technological advancements, regulatory affairs, market dynamics (Drivers, Restraints, Opportunities and Challenges) are obtained from scientific journals, market related national & international associations and organizations.
Data Analysis
From the data that is collected depending on the scope & objective of the research the data is subjected for the analysis. The critical steps that we follow for the data analysis include:
- Product Lifecycle Analysis
- Competitor analysis
- Risk analysis
- Porters Analysis
- PESTEL Analysis
- SWOT Analysis
The data engineering is performed by the core industry experts considering both the Marketing Mix Modeling and the Demand Forecasting. The marketing mix modeling makes use of multiple-regression techniques to predict the optimal mix of marketing variables. Regression factor is based on a number of variables and how they relate to an outcome such as sales or profits.
Data Validation
The data validation is performed by the exhaustive primary research from the expert interviews. This includes telephonic interviews, focus groups, face to face interviews, and questionnaires to validate our research from all aspects. The industry experts we approach come from the leading firms, involved in the supply chain ranging from the suppliers, distributors to the manufacturers and consumers so as to ensure an unbiased analysis.
We are in touch with more than 15,000 industry experts with the right mix of consultants, CEO's, presidents, vice presidents, managers, experts from both supply side and demand side, executives and so on.
The data validation involves the primary research from the industry experts belonging to:
- Leading Companies
- Suppliers & Distributors
- Manufacturers
- Consumers
- Industry/Strategic Consultants
Apart from the data validation the primary research also helps in performing the fill gap research, i.e. providing solutions for the unmet needs of the research which helps in enhancing the reports quality.
For more details about research methodology, kindly write to us at info@strategymrc.com
Frequently Asked Questions
In case of any queries regarding this report, you can contact the customer service by filing the “Inquiry Before Buy” form available on the right hand side. You may also contact us through email: info@strategymrc.com or phone: +1-301-202-5929
Yes, the samples are available for all the published reports. You can request them by filling the “Request Sample” option available in this page.
Yes, you can request a sample with your specific requirements. All the customized samples will be provided as per the requirement with the real data masked.
All our reports are available in Digital PDF format. In case if you require them in any other formats, such as PPT, Excel etc you can submit a request through “Inquiry Before Buy” form available on the right hand side. You may also contact us through email: info@strategymrc.com or phone: +1-301-202-5929
We offer a free 15% customization with every purchase. This requirement can be fulfilled for both pre and post sale. You may send your customization requirements through email at info@strategymrc.com or call us on +1-301-202-5929.
We have 3 different licensing options available in electronic format.
- Single User Licence: Allows one person, typically the buyer, to have access to the ordered product. The ordered product cannot be distributed to anyone else.
- 2-5 User Licence: Allows the ordered product to be shared among a maximum of 5 people within your organisation.
- Corporate License: Allows the product to be shared among all employees of your organisation regardless of their geographical location.
All our reports are typically be emailed to you as an attachment.
To order any available report you need to register on our website. The payment can be made either through CCAvenue or PayPal payments gateways which accept all international cards.
We extend our support to 6 months post sale. A post sale customization is also provided to cover your unmet needs in the report.
Request Customization
We offer complimentary customization of up to 15% with every purchase. To share your customization requirements, feel free to email us at info@strategymrc.com or call us on +1-301-202-5929. .
Please Note: Customization within the 15% threshold is entirely free of charge. If your request exceeds this limit, we will conduct a feasibility assessment. Following that, a detailed quote and timeline will be provided.
WHY CHOOSE US ?

Assured Quality
Best in class reports with high standard of research integrity

24X7 Research Support
Continuous support to ensure the best customer experience.

Free Customization
Adding more values to your product of interest.

Safe & Secure Access
Providing a secured environment for all online transactions.

Trusted by 600+ Brands
Serving the most reputed brands across the world.