Global Smart Sensor Technology Intelligence
Global Smart Sensor Technology Intelligence 2026 – Strategic Analysis of Technology Landscape, Innovation Trends, R&D Activities, Technology Roadmap, and Future Outlook
The Global Smart Sensor Technology Intelligence study provides an in-depth assessment of the technologies, smart sensing architectures, sensor technologies, embedded intelligence, signal processing, edge computing, artificial intelligence, connectivity, sensor fusion, technology maturity, development roadmaps, and commercialization pathways shaping the global smart sensor technology ecosystem.
Unlike conventional market studies centered primarily on market sizing, segmentation, and forecasts, this Technology Intelligence study focuses on how smart sensor technologies are evolving, which sensing platforms and architectures are gaining momentum, how mature they are, what technical barriers remain, and which innovations are most likely to progress toward commercial deployment.
The study evaluates smart temperature sensors, pressure sensors, motion and inertial sensors, optical sensors, image and vision sensors, proximity and position sensors, environmental sensors, chemical and gas sensors, force and tactile sensors, biosensors, MEMS-based sensors, and multi-modal sensor systems across their performance characteristics, Technology Readiness Levels (TRLs), manufacturing readiness, scalability, sensing accuracy, power efficiency, connectivity, intellectual property activity, R&D progress, application suitability, and commercialization potential.
Particular attention is given to the transition from conventional sensing components toward intelligent, connected, self-monitoring, edge-enabled, and AI-assisted sensing systems, helping organizations identify technology inflection points, emerging innovation areas, technical bottlenecks, and future technology opportunities.
Technology Intelligence Highlights
The study is designed to answer critical technology and innovation questions including:
• Which smart sensor technologies are advancing most rapidly?
• What are the current Technology Readiness Levels (TRLs) of major smart sensor platforms?
• Which technologies are closest to high-volume manufacturing and commercial deployment?
• How do different smart sensor technologies compare in terms of accuracy, sensitivity, response time, power consumption, reliability, miniaturization, and connectivity?
• What technical and engineering challenges are restricting wider commercialization?
• Which technologies are best suited to industrial automation, automotive systems, healthcare, consumer electronics, aerospace, environmental monitoring, and smart infrastructure?
• Where are the most significant R&D breakthroughs occurring?
• Which technology developers, semiconductor companies, research institutions, and innovation hubs are driving technology advancement?
• Which smart sensor technology domains are experiencing the strongest patent activity?
• What emerging technologies could potentially disrupt established sensor architectures?
• How are MEMS, nanomaterials, AI, edge computing, sensor fusion, wireless connectivity, and advanced packaging technologies evolving?
• What are the key research-to-commercialization pathways for emerging smart sensor technologies?
• Which technologies offer the strongest long-term commercialization potential?
• What technology and intellectual property white spaces remain underdeveloped?
• What are the likely technology development pathways over the next 5–10 years?
Key Technology Intelligence Deliverables
• Technology Landscape Mapping: Comprehensive assessment of established, advanced, and emerging smart sensor technologies, sensing architectures, platforms, materials, and enabling technologies.
• Technology Maturity & Readiness Assessment: Evaluation of Technology Readiness Levels (TRLs), manufacturing readiness, scalability, miniaturization, reliability, technical maturity, and commercialization readiness.
• Technology Performance Benchmarking: Comparative assessment based on sensitivity, accuracy, resolution, response time, power consumption, reliability, size, connectivity, environmental robustness, and application suitability.
• Technology Roadmap Intelligence: Analysis of near-, mid-, and long-term smart sensor development pathways, intelligent sensing, multi-modal sensing, edge intelligence, advanced materials, and anticipated technology milestones.
• R&D & Innovation Intelligence: Assessment of corporate R&D, university research, government programs, semiconductor research, technology collaborations, breakthroughs, and global innovation hotspots.
• Patent & IP Intelligence: Analysis of patent filing activity, leading sensor technology domains, high-impact patent families, emerging IP clusters, technology ownership, and potential IP white spaces.
• Application–Technology Mapping: Evaluation of smart sensor suitability for industrial automation, automotive, healthcare, consumer electronics, aerospace, robotics, environmental monitoring, smart buildings, and infrastructure.
• Commercialization Intelligence: Assessment of laboratory-to-pilot and pilot-to-commercial transitions, manufacturing scale-up, technology licensing, integration barriers, commercialization timelines, and cost-performance improvement pathways.
• Emerging Technology Tracking: Identification of AI-enabled sensors, neuromorphic sensing, flexible sensors, advanced MEMS, multi-modal sensing, sensor fusion, deep-tech startups, and technologies to watch.
• Technology White Space Analysis: Identification of unresolved sensing challenges, underserved sensor domains, technology convergence possibilities, and future R&D opportunities.
How This Study Differs from a Market Forecast Report
A conventional Market Forecast report primarily addresses how large the market is, how fast it is growing, which market segments are expanding, and which regions are expected to drive future demand.
The Technology Intelligence study addresses a fundamentally different set of questions: which smart sensor technologies are evolving, how mature they are, how their technical capabilities compare, what breakthroughs are occurring, what barriers remain to commercialization, and which technologies could shape the future of intelligent sensing.
Rather than concentrating on market size and revenue forecasts, the study emphasizes technology readiness, sensing architectures, sensor performance, MEMS, AI, edge intelligence, sensor fusion, connectivity, R&D progress, patents and intellectual property, innovation roadmaps, scalability, application suitability, and commercialization pathways.
The study is therefore intended for organizations requiring deeper technology, R&D, innovation, IP, engineering, and commercialization intelligence beyond conventional market sizing and forecasting.
Table of Contents
1 Executive Technology Brief
1.1 Smart Sensor Technology Intelligence Snapshot
1.2 Breakthrough Technologies & Key Developments
1.3 Technology Maturity Snapshot
1.4 Leading Smart Sensor Innovation Domains
1.5 Commercialization Readiness Highlights
1.6 Smart Sensor Technologies to Watch
2 Technology Intelligence Research Framework
2.1 Research Objectives
2.2 Technology Intelligence Methodology
2.3 Primary & Secondary Data Sources
2.4 Technology Assessment Framework
2.5 Technology Selection & Evaluation Criteria
2.6 Scope of the Study
2.7 Assumptions & Limitations
3 Smart Sensor Technology Ecosystem
3.1 Smart Sensor Technology Ecosystem
3.2 Evolution of Smart Sensor Technologies
3.3 Smart Sensor Technology Value Chain
3.4 Sensing-to-Decision Lifecycle
3.5 Key Technology Development Drivers
3.6 Technical & Engineering Challenges
3.7 Smart Sensor Performance Requirements
3.8 Sensing, Processing & Connectivity Infrastructure
3.9 Standards, Interoperability & Technology Governance
4 Smart Sensor Technology Platform Intelligence
4.1 Temperature & Pressure Smart Sensors
4.2 Optical & Image Sensors
4.3 Motion, Inertial & Position Sensors
4.4 Chemical & Gas Smart Sensors
4.5 Environmental & Air Quality Sensors
4.6 Magnetic & Electromagnetic Sensors
4.7 MEMS & NEMS Smart Sensors
4.8 AI-Enabled & Edge Smart Sensors
4.9 Emerging Smart Sensor Platforms
4.10 Cross-Technology Performance Comparison
5 Technology Maturity & Readiness Intelligence
5.1 Smart Sensor Technology Maturity Assessment
5.2 Technology Readiness Level (TRL) Assessment
5.3 Manufacturing Readiness Assessment
5.4 Commercialization Readiness Assessment
5.5 Prototype-to-Pilot Transition
5.6 Pilot-to-Commercial Scale Transition
5.7 Smart Sensor Adoption Curve
5.8 Technology Scalability Assessment
5.9 Performance vs Commercial Readiness Matrix
5.10 Technology Risk Assessment
6 Sensor Performance & Application Intelligence
6.1 Smart Sensor Performance Benchmarking
6.2 Sensitivity, Accuracy & Resolution Requirements
6.3 Power Consumption & Energy Efficiency Requirements
6.4 Connectivity & Edge Processing Requirements
6.5 Miniaturization, Reliability & Environmental Requirements
6.6 Industrial & Manufacturing Applications
6.7 Automotive & Mobility Applications
6.8 Healthcare & Wearable Applications
6.9 Consumer Electronics & Smart Infrastructure Applications
6.10 Energy, Environmental & Other Emerging Applications
6.11 Technology–Application Suitability Matrix
7 Technology Development & Innovation Roadmaps
7.1 Smart Sensor Technology Roadmap
7.2 Near-Term Technology Developments
7.3 Mid-Term Technology Developments
7.4 Long-Term Technology Developments
7.5 Next-Generation Smart Sensor Architectures
7.6 AI-Enabled Sensor Innovations
7.7 Sensor Fusion & Edge Intelligence Innovations
7.8 Flexible, Printed & Miniaturized Sensor Innovations
7.9 Technology Convergence Opportunities
7.10 Future Smart Sensor Technology Pipeline
8 R&D and Innovation Intelligence
8.1 Global Smart Sensor R&D Landscape
8.2 Leading Corporate R&D Programs
8.3 University & Research Institute Programs
8.4 National Laboratory & Government Activities
8.5 Research Collaboration Networks
8.6 Government-Funded Technology Programs
8.7 R&D Investment Trends
8.8 Research Breakthrough Tracking
8.9 Academic-to-Industry Technology Transfer
8.10 Smart Sensor Innovation Hotspots
9 Patent & Intellectual Property Intelligence
9.1 Smart Sensor Patent Landscape
9.2 Patent Filing Trends
9.3 Leading Patent Holders
9.4 Patent Activity by Sensor Technology
9.5 Patent Activity by Application
9.6 High-Impact Patent Families
9.7 Emerging IP Clusters
9.8 Patent Citation & Influence Analysis
9.9 Technology Ownership & IP Concentration
9.10 Potential Smart Sensor IP White Spaces
10 Technology Commercialization Intelligence
10.1 Research-to-Market Commercialization Landscape
10.2 Commercialized Smart Sensor Technologies
10.3 Pre-Commercial & Pilot-Stage Technologies
10.4 Technology Licensing & Sensor Partnerships
10.5 Manufacturing Scale-Up Challenges
10.6 Commercialization Barriers
10.7 Cost & Performance Improvement Pathways
10.8 Industry Adoption Requirements
10.9 Technology Adoption by Application
10.10 Smart Sensor Commercialization Timeline
11 Technology Developers & Innovation Benchmarking
11.1 Leading Smart Sensor Technology Developers
11.2 Technology Portfolio Comparison
11.3 Smart Sensor Platform Capabilities
11.4 Technology Maturity Comparison
11.5 R&D Capability Comparison
11.6 Patent & IP Strength Comparison
11.7 Research Collaboration Strength
11.8 Manufacturing & Scale-Up Capability
11.9 Commercialization Progress
11.10 Technology Leadership Matrix
12 Emerging Technologies, Startups & Research Spin-Offs
12.1 Emerging Smart Sensor Technologies
12.2 Breakthrough Technologies to Watch
12.3 High-Potential Technology Developers
12.4 University Spin-Offs
12.5 Deep-Tech Smart Sensor Startups
12.6 Startups by Sensor Technology
12.7 Startups by Application
12.8 Venture Funding for Emerging Technologies
12.9 Disruptive Technology Assessment
12.10 Emerging Technology Watchlist
13 Regional Technology & Innovation Hubs
13.1 United States
13.2 Canada
13.3 European Union
13.4 United Kingdom
13.5 China
13.6 Japan
13.7 South Korea
13.8 India
13.9 Australia
13.10 Emerging Smart Sensor Technology Hubs
13.11 Regional Technology Leadership Comparison
14 Future Technology Outlook & White Spaces
14.1 Smart Sensor Technology White Space Analysis
14.2 Unsolved Technical Challenges
14.3 Emerging Research Directions
14.4 Sensor, AI, Edge & IoT Convergence Opportunities
14.5 Next-Generation Sensor Opportunities
14.6 Potential Technology Disruptors
14.7 Future Smart Sensor Technology Leaders
14.8 Technology Development Scenarios
14.9 5–10 Year Technology Outlook
14.10 Strategic Technology Recommendations
15 Technology Developer Profiles
15.1 Bosch Sensortec GmbH
15.2 STMicroelectronics N.V.
15.3 TE Connectivity Ltd.
15.4 Honeywell International Inc.
15.5 Texas Instruments Incorporated
15.6 Analog Devices Inc.
15.7 Infineon Technologies AG
15.8 NXP Semiconductors N.V.
15.9 Sensata Technologies Holding plc
15.10 ams-OSRAM AG
15.11 Sony Semiconductor Solutions Corporation
15.12 Murata Manufacturing Co. Ltd.
15.13 TDK Corporation
15.14 Renesas Electronics Corporation
15.15 Omron Corporation
15.16 Panasonic Holdings Corporation
15.17 Siemens AG
15.18 ABB Ltd.
15.19 TE Connectivity Sensors
15.20 Microchip Technology Inc.
15.21 Collins Aerospace
15.22 Allegro MicroSystems Inc.
15.23 Vishay Intertechnology Inc.
15.24 Kistler Holding AG
15.25 Sensirion AG
16 List of Tables
Table 1 Smart Sensor Technology Ecosystem
Table 2 Smart Sensor Technology Platform Comparison
Table 3 Smart Sensor Performance Benchmark
Table 4 Smart Sensor Technology Evolution & Development Roadmap
Table 5 Technology Maturity Assessment
Table 6 Technology Readiness Level Assessment
Table 7 Manufacturing Readiness Assessment
Table 8 Commercialization Readiness Assessment
Table 9 Technology–Application Suitability Matrix
Table 10 Leading Smart Sensor Technology Developers
Table 11 Technology Portfolio Comparison
Table 12 R&D Capability Benchmark
Table 13 Patent & IP Leadership Comparison
Table 14 Leading Research Institutions
Table 15 Research Collaboration Landscape
Table 16 Emerging Smart Sensor Technologies
Table 17 Emerging Technology TRL Assessment
Table 18 Startup & Spin-Off Technology Landscape
Table 19 Regional Technology Leadership Matrix
Table 20 Smart Sensor Technology White Space & Opportunity Matrix
17 List of Figures
Fig 1 Smart Sensor Technology Ecosystem
Fig 2 Smart Sensor Technology Value Chain
Fig 3 Sensing-to-Decision Lifecycle
Fig 4 Smart Sensor Technology Platform Landscape
Fig 5 Smart Sensor Technology Evolution Roadmap
Fig 6 Smart Sensor Technology Maturity Map
Fig 7 Smart Sensor TRL Landscape
Fig 8 Performance vs Commercial Readiness Matrix
Fig 9 Smart Sensor Technology–Application Mapping
Fig 10 Global Smart Sensor R&D & Innovation Hotspots
Fig 11 Smart Sensor Research Collaboration Network
Fig 12 Smart Sensor Patent Filing Trend
Fig 13 Smart Sensor Patent Technology Landscape
Fig 14 Emerging Smart Sensor Technology Pipeline
Fig 15 Smart Sensor Technology Commercialization Timeline
Fig 16 Regional Smart Sensor Technology Leadership Map
Fig 17 Smart Sensor Technology White Space Map
List of Figures
RESEARCH METHODOLOGY
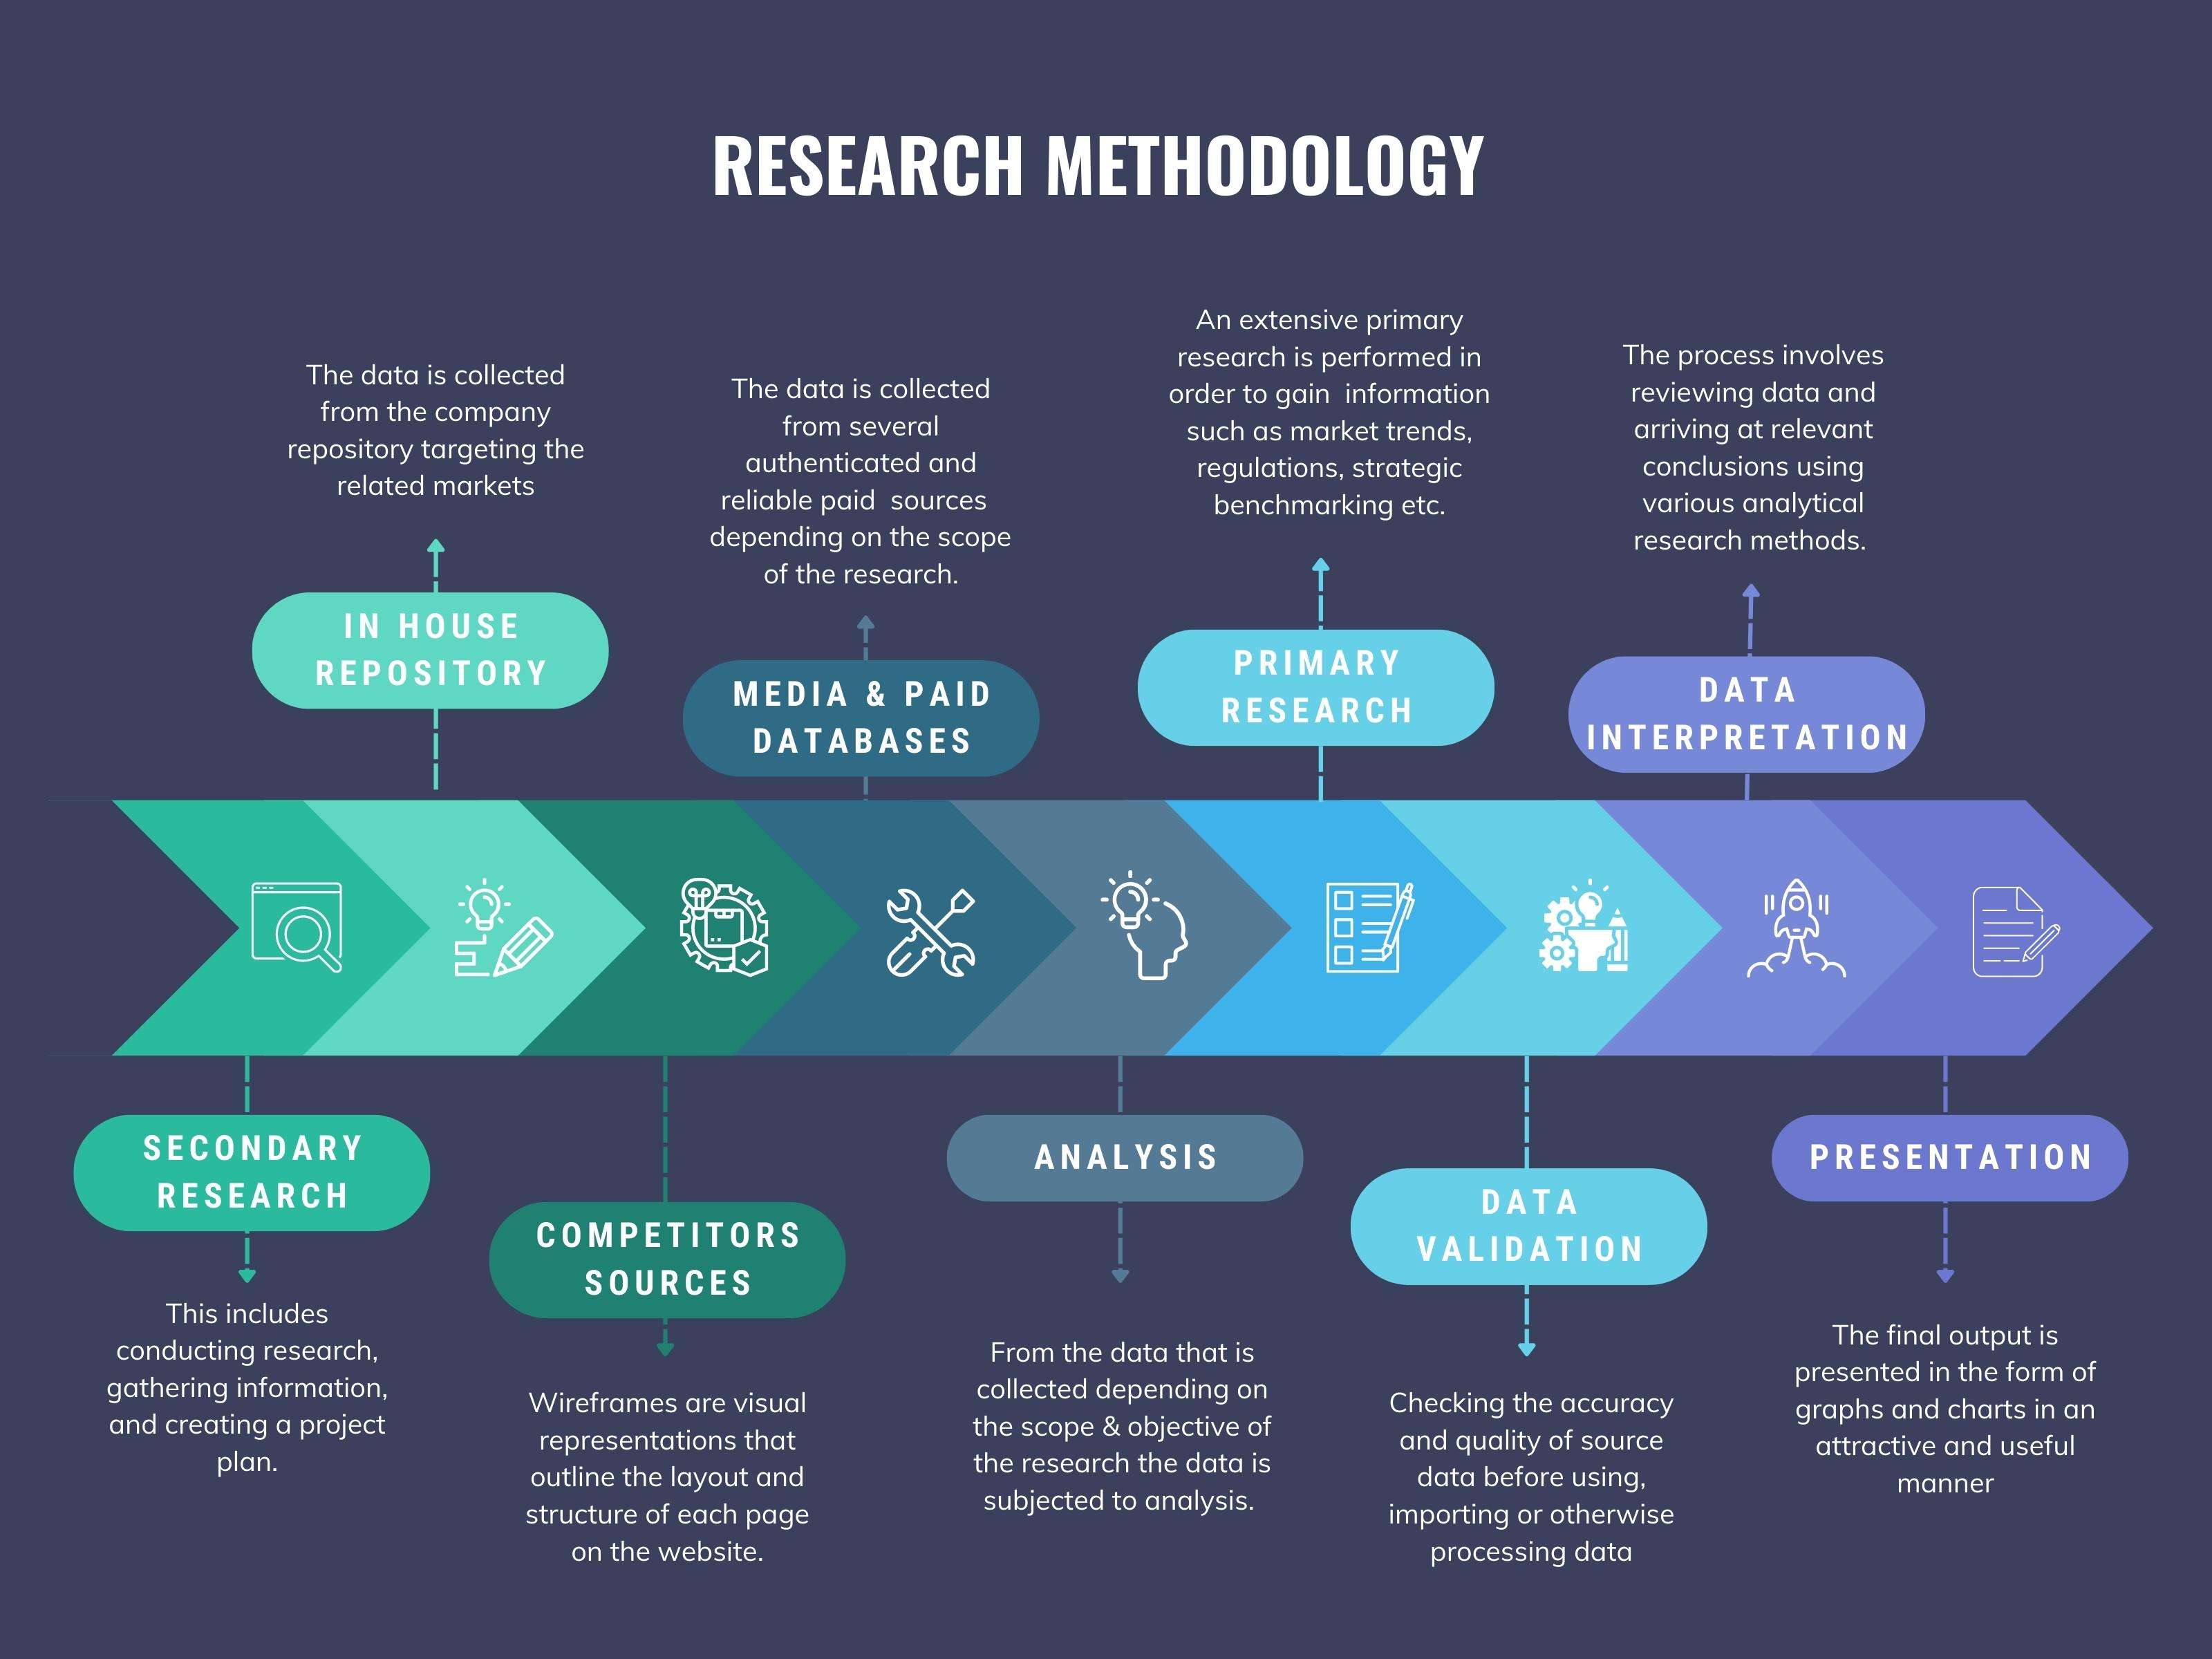
We at ‘Stratistics’ opt for an extensive research approach which involves data mining, data validation, and data analysis. The various research sources include in-house repository, secondary research, competitor’s sources, social media research, client internal data, and primary research.
Our team of analysts prefers the most reliable and authenticated data sources in order to perform the comprehensive literature search. With access to most of the authenticated data bases our team highly considers the best mix of information through various sources to obtain extensive and accurate analysis.
Each report takes an average time of a month and a team of 4 industry analysts. The time may vary depending on the scope and data availability of the desired market report. The various parameters used in the market assessment are standardized in order to enhance the data accuracy.
Data Mining
The data is collected from several authenticated, reliable, paid and unpaid sources and is filtered depending on the scope & objective of the research. Our reports repository acts as an added advantage in this procedure. Data gathering from the raw material suppliers, distributors and the manufacturers is performed on a regular basis, this helps in the comprehensive understanding of the products value chain. Apart from the above mentioned sources the data is also collected from the industry consultants to ensure the objective of the study is in the right direction.
Market trends such as technological advancements, regulatory affairs, market dynamics (Drivers, Restraints, Opportunities and Challenges) are obtained from scientific journals, market related national & international associations and organizations.
Data Analysis
From the data that is collected depending on the scope & objective of the research the data is subjected for the analysis. The critical steps that we follow for the data analysis include:
- Product Lifecycle Analysis
- Competitor analysis
- Risk analysis
- Porters Analysis
- PESTEL Analysis
- SWOT Analysis
The data engineering is performed by the core industry experts considering both the Marketing Mix Modeling and the Demand Forecasting. The marketing mix modeling makes use of multiple-regression techniques to predict the optimal mix of marketing variables. Regression factor is based on a number of variables and how they relate to an outcome such as sales or profits.
Data Validation
The data validation is performed by the exhaustive primary research from the expert interviews. This includes telephonic interviews, focus groups, face to face interviews, and questionnaires to validate our research from all aspects. The industry experts we approach come from the leading firms, involved in the supply chain ranging from the suppliers, distributors to the manufacturers and consumers so as to ensure an unbiased analysis.
We are in touch with more than 15,000 industry experts with the right mix of consultants, CEO's, presidents, vice presidents, managers, experts from both supply side and demand side, executives and so on.
The data validation involves the primary research from the industry experts belonging to:
- Leading Companies
- Suppliers & Distributors
- Manufacturers
- Consumers
- Industry/Strategic Consultants
Apart from the data validation the primary research also helps in performing the fill gap research, i.e. providing solutions for the unmet needs of the research which helps in enhancing the reports quality.
For more details about research methodology, kindly write to us at info@strategymrc.com
Frequently Asked Questions
In case of any queries regarding this report, you can contact the customer service by filing the “Inquiry Before Buy” form available on the right hand side. You may also contact us through email: info@strategymrc.com or phone: +1-301-202-5929
Yes, the samples are available for all the published reports. You can request them by filling the “Request Sample” option available in this page.
Yes, you can request a sample with your specific requirements. All the customized samples will be provided as per the requirement with the real data masked.
All our reports are available in Digital PDF format. In case if you require them in any other formats, such as PPT, Excel etc you can submit a request through “Inquiry Before Buy” form available on the right hand side. You may also contact us through email: info@strategymrc.com or phone: +1-301-202-5929
We offer a free 15% customization with every purchase. This requirement can be fulfilled for both pre and post sale. You may send your customization requirements through email at info@strategymrc.com or call us on +1-301-202-5929.
We have 3 different licensing options available in electronic format.
- Single User Licence: Allows one person, typically the buyer, to have access to the ordered product. The ordered product cannot be distributed to anyone else.
- 2-5 User Licence: Allows the ordered product to be shared among a maximum of 5 people within your organisation.
- Corporate License: Allows the product to be shared among all employees of your organisation regardless of their geographical location.
All our reports are typically be emailed to you as an attachment.
To order any available report you need to register on our website. The payment can be made either through CCAvenue or PayPal payments gateways which accept all international cards.
We extend our support to 6 months post sale. A post sale customization is also provided to cover your unmet needs in the report.
Request Customization
We offer complimentary customization of up to 15% with every purchase. To share your customization requirements, feel free to email us at info@strategymrc.com or call us on +1-301-202-5929. .
Please Note: Customization within the 15% threshold is entirely free of charge. If your request exceeds this limit, we will conduct a feasibility assessment. Following that, a detailed quote and timeline will be provided.
WHY CHOOSE US ?

Assured Quality
Best in class reports with high standard of research integrity

24X7 Research Support
Continuous support to ensure the best customer experience.

Free Customization
Adding more values to your product of interest.

Safe & Secure Access
Providing a secured environment for all online transactions.

Trusted by 600+ Brands
Serving the most reputed brands across the world.