
Glycomics Market
Glycomics Market Forecasts to 2030 - Global Analysis By Product (Kits, Reagents, Enzymes and Instruments), Application (Diagnostics, Drug Discovery & Development and Other Applications), End User and By Geography

|
Years Covered |
2021-2030 |
|
Estimated Year Value (2023) |
US $2.13 BN |
|
Projected Year Value (2030) |
US $6.61 BN |
|
CAGR (2023 - 2030) |
17.5% |
|
Regions Covered |
North America, Europe, Asia Pacific, South America, and Middle East & Africa |
|
Countries Covered |
US, Canada, Mexico, Germany, UK, Italy, France, Spain, Japan, China, India, Australia, New Zealand, South Korea, Rest of Asia Pacific, South America, Argentina, Brazil, Chile, Middle East & Africa, Saudi Arabia, UAE, Qatar, and South Africa |
|
Largest Market |
North America |
|
Highest Growing Market |
Asia Pacific |
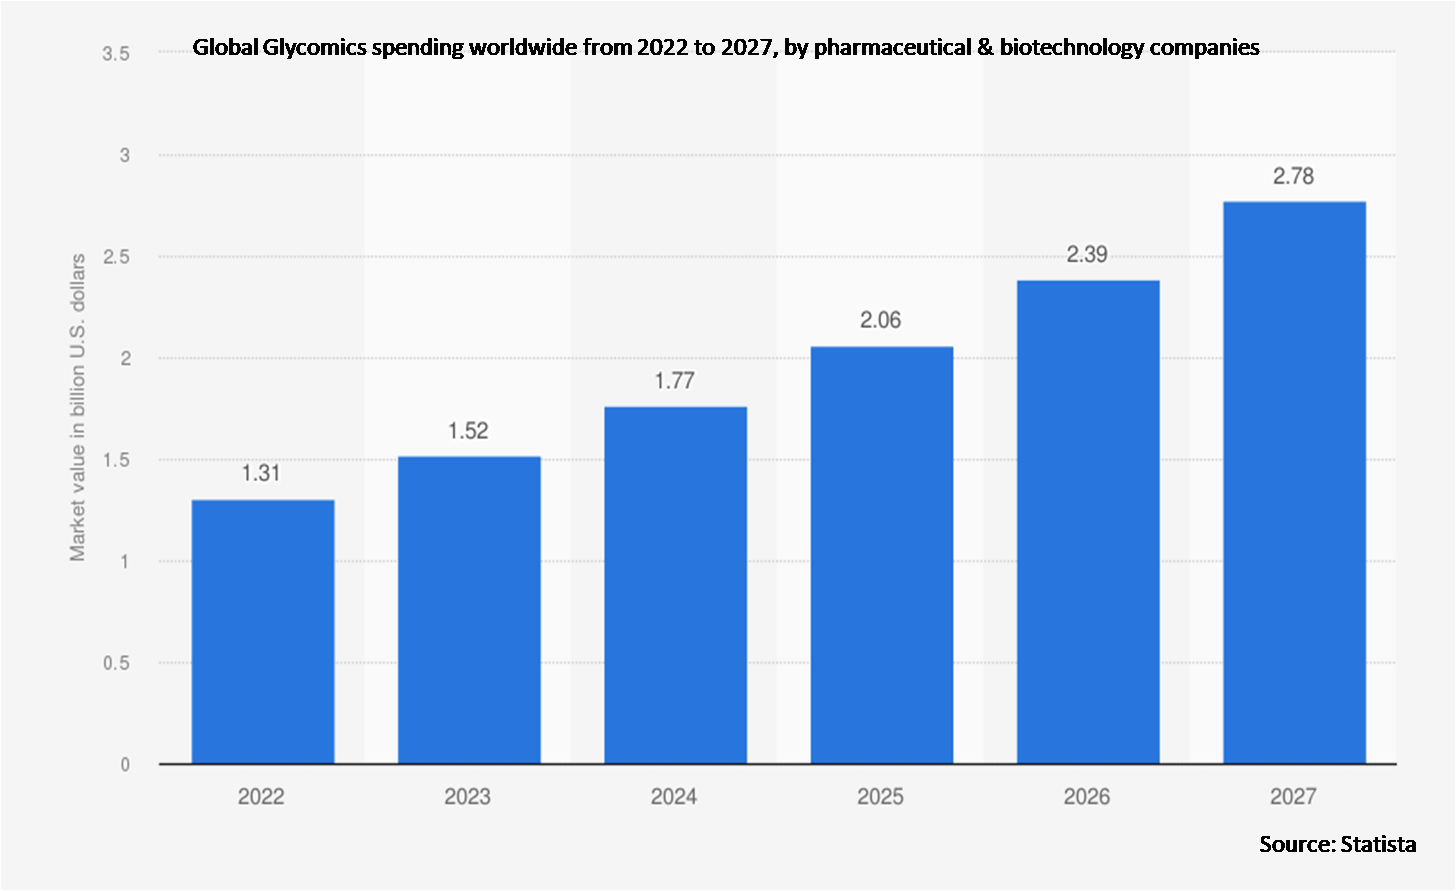
According to Stratistics MRC, the Global Glycomics Market is accounted for $2.13 billion in 2023 and is expected to reach $6.61 billion by 2030 growing at a CAGR of 17.5% during the forecast period. Glycomics is a field of study within molecular biology and biochemistry that focuses on the comprehensive analysis of the structure, function, and biology of carbohydrates (sugars) in biological systems. It involves the study of complex carbohydrates, also known as glycans, and their interactions with other molecules in cells and organisms. Its research has far-reaching implications for understanding of biological processes, disease mechanisms, and the development of novel therapies.
According to a study published in February 2022 by researchers at the University of Copenhagen's Center for Glycomics, Heparin can now be produced without using animals through glycomics studies.
Market Dynamics:
Driver:
Increasing research in glycomics
Growing research in glycomics reveals the critical role of glycans in various biological processes, diseases, and therapeutic development. This broadening scope creates a wider market for glycomics technologies across biomedicine applications. Increased research in glycomics fosters innovation in analytical techniques. With increased research, there is a demand for more accessible and cost-effective glycomics technologies. It also creates a strong demand for specialized tools, technologies, and services. These aspects are propelling the market growth.
Restraint:
Limited standardization
Glycans are highly diverse and structurally complex molecules. Standardizing the analysis and characterization of glycans across different research settings and laboratories can be challenging, leading to potential inconsistencies and difficulties in data interpretation. In addition, its limited commercial standards, varied analytical techniques, environmental factors, structural diversity and evolutionary variabilites hinder the market demand.
Opportunity:
Rising cancer biomarkers and diagnostics
Glycomics research plays a crucial role in identifying specific glycan structures associated with various types of cancer. Understanding these unique glycan patterns allows for the development of accurate and reliable cancer biomarkers. It improves precision in cancer subtyping. Also, glycomics research may lead to the discovery of multiple glycan biomarkers associated with a specific cancer type. Combining these markers into a panel can further enhance diagnostic accuracy. Further, its practical implications for improving cancer detection, treatment, and patient outcomes are accelerating the market growth.
Threat:
High cost of instruments and reagents
Research labs, particularly those with limited budgets or in academic settings, may face challenges in acquiring and maintaining the necessary glycomics equipment and reagents. This can lead to a slower pace of research or even deter some labs from entering the field. The high cost of instruments and reagents may deter companies and manufacturers from investing in research and development for glycomics technologies. Therefore, the high cost of entry can potentially slow down the growth of the glycomics market.
Covid-19 Impact
The COVID-19 pandemic had both direct and indirect impacts on the field of Glycomics. Many research laboratories and institutions faced disruptions in their operations due to lockdowns, restrictions, and safety measures. The financial impact of the pandemic had a long-term effect on research funding. On the positive side, the pandemic highlighted the importance of understanding the role of glycans in viral infections. Researchers have explored the potential of glycans in the development of therapeutics, vaccines, or diagnostics related to COVID-19.
The kits segment is expected to be the largest during the forecast period
The kits segment is estimated to have a lucrative growth. Glycomics kits are specialized sets of reagents, tools, and protocols designed to facilitate the analysis and study of complex carbohydrates (glycans) in biological samples. They provide a standardized set of reagents and methods for the comprehensive profiling of glycans in biological samples. Glycomics kits include enzymes, labeling agents, and other tools necessary for the enzymatic release and modification of glycans, enabling detailed structural analysis. They play a crucial role in the diagnostics and quality control in biopharmaceuticals.
The drug discovery & development segment is expected to have the highest CAGR during the forecast period
The drug discovery & development segment is anticipated to witness the highest CAGR growth during the forecast period. The integration of glycomics into drug discovery and development processes leads to more precise and effective therapies, ultimately benefiting patients by improving treatment outcomes and minimizing side effects. Glycomics can contribute to the design of drugs with reduced off-target effects and improved selectivity. It can also improve vaccine efficiency. All these factors are driving the segment growth.
Region with largest share:
North America is projected to hold the largest market share during the forecast period. North America, comprising the United States and Canada, represented one of the largest glycomics markets globally. North America is home to numerous prominent research institutions, universities, and academic medical centers. The region's advanced healthcare infrastructure, robust research ecosystem, and significant investments in biotechnology and life sciences contributed to the market's size and growth.
Region with highest CAGR:
Asia Pacific is projected to have the highest CAGR over the forecast period. The Glycomics market in Asia Pacific includes a mix of global biotechnology companies, academic research institutions, and local manufacturers. Both established players and emerging start-ups contribute to the competitive landscape. The biopharmaceutical industry in Asia Pacific is expanding rapidly. The shift towards personalized medicine in the healthcare industry drives the demand for glycomics technologies in this region.

Key players in the market
Some of the key players profiled in the Glycomics Market include Asparia Glycomics, Merck KGaA, Bruker, Thermo Fisher Scientific, Inc, New England Biolabs, Waters Corporation, Takara Bio Inc, Agilent Technologies Inc., RayBiotech Life, Inc., Shimadzu Corporation, Danaher, Lectenz Bio, Intellihep Limited, Sanofi Corporation and Bayer AG.
Key Developments:
In August 2023, Thermo Fisher Scientific the world leader in serving science, announced the commercial launch of the EXENT® Solution, after receiving IVDR certification*. The EXENT solution is a fully integrated and automated mass spectrometry system designed to transform diagnosis and assessment for patients with monoclonal gammopathies.
In June 2022, Sanofi announced the launch of its first Digital Accelerator to foster its ambition to become a leading digital healthcare company. The Accelerator will develop products and solutions that will support Sanofi’s mission to transform the practice of medicine with the use of digital, data and artificial intelligence (AI).
Products Covered:
• Kits
• Reagents
• Enzymes
• Instruments
Applications Covered:
• Diagnostics
• Drug Discovery & Development
• Other Applications
End Users Covered:
• Academic & Research Institutes
• Pharmaceutical & Biotechnology Companies
• Biopharmaceutical Companies
• Contract Research Organization (CRO)
Regions Covered:
• North America
o US
o Canada
o Mexico
• Europe
o Germany
o UK
o Italy
o France
o Spain
o Rest of Europe
• Asia Pacific
o Japan
o China
o India
o Australia
o New Zealand
o South Korea
o Rest of Asia Pacific
• South America
o Argentina
o Brazil
o Chile
o Rest of South America
• Middle East & Africa
o Saudi Arabia
o UAE
o Qatar
o South Africa
o Rest of Middle East & Africa
What our report offers:
- Market share assessments for the regional and country-level segments
- Strategic recommendations for the new entrants
- Covers Market data for the years 2021, 2022, 2023, 2026, and 2030
- Market Trends (Drivers, Constraints, Opportunities, Threats, Challenges, Investment Opportunities, and recommendations)
- Strategic recommendations in key business segments based on the market estimations
- Competitive landscaping mapping the key common trends
- Company profiling with detailed strategies, financials, and recent developments
- Supply chain trends mapping the latest technological advancements
Free Customization Offerings:
All the customers of this report will be entitled to receive one of the following free customization options:
• Company Profiling
o Comprehensive profiling of additional market players (up to 3)
o SWOT Analysis of key players (up to 3)
• Regional Segmentation
o Market estimations, Forecasts and CAGR of any prominent country as per the client's interest (Note: Depends on feasibility check)
• Competitive Benchmarking
o Benchmarking of key players based on product portfolio, geographical presence, and strategic alliances
Table of Contents
1 Executive Summary
2 Preface
2.1 Abstract
2.2 Stake Holders
2.3 Research Scope
2.4 Research Methodology
2.4.1 Data Mining
2.4.2 Data Analysis
2.4.3 Data Validation
2.4.4 Research Approach
2.5 Research Sources
2.5.1 Primary Research Sources
2.5.2 Secondary Research Sources
2.5.3 Assumptions
3 Market Trend Analysis
3.1 Introduction
3.2 Drivers
3.3 Restraints
3.4 Opportunities
3.5 Threats
3.6 Product Analysis
3.7 Application Analysis
3.8 End User Analysis
3.9 Emerging Markets
3.10 Impact of Covid-19
4 Porters Five Force Analysis
4.1 Bargaining power of suppliers
4.2 Bargaining power of buyers
4.3 Threat of substitutes
4.4 Threat of new entrants
4.5 Competitive rivalry
5 Global Glycomics Market, By Product
5.1 Introduction
5.2 Kits
5.2.1 Glycan Labeling Kits
5.2.2 Glycan Purification Kits
5.2.3 Glycan Release Kits
5.2.4 Other Glycomics Kits
5.3 Reagents
5.3.1 Glycoproteins
5.3.2 Monosaccharides
5.3.3 Oligosaccharides
5.3.4 Other Reagents
5.4 Enzymes
5.4.1 Glycosidases
5.4.2 Glycosyltransferases
5.4.3 Neuraminidases
5.4.4 Sialyltransferases
5.4.5 Other Enzymes
5.5 Instruments
5.5.1 High-Performance Liquid Chromatography (HPLC)
5.5.2 Matrix-Assisted Laser Desorption/Ionization Time-Of-Flight (MALDI-TOF)
5.5.3 Mass Spectrometers
5.5.4 Array Systems
5.5.5 Other Instruments
6 Global Glycomics Market, By Application
6.1 Introduction
6.2 Diagnostics
6.3 Drug Discovery & Development
6.4 Other Applications
7 Global Glycomics Market, By End User
7.1 Introduction
7.2 Academic & Research Institutes
7.3 Pharmaceutical & Biotechnology Companies
7.4 Biopharmaceutical Companies
7.5 Contract Research Organization (CRO)
8 Global Glycomics Market, By Geography
8.1 Introduction
8.2 North America
8.2.1 US
8.2.2 Canada
8.2.3 Mexico
8.3 Europe
8.3.1 Germany
8.3.2 UK
8.3.3 Italy
8.3.4 France
8.3.5 Spain
8.3.6 Rest of Europe
8.4 Asia Pacific
8.4.1 Japan
8.4.2 China
8.4.3 India
8.4.4 Australia
8.4.5 New Zealand
8.4.6 South Korea
8.4.7 Rest of Asia Pacific
8.5 South America
8.5.1 Argentina
8.5.2 Brazil
8.5.3 Chile
8.5.4 Rest of South America
8.6 Middle East & Africa
8.6.1 Saudi Arabia
8.6.2 UAE
8.6.3 Qatar
8.6.4 South Africa
8.6.5 Rest of Middle East & Africa
9 Key Developments
9.1 Agreements, Partnerships, Collaborations and Joint Ventures
9.2 Acquisitions & Mergers
9.3 New Product Launch
9.4 Expansions
9.5 Other Key Strategies
10 Company Profiling
10.1 Asparia Glycomics
10.2 Merck KGaA
10.3 Bruker
10.4 Thermo Fisher Scientific, Inc
10.5 New England Biolabs
10.6 Waters Corporation
10.7 Takara Bio Inc
10.8 Agilent Technologies Inc.
10.9 RayBiotech Life, Inc.
10.10 Shimadzu Corporation
10.11 Danaher
10.12 Lectenz Bio
10.13 Intellihep Limited
10.14 Sanofi Corporation
10.15 Bayer AG
List of Tables
1 Global Glycomics Market Outlook, By Region (2021-2030) ($MN)
2 Global Glycomics Market Outlook, By Product (2021-2030) ($MN)
3 Global Glycomics Market Outlook, By Kits (2021-2030) ($MN)
4 Global Glycomics Market Outlook, By Glycan Labeling Kits (2021-2030) ($MN)
5 Global Glycomics Market Outlook, By Glycan Purification Kits (2021-2030) ($MN)
6 Global Glycomics Market Outlook, By Glycan Release Kits (2021-2030) ($MN)
7 Global Glycomics Market Outlook, By Other Glycomics Kits (2021-2030) ($MN)
8 Global Glycomics Market Outlook, By Reagents (2021-2030) ($MN)
9 Global Glycomics Market Outlook, By Glycoproteins (2021-2030) ($MN)
10 Global Glycomics Market Outlook, By Monosaccharides (2021-2030) ($MN)
11 Global Glycomics Market Outlook, By Oligosaccharides (2021-2030) ($MN)
12 Global Glycomics Market Outlook, By Other Reagents (2021-2030) ($MN)
13 Global Glycomics Market Outlook, By Enzymes (2021-2030) ($MN)
14 Global Glycomics Market Outlook, By Glycosidases (2021-2030) ($MN)
15 Global Glycomics Market Outlook, By Glycosyltransferases (2021-2030) ($MN)
16 Global Glycomics Market Outlook, By Neuraminidases (2021-2030) ($MN)
17 Global Glycomics Market Outlook, By Sialyltransferases (2021-2030) ($MN)
18 Global Glycomics Market Outlook, By Other Enzymes (2021-2030) ($MN)
19 Global Glycomics Market Outlook, By Instruments (2021-2030) ($MN)
20 Global Glycomics Market Outlook, By High-Performance Liquid Chromatography (HPLC) (2021-2030) ($MN)
21 Global Glycomics Market Outlook, By Matrix-Assisted Laser Desorption/Ionization Time-Of-Flight (MALDI-TOF) (2021-2030) ($MN)
22 Global Glycomics Market Outlook, By Mass Spectrometers (2021-2030) ($MN)
23 Global Glycomics Market Outlook, By Array Systems (2021-2030) ($MN)
24 Global Glycomics Market Outlook, By Other Instruments (2021-2030) ($MN)
25 Global Glycomics Market Outlook, By Application (2021-2030) ($MN)
26 Global Glycomics Market Outlook, By Diagnostics (2021-2030) ($MN)
27 Global Glycomics Market Outlook, By Drug Discovery & Development (2021-2030) ($MN)
28 Global Glycomics Market Outlook, By Other Applications (2021-2030) ($MN)
29 Global Glycomics Market Outlook, By End User (2021-2030) ($MN)
30 Global Glycomics Market Outlook, By Academic & Research Institutes (2021-2030) ($MN)
31 Global Glycomics Market Outlook, By Pharmaceutical & Biotechnology Companies (2021-2030) ($MN)
32 Global Glycomics Market Outlook, By Biopharmaceutical Companies (2021-2030) ($MN)
33 Global Glycomics Market Outlook, By Contract Research Organization (CRO) (2021-2030) ($MN)
Note: Tables for North America, Europe, APAC, South America, and Middle East & Africa Regions are also represented in the same manner as above.
List of Figures
List of Figures
Figure 1 Global Glycomics Market Outlook (2021-2030) ($MN)
Figure 2 North America Glycomics Market Outlook (2021-2030) ($MN)
Figure 3 US Glycomics Market Outlook (2021-2030) ($MN)
Figure 4 Canada Glycomics Market Outlook (2021-2030) ($MN)
Figure 5 Mexico Glycomics Market Outlook (2021-2030) ($MN)
Figure 6 Europe Glycomics Market Outlook (2021-2030) ($MN)
Figure 7 Germany Glycomics Market Outlook (2021-2030) ($MN)
Figure 8 UK Glycomics Market Outlook (2021-2030) ($MN)
Figure 9 Italy Glycomics Market Outlook (2021-2030) ($MN)
Figure 10 France Glycomics Market Outlook (2021-2030) ($MN)
Figure 11 Spain Glycomics Market Outlook (2021-2030) ($MN)
Figure 12 Rest of Europe Glycomics Market Outlook (2021-2030) ($MN)
Figure 13 Asia Pacific Glycomics Market Outlook (2021-2030) ($MN)
Figure 14 Japan Glycomics Market Outlook (2021-2030) ($MN)
Figure 15 China Glycomics Market Outlook (2021-2030) ($MN)
Figure 16 India Glycomics Market Outlook (2021-2030) ($MN)
Figure 17 Australia Glycomics Market Outlook (2021-2030) ($MN)
Figure 18 New Zealand Glycomics Market Outlook (2021-2030) ($MN)
Figure 19 South Korea Glycomics Market Outlook (2021-2030) ($MN)
Figure 20 Rest of Asia Pacific Glycomics Market Outlook (2021-2030) ($MN)
Figure 21 South America Glycomics Market Outlook (2021-2030) ($MN)
Figure 22 Argentina Glycomics Market Outlook (2021-2030) ($MN)
Figure 23 Brazil Glycomics Market Outlook (2021-2030) ($MN)
Figure 24 Chile Glycomics Market Outlook (2021-2030) ($MN)
Figure 25 Rest of South America Glycomics Market Outlook (2021-2030) ($MN)
Figure 26 Middle East & Africa Glycomics Market Outlook (2021-2030) ($MN)
Figure 27 Saudi Arabia Glycomics Market Outlook (2021-2030) ($MN)
Figure 28 UAE Glycomics Market Outlook (2021-2030) ($MN)
Figure 29 Qatar Glycomics Market Outlook (2021-2030) ($MN)
Figure 30 South Africa Glycomics Market Outlook (2021-2030) ($MN)
Figure 31 Rest of Middle East & Africa Glycomics Market Outlook (2021-2030) ($MN)
RESEARCH METHODOLOGY

We at ‘Stratistics’ opt for an extensive research approach which involves data mining, data validation, and data analysis. The various research sources include in-house repository, secondary research, competitor’s sources, social media research, client internal data, and primary research.
Our team of analysts prefers the most reliable and authenticated data sources in order to perform the comprehensive literature search. With access to most of the authenticated data bases our team highly considers the best mix of information through various sources to obtain extensive and accurate analysis.
Each report takes an average time of a month and a team of 4 industry analysts. The time may vary depending on the scope and data availability of the desired market report. The various parameters used in the market assessment are standardized in order to enhance the data accuracy.
Data Mining
The data is collected from several authenticated, reliable, paid and unpaid sources and is filtered depending on the scope & objective of the research. Our reports repository acts as an added advantage in this procedure. Data gathering from the raw material suppliers, distributors and the manufacturers is performed on a regular basis, this helps in the comprehensive understanding of the products value chain. Apart from the above mentioned sources the data is also collected from the industry consultants to ensure the objective of the study is in the right direction.
Market trends such as technological advancements, regulatory affairs, market dynamics (Drivers, Restraints, Opportunities and Challenges) are obtained from scientific journals, market related national & international associations and organizations.
Data Analysis
From the data that is collected depending on the scope & objective of the research the data is subjected for the analysis. The critical steps that we follow for the data analysis include:
- Product Lifecycle Analysis
- Competitor analysis
- Risk analysis
- Porters Analysis
- PESTEL Analysis
- SWOT Analysis
The data engineering is performed by the core industry experts considering both the Marketing Mix Modeling and the Demand Forecasting. The marketing mix modeling makes use of multiple-regression techniques to predict the optimal mix of marketing variables. Regression factor is based on a number of variables and how they relate to an outcome such as sales or profits.
Data Validation
The data validation is performed by the exhaustive primary research from the expert interviews. This includes telephonic interviews, focus groups, face to face interviews, and questionnaires to validate our research from all aspects. The industry experts we approach come from the leading firms, involved in the supply chain ranging from the suppliers, distributors to the manufacturers and consumers so as to ensure an unbiased analysis.
We are in touch with more than 15,000 industry experts with the right mix of consultants, CEO's, presidents, vice presidents, managers, experts from both supply side and demand side, executives and so on.
The data validation involves the primary research from the industry experts belonging to:
- Leading Companies
- Suppliers & Distributors
- Manufacturers
- Consumers
- Industry/Strategic Consultants
Apart from the data validation the primary research also helps in performing the fill gap research, i.e. providing solutions for the unmet needs of the research which helps in enhancing the reports quality.
For more details about research methodology, kindly write to us at info@strategymrc.com
Frequently Asked Questions
In case of any queries regarding this report, you can contact the customer service by filing the “Inquiry Before Buy” form available on the right hand side. You may also contact us through email: info@strategymrc.com or phone: +1-301-202-5929
Yes, the samples are available for all the published reports. You can request them by filling the “Request Sample” option available in this page.
Yes, you can request a sample with your specific requirements. All the customized samples will be provided as per the requirement with the real data masked.
All our reports are available in Digital PDF format. In case if you require them in any other formats, such as PPT, Excel etc you can submit a request through “Inquiry Before Buy” form available on the right hand side. You may also contact us through email: info@strategymrc.com or phone: +1-301-202-5929
We offer a free 15% customization with every purchase. This requirement can be fulfilled for both pre and post sale. You may send your customization requirements through email at info@strategymrc.com or call us on +1-301-202-5929.
We have 3 different licensing options available in electronic format.
- Single User Licence: Allows one person, typically the buyer, to have access to the ordered product. The ordered product cannot be distributed to anyone else.
- 2-5 User Licence: Allows the ordered product to be shared among a maximum of 5 people within your organisation.
- Corporate License: Allows the product to be shared among all employees of your organisation regardless of their geographical location.
All our reports are typically be emailed to you as an attachment.
To order any available report you need to register on our website. The payment can be made either through CCAvenue or PayPal payments gateways which accept all international cards.
We extend our support to 6 months post sale. A post sale customization is also provided to cover your unmet needs in the report.
Request Customization
We offer complimentary customization of up to 15% with every purchase. To share your customization requirements, feel free to email us at info@strategymrc.com or call us on +1-301-202-5929. .
Please Note: Customization within the 15% threshold is entirely free of charge. If your request exceeds this limit, we will conduct a feasibility assessment. Following that, a detailed quote and timeline will be provided.
WHY CHOOSE US ?

Assured Quality
Best in class reports with high standard of research integrity

24X7 Research Support
Continuous support to ensure the best customer experience.

Free Customization
Adding more values to your product of interest.

Safe & Secure Access
Providing a secured environment for all online transactions.

Trusted by 600+ Brands
Serving the most reputed brands across the world.