
Graphic Processor Market
Graphic Processor Market Forecasts to 2030 - Global Analysis By Type (Hardware, Software and Other Types), End User (Electronics, IT & Telecommunication and Other End Users) and By Geography

|
Years Covered |
2021-2030 |
|
Estimated Year Value (2023) |
US $59.2 BN |
|
Projected Year Value (2030) |
US $404.9 BN |
|
CAGR (2023 - 2030) |
31.6% |
|
Regions Covered |
North America, Europe, Asia Pacific, South America, and Middle East & Africa |
|
Countries Covered |
US, Canada, Mexico, Germany, UK, Italy, France, Spain, Japan, China, India, Australia, New Zealand, South Korea, Rest of Asia Pacific, South America, Argentina, Brazil, Chile, Middle East & Africa, Saudi Arabia, UAE, Qatar, and South Africa |
|
Largest Market |
North America |
|
Highest Growing Market |
Asia Pacific |
According to Stratistics MRC, the Global Graphic Processor Market is accounted for $59.2 billion in 2023 and is expected to reach $404.9 billion by 2030 growing at a CAGR of 31.6% during the forecast period. Graphic processors, or GPUs, are specialized processors designed to handle the complex calculations required for rendering images and graphics. Unlike general-purpose CPUs, GPUs excel at parallel processing tasks, making them ideal for graphics-intensive applications like gaming, video editing, and 3D rendering. They consist of numerous cores that work simultaneously to perform computations, enhancing performance for tasks that involve large datasets or complex mathematical operations.
According to the PwC reports, Turkey expected to witness the fastest growth in the gaming market with the annual average growth rate of 24.1% between 2021 and 2026. The list is followed by Pakistan and India with the expansion of 21.9% and 18.3% respectively.
Market Dynamics:
Driver:
Gaming industry growth
As game developers strive to deliver immersive experiences, there is a constant need for powerful graphic processing units (GPUs) to handle complex rendering tasks and advanced visual effects. The rise of e-sports and virtual reality gaming has further fueled the demand for cutting-edge GPUs, pushing manufacturers to develop more powerful and efficient graphics solutions. Additionally, the trend towards higher screen resolutions and refresh rates has spurred innovation in GPU technology, making them a crucial component for gaming enthusiasts seeking superior performance and visual fidelity.
Restraint:
Manufacturing challenges
The graphic processor market faces manufacturing challenges primarily due to the intricate design and fabrication processes involved. Miniaturization and the increased complexity of GPU architecture pose difficulties in achieving high yields during production. The demand for cutting-edge technologies such as advanced semiconductor materials and lithography techniques contributes to higher production costs. Supply chain disruptions and shortages of critical components further restrain efficient manufacturing. Striking a balance between performance advancements and cost-effectiveness remains a persistent challenge, impacting the overall growth and competitiveness of the graphic processor market.
Opportunity:
Blockchain and cryptocurrency mining
Cryptocurrency mining involves solving complex mathematical problems to validate transactions on the blockchain. Graphic processors (GPUs) are highly efficient in performing the parallel computations required for mining, presenting a significant market opportunity. GPUs excel at the repetitive and parallel tasks involved in mining, making them ideal for processing cryptographic algorithms. This trend creates a lucrative market for GPU manufacturers, who benefit from increased sales driven by the expanding cryptocurrency mining industry.
Threat:
Increasing manufacturing costs
As manufacturing expenses rise, companies may struggle to maintain competitive pricing, potentially leading to reduced profit margins. This threat could hinder innovation and investment in research and development, limiting the ability to introduce cutting-edge technologies. Higher production costs may force companies to pass on the burden to consumers through elevated product prices, potentially impacting market demand. To mitigate this threat, industry participants must explore cost-effective manufacturing solutions, optimize supply chains, and seek operational efficiencies to sustain competitiveness.
Covid-19 Impact:
The COVID-19 pandemic significantly impacted the market as it led to an increased demand for remote work and entertainment. With a surge in home-based activities such as gaming, streaming, and video editing, there was a heightened need for powerful graphic processors. This resulted in supply chain disruptions and shortages, leading to increased prices and delays in product launches. On the other hand, the pandemic also accelerated the development of remote collaboration tools and cloud-based services, driving demand for graphics processing units (GPUs) in data centers.
The device segment is expected to be the largest during the forecast period
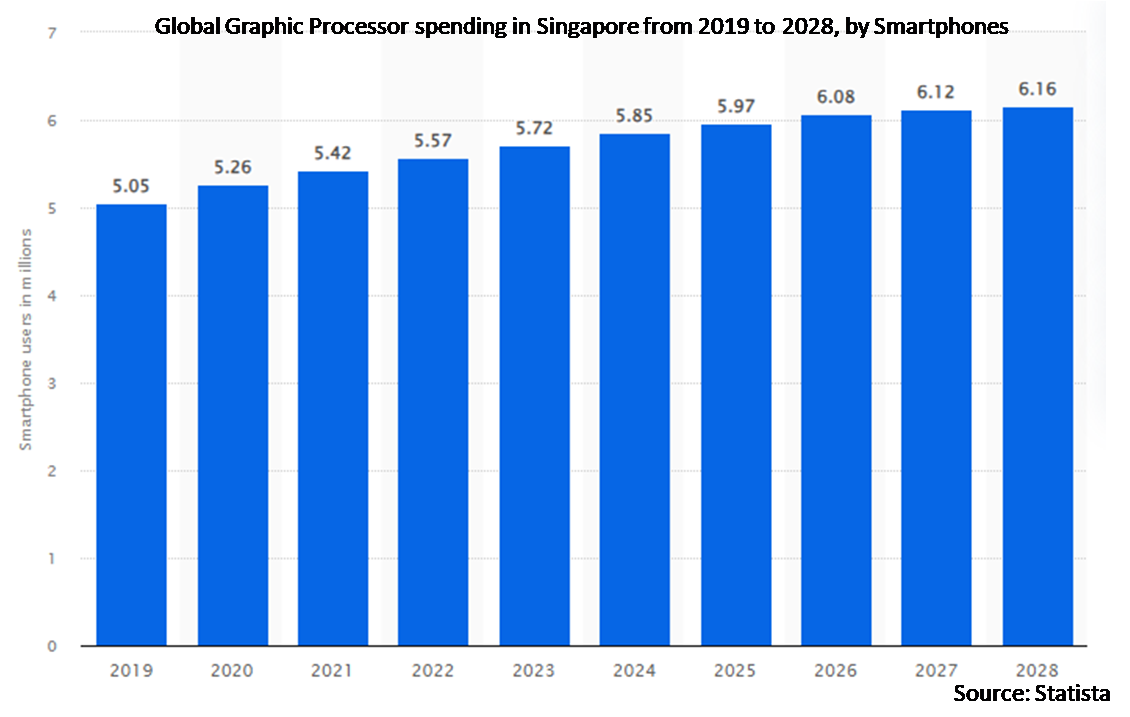
The device segment in the graphic processor market has witnessed substantial growth due to increasing demand for high-performance graphics in various consumer electronics. Smart phones, gaming consoles, and laptops are driving this surge as consumers seek enhanced visual experiences. The evolution of graphics-intensive applications, such as gaming and virtual reality, has fueled the need for advanced graphic processors in these devices. Moreover, the integration of AI capabilities into devices further amplifies the demand for powerful GPUs. As technology continues to advance, this segment is poised for continuous expansion, driven by the relentless pursuit of improved graphics performance and the overall user experience.
The IT and telecommunications segment is expected to have the highest CAGR during the forecast period
The IT and telecommunications segment has witnessed robust growth in the market due to escalating demand for high-performance computing and enhanced graphics capabilities. As technology advances, there is an increasing need for powerful GPUs in data centers, cloud computing, and telecommunications infrastructure to support complex tasks such as artificial intelligence, virtualization, and network processing. The proliferation of 5G networks and the rise of edge computing further fuel this demand, as these technologies require efficient graphic processing for faster data transmission and low-latency applications.
Region with largest share:
The North American region has experienced substantial growth in the market, fueled by increasing demand for high-performance computing across various industries. The expansion of gaming applications has been a key driver, with major players continually innovating to meet these evolving needs. The rise of immersive technologies like virtual reality and augmented reality has contributed to the heightened demand for advanced graphic processing units (GPUs) in the region. Additionally, the ongoing investments in research and development, coupled with a robust ecosystem of technology companies, have positioned North America as a significant hub for GPU market growth.
Region with highest CAGR:
The Asia-Pacific region has witnessed robust growth in the market, driven by increasing demand for high-performance computing in gaming, artificial intelligence, and data centers. Emerging economies such as China and India have become key contributors, with a rising tech-savvy population and an expanding gaming industry. The region's rapid urbanization and industrialization have fueled the adoption of graphic processors across various sectors. Additionally, advancements in technology, coupled with a surge in digital content creation and consumption, have further propelled the market's expansion.

Key players in the market
Some of the key players in Graphic Processor market include Advanced Micro Devices, Inc. (AMD), Amazon Web Services, Inc, Autodesk, Dassault Systems, Inc., Google Inc., IBM, Imagination Technologies, Intel Corporation, Matrox Electronic Systems Ltd., Microsoft Corporation, NVIDIA Corporation, Qualcomm Incorporated, Samsung Electronics Co., Ltd., Siemens AG, Sony Corporation and VIA Technologies, Inc.
Key Developments:
In January 2024, Chip maker Intel announced its latest ambitions in artificial intelligence. It is establishing an independent company dedicated to generative AI. The enterprise firm, named Articul8 AI, is being formed in partnership with DigitalBridge Group, a digital-focused asset manager. The organization will operate with an independent board of directors, with Intel continuing as a shareholder.
In November 2023, Valeo and Qualcomm announce intentions to extend their strategic cooperation to enhance safety and provide an always-connected digital experience for the Small Mobility segment in India. Companies intend to optimize their complementary product portfolios, in which Qualcomm Technologies and Valeo’ solutions for 2-wheelers and new vehicle classes will be used for connected display, clusters, driver assistance, and sensor technology. Strategic collaboration is expected to leverage the strong local R&D presence of the two companies and the local manufacturing capabilities of Valeo.
Types Covered:
• Hardware
• Software
• Service
• Device
• Other Types
End Users Covered:
• Electronics
• IT & Telecommunication
• Defense & Intelligence
• Media & Entertainment
• Automotive
• Other End Users
Regions Covered:
• North America
o US
o Canada
o Mexico
• Europe
o Germany
o UK
o Italy
o France
o Spain
o Rest of Europe
• Asia Pacific
o Japan
o China
o India
o Australia
o New Zealand
o South Korea
o Rest of Asia Pacific
• South America
o Argentina
o Brazil
o Chile
o Rest of South America
• Middle East & Africa
o Saudi Arabia
o UAE
o Qatar
o South Africa
o Rest of Middle East & Africa
What our report offers:
- Market share assessments for the regional and country-level segments
- Strategic recommendations for the new entrants
- Covers Market data for the years 2021, 2022, 2023, 2026, and 2030
- Market Trends (Drivers, Constraints, Opportunities, Threats, Challenges, Investment Opportunities, and recommendations)
- Strategic recommendations in key business segments based on the market estimations
- Competitive landscaping mapping the key common trends
- Company profiling with detailed strategies, financials, and recent developments
- Supply chain trends mapping the latest technological advancements
Free Customization Offerings:
All the customers of this report will be entitled to receive one of the following free customization options:
• Company Profiling
o Comprehensive profiling of additional market players (up to 3)
o SWOT Analysis of key players (up to 3)
• Regional Segmentation
o Market estimations, Forecasts and CAGR of any prominent country as per the client's interest (Note: Depends on feasibility check)
• Competitive Benchmarking
Benchmarking of key players based on product portfolio, geographical presence, and strategic alliances
Table of Contents
1 Executive Summary
2 Preface
2.1 Abstract
2.2 Stake Holders
2.3 Research Scope
2.4 Research Methodology
2.4.1 Data Mining
2.4.2 Data Analysis
2.4.3 Data Validation
2.4.4 Research Approach
2.5 Research Sources
2.5.1 Primary Research Sources
2.5.2 Secondary Research Sources
2.5.3 Assumptions
3 Market Trend Analysis
3.1 Introduction
3.2 Drivers
3.3 Restraints
3.4 Opportunities
3.5 Threats
3.6 End User Analysis
3.7 Emerging Markets
3.8 Impact of Covid-19
4 Porters Five Force Analysis
4.1 Bargaining power of suppliers
4.2 Bargaining power of buyers
4.3 Threat of substitutes
4.4 Threat of new entrants
4.5 Competitive rivalry
5 Global Graphic Processor Market, By Type
5.1 Introduction
5.2 Hardware
5.2.1 Dedicated
5.2.2 Integrated
5.2.3 Hybrid
5.3 Software
5.3.1 CAD/CAM
5.3.2 Simulation
5.3.3 Imaging
5.3.4 Digital video
5.3.5 Modeling and animation
5.3.6 Others Softwares
5.4 Service
5.4.1 Training & consulting
5.4.2 Integration & maintenance
5.4.3 Managed service
5.4.4 Other Services
5.5 Device
5.5.1 Computer
5.5.2 Tablet
5.5.3 Smartphone
5.5.4 Gaming Console
5.5.5 Television
5.5.6 Other Devices
5.6 Other Types
6 Global Graphic Processor Market, By End User
6.1 Introduction
6.2 Electronics
6.3 IT & Telecommunication
6.4 Defense & Intelligence
6.5 Media & Entertainment
6.6 Automotive
6.7 Other End Users
7 Global Graphic Processor Market, By Geography
7.1 Introduction
7.2 North America
7.2.1 US
7.2.2 Canada
7.2.3 Mexico
7.3 Europe
7.3.1 Germany
7.3.2 UK
7.3.3 Italy
7.3.4 France
7.3.5 Spain
7.3.6 Rest of Europe
7.4 Asia Pacific
7.4.1 Japan
7.4.2 China
7.4.3 India
7.4.4 Australia
7.4.5 New Zealand
7.4.6 South Korea
7.4.7 Rest of Asia Pacific
7.5 South America
7.5.1 Argentina
7.5.2 Brazil
7.5.3 Chile
7.5.4 Rest of South America
7.6 Middle East & Africa
7.6.1 Saudi Arabia
7.6.2 UAE
7.6.3 Qatar
7.6.4 South Africa
7.6.5 Rest of Middle East & Africa
8 Key Developments
8.1 Agreements, Partnerships, Collaborations and Joint Ventures
8.2 Acquisitions & Mergers
8.3 New Product Launch
8.4 Expansions
8.5 Other Key Strategies
9 Company Profiling
9.1 Advanced Micro Devices, Inc. (AMD)
9.2 Amazon Web Services, Inc
9.3 Autodesk
9.4 Dassault Systems, Inc.,
9.5 Google Inc.
9.6 IBM
9.7 Imagination Technologies
9.8 Intel Corporation
9.9 Matrox Electronic Systems Ltd.
9.10 Microsoft Corporation
9.11 NVIDIA Corporation
9.12 Qualcomm Incorporated
9.13 Samsung Electronics Co., Ltd.
9.14 Siemens AG
9.15 Sony Corporation
9.16 VIA Technologies, Inc.
List of Tables
1 Global Graphic Processor Market Outlook, By Region (2021-2030) ($MN)
2 Global Graphic Processor Market Outlook, By Type (2021-2030) ($MN)
3 Global Graphic Processor Market Outlook, By Hardware (2021-2030) ($MN)
4 Global Graphic Processor Market Outlook, By Dedicated (2021-2030) ($MN)
5 Global Graphic Processor Market Outlook, By Integrated (2021-2030) ($MN)
6 Global Graphic Processor Market Outlook, By Hybrid (2021-2030) ($MN)
7 Global Graphic Processor Market Outlook, By Software (2021-2030) ($MN)
8 Global Graphic Processor Market Outlook, By CAD/CAM (2021-2030) ($MN)
9 Global Graphic Processor Market Outlook, By Simulation (2021-2030) ($MN)
10 Global Graphic Processor Market Outlook, By Imaging (2021-2030) ($MN)
11 Global Graphic Processor Market Outlook, By Digital video (2021-2030) ($MN)
12 Global Graphic Processor Market Outlook, By Modeling and animation (2021-2030) ($MN)
13 Global Graphic Processor Market Outlook, By Others Softwares (2021-2030) ($MN)
14 Global Graphic Processor Market Outlook, By Service (2021-2030) ($MN)
15 Global Graphic Processor Market Outlook, By Training & consulting (2021-2030) ($MN)
16 Global Graphic Processor Market Outlook, By Integration & maintenance (2021-2030) ($MN)
17 Global Graphic Processor Market Outlook, By Managed service (2021-2030) ($MN)
18 Global Graphic Processor Market Outlook, By Other Services (2021-2030) ($MN)
19 Global Graphic Processor Market Outlook, By Device (2021-2030) ($MN)
20 Global Graphic Processor Market Outlook, By Computer (2021-2030) ($MN)
21 Global Graphic Processor Market Outlook, By Tablet (2021-2030) ($MN)
22 Global Graphic Processor Market Outlook, By Smartphone (2021-2030) ($MN)
23 Global Graphic Processor Market Outlook, By Gaming Console (2021-2030) ($MN)
24 Global Graphic Processor Market Outlook, By Television (2021-2030) ($MN)
25 Global Graphic Processor Market Outlook, By Other Devices (2021-2030) ($MN)
26 Global Graphic Processor Market Outlook, By Other Types (2021-2030) ($MN)
27 Global Graphic Processor Market Outlook, By End User (2021-2030) ($MN)
28 Global Graphic Processor Market Outlook, By Electronics (2021-2030) ($MN)
29 Global Graphic Processor Market Outlook, By IT & Telecommunication (2021-2030) ($MN)
30 Global Graphic Processor Market Outlook, By Defense & Intelligence (2021-2030) ($MN)
31 Global Graphic Processor Market Outlook, By Media & Entertainment (2021-2030) ($MN)
32 Global Graphic Processor Market Outlook, By Automotive (2021-2030) ($MN)
33 Global Graphic Processor Market Outlook, By Other End Users (2021-2030) ($MN)
Note: Tables for North America, Europe, APAC, South America, and Middle East & Africa Regions are also represented in the same manner as above.
List of Figures
RESEARCH METHODOLOGY

We at ‘Stratistics’ opt for an extensive research approach which involves data mining, data validation, and data analysis. The various research sources include in-house repository, secondary research, competitor’s sources, social media research, client internal data, and primary research.
Our team of analysts prefers the most reliable and authenticated data sources in order to perform the comprehensive literature search. With access to most of the authenticated data bases our team highly considers the best mix of information through various sources to obtain extensive and accurate analysis.
Each report takes an average time of a month and a team of 4 industry analysts. The time may vary depending on the scope and data availability of the desired market report. The various parameters used in the market assessment are standardized in order to enhance the data accuracy.
Data Mining
The data is collected from several authenticated, reliable, paid and unpaid sources and is filtered depending on the scope & objective of the research. Our reports repository acts as an added advantage in this procedure. Data gathering from the raw material suppliers, distributors and the manufacturers is performed on a regular basis, this helps in the comprehensive understanding of the products value chain. Apart from the above mentioned sources the data is also collected from the industry consultants to ensure the objective of the study is in the right direction.
Market trends such as technological advancements, regulatory affairs, market dynamics (Drivers, Restraints, Opportunities and Challenges) are obtained from scientific journals, market related national & international associations and organizations.
Data Analysis
From the data that is collected depending on the scope & objective of the research the data is subjected for the analysis. The critical steps that we follow for the data analysis include:
- Product Lifecycle Analysis
- Competitor analysis
- Risk analysis
- Porters Analysis
- PESTEL Analysis
- SWOT Analysis
The data engineering is performed by the core industry experts considering both the Marketing Mix Modeling and the Demand Forecasting. The marketing mix modeling makes use of multiple-regression techniques to predict the optimal mix of marketing variables. Regression factor is based on a number of variables and how they relate to an outcome such as sales or profits.
Data Validation
The data validation is performed by the exhaustive primary research from the expert interviews. This includes telephonic interviews, focus groups, face to face interviews, and questionnaires to validate our research from all aspects. The industry experts we approach come from the leading firms, involved in the supply chain ranging from the suppliers, distributors to the manufacturers and consumers so as to ensure an unbiased analysis.
We are in touch with more than 15,000 industry experts with the right mix of consultants, CEO's, presidents, vice presidents, managers, experts from both supply side and demand side, executives and so on.
The data validation involves the primary research from the industry experts belonging to:
- Leading Companies
- Suppliers & Distributors
- Manufacturers
- Consumers
- Industry/Strategic Consultants
Apart from the data validation the primary research also helps in performing the fill gap research, i.e. providing solutions for the unmet needs of the research which helps in enhancing the reports quality.
For more details about research methodology, kindly write to us at info@strategymrc.com
Frequently Asked Questions
In case of any queries regarding this report, you can contact the customer service by filing the “Inquiry Before Buy” form available on the right hand side. You may also contact us through email: info@strategymrc.com or phone: +1-301-202-5929
Yes, the samples are available for all the published reports. You can request them by filling the “Request Sample” option available in this page.
Yes, you can request a sample with your specific requirements. All the customized samples will be provided as per the requirement with the real data masked.
All our reports are available in Digital PDF format. In case if you require them in any other formats, such as PPT, Excel etc you can submit a request through “Inquiry Before Buy” form available on the right hand side. You may also contact us through email: info@strategymrc.com or phone: +1-301-202-5929
We offer a free 15% customization with every purchase. This requirement can be fulfilled for both pre and post sale. You may send your customization requirements through email at info@strategymrc.com or call us on +1-301-202-5929.
We have 3 different licensing options available in electronic format.
- Single User Licence: Allows one person, typically the buyer, to have access to the ordered product. The ordered product cannot be distributed to anyone else.
- 2-5 User Licence: Allows the ordered product to be shared among a maximum of 5 people within your organisation.
- Corporate License: Allows the product to be shared among all employees of your organisation regardless of their geographical location.
All our reports are typically be emailed to you as an attachment.
To order any available report you need to register on our website. The payment can be made either through CCAvenue or PayPal payments gateways which accept all international cards.
We extend our support to 6 months post sale. A post sale customization is also provided to cover your unmet needs in the report.
Request Customization
We offer complimentary customization of up to 15% with every purchase. To share your customization requirements, feel free to email us at info@strategymrc.com or call us on +1-301-202-5929. .
Please Note: Customization within the 15% threshold is entirely free of charge. If your request exceeds this limit, we will conduct a feasibility assessment. Following that, a detailed quote and timeline will be provided.
WHY CHOOSE US ?

Assured Quality
Best in class reports with high standard of research integrity

24X7 Research Support
Continuous support to ensure the best customer experience.

Free Customization
Adding more values to your product of interest.

Safe & Secure Access
Providing a secured environment for all online transactions.

Trusted by 600+ Brands
Serving the most reputed brands across the world.