
Green Cement Market
Green Cement Market Forecasts to 2028 – Global Analysis By Product Type (Limestone-Based, Fly Ash-Based, Silica Fume-Based), Application (Repair & Maintenance Activities, New Constructions Activities, Bridges and Roads), End User (Non-Residential, Residential, Infrastructure), and By Geography

|
Years Covered |
2020-2028 |
|
Estimated Year Value (2021) |
US $24.54 BN |
|
Projected Year Value (2028) |
US $51.28 BN |
|
CAGR (2021 - 2028) |
11.1% |
|
Regions Covered |
North America, Europe, Asia Pacific, South America, and Middle East & Africa |
|
Countries Covered |
US, Canada, Mexico, Germany, UK, Italy, France, Spain, Japan, China, India, Australia, New Zealand, South Korea, Rest of Asia Pacific, South America, Argentina, Brazil, Chile, Middle East & Africa, Saudi Arabia, UAE, Qatar, and South Africa |
|
Largest Market |
North America |
|
Fastest Growing Market |
Asia Pacific |
According to Stratistics MRC, the Global Green Cement Market is accounted for $24.54 billion in 2021 and is expected to reach $51.28 billion by 2028 growing at a CAGR of 11.1% during the forecast period. Green cement refers to an eco-friendly and clean substitute for conventional cement. It possesses high impact and compressive strength, good bearing strength, resistance to thawing and freezing, endurance towards chemical attack & abrasion, and low moisture penetrability. It is manufactured using a carbon-negative process that employs various industrial by-products and waste materials, such as fly ash, silica fume, aluminosilicates, recycled concrete aggregates, aluminum can fibers, and blast furnace slag.
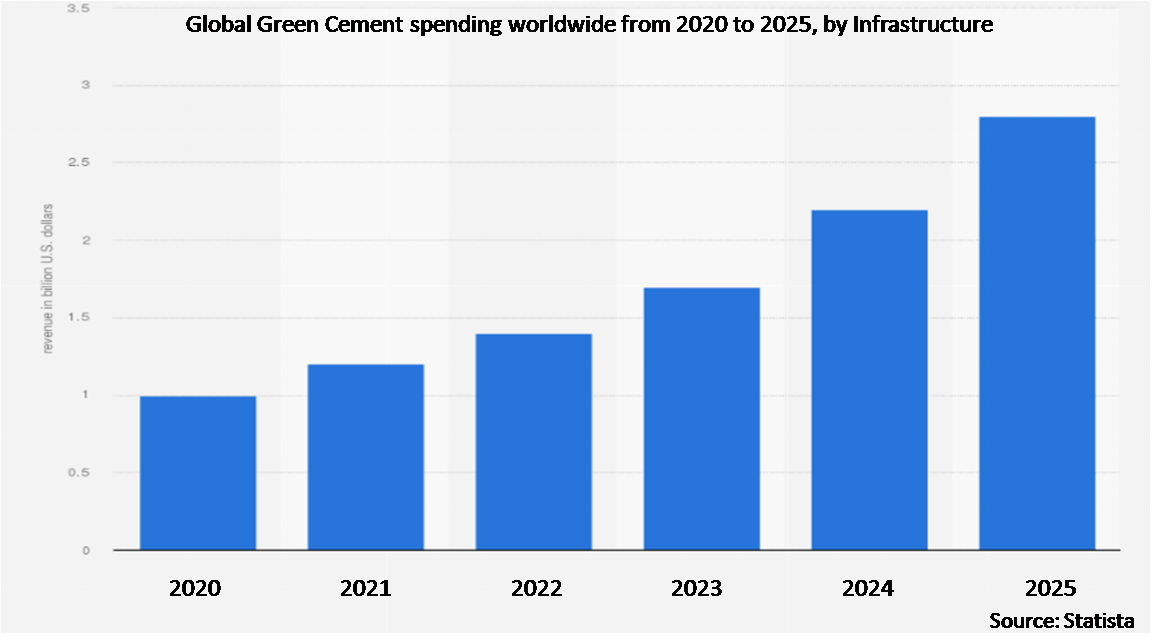
The demand for cement industry is primarily driven by the housing sector (about 68% including low cost affordable housing). Industrial and Infrastructure contributes to 10% and 22% of the demand respectively. The thrust provided by the government in the form of spending on infrastructure such as construction of roads, railways, highways, rural and low cost affordable infrastructure augurs well for the industry. The demand of cement industry is expected to reach 550-600 MT per annum (MTPA) by 2025 because of the expanding demand of different sectors, i.e., housing, commercial construction, and industrial construction. India’s overall cement production accounted for approximately 262 million tonnes (MT) in FY21. The cement production is expected to increase by 10% to 12% and the utilization is expected around 65% in FY22.
Market Dynamics:
Driver:
Growing demand for sustainable construction materials
Limited availability of raw materials, depletion of natural fuel resources, and rising cement demand and environmental concerns are acting as challenges for the cement industry which leads to boost the demand for alternative fuels from renewable energy resources and supporting recycling of waste materials. It is estimated that for the production of every ton of OPC, an equal amount of carbon dioxide gets released into the atmosphere. The energy requirement during the production of OPC can be reduced with cement manufactured from locally available minerals and industrial wastes. These can be blended with OPC either as a substitute or can be fully replaced with novel clinkers. Green cement minimizes carbon footprint of cement production by 40%. The emission of carbon dioxide with the help of green cement can be limited to 30% or even less in comparison to the conventional methods. Increasing initiatives regarding the construction of green buildings and demand for sustainable cements for green building construction are expected to increase the utilization of green cement.
Restraint:
High investments required for the production of green cement
High savings required for the fabrication of green cement is anticipated to unfavourably affect the market growth. The risk allied with investment in an innovative product or production technology is preventing manufacturers as well as consumers from investing in green cement. Set-up and production costs for green cement are relatively higher than that for production of OPC. In addition, lack of awareness regarding the product in the construction sector a number of countries and among many consumers is also adversely affecting demand. Since the product is at an early stage of development, many companies are increasingly investing in research and development activities to produce more advanced and effective product, which could further minimize carbon footprint of cement production.
Opportunity:
Applications of green cement in residential sector generates opportunities
The global market is majorly driven by factors such as fast urbanization in developing countries and increasing demand for single homes, etc. Green cement is an excellent substitute for Ordinary Portland Cement (OPC), due to its higher thermal insulation and fire resistance properties. There is an increasing demand for green cement from growing construction and development activities in emerging activities. Structures built using green cement can withstand with temperatures upto 2400F. Green cement is a material produced from industrial wastes, burnt clay, slag, power plant wastes, recycled concrete, etc. In addition, green cement is popularly used in various building & construction projects, as it provides excellent resistance to alkali attack during weather change. This factor is expected to show lucrative opportunities for manufacturers operating in the green cement market.
Threat:
Less life
Structures which are constructed using green concrete have less life than the structures constructed by the conventional concrete. As they have less life span they cannot be used for important structures like bridges, dams etc. For the use in dams and bridges special air-entraining agents are mixed in the concrete which increases the overall cost of the structures. Moreover, split tensile strength of green cement is less due to which more reinforcements are needed, which increases the construction cost of the structure.
The fly ash-based segment is expected to be the largest during the forecast period
The fly ash-based segment is estimated to have a lucrative growth, due to increasing consumption of sustainable cement owing to rising construction activities in developing countries and favourable government policies. Fly ash is finely divided residue resulting from the combustion of powdered coal and transported by flue and noxious gases and collected by electrostatic precipitation. It is most used pozzolanic material all over the world. According to World Bank, the volume of fly ash produced is about 75 million tons per year. It improves both fresh concrete and hardened concrete properties of hydraulic cement concrete. The fly ash type utilized is limited to Class-F and Class-C types. Moreover, rise in demand for alternative fuels from recycling of waste and renewable resources to prevent excess amount of carbon dioxide released by OPC is increasing demand for fly ash.
The commercial segment is expected to have the highest CAGR during the forecast period
The commercial segment is anticipated to witness the fastest CAGR growth during the forecast period due to the improvements in the burgeoning construction industry and increase in its application in commercial establishments such as office spaces, shopping malls, theaters, and hospitals. Certain properties of cement, such as greater resistance to extreme weather conditions, compressive strength, and short setting time, are expected to boost the industry growth. Furthermore, construction activities are booming in several South Asian countries, including Thailand, India, Vietnam, China, and Thailand.
Region with highest share:
North America is projected to hold the largest market share during the forecast period owing to the stringent government regulations and fast urbanization and industrialization. The demand for new homes in the United States has been continuously increasing in recent years, owing to the country’s growing population and rising consumer incomes. The growth of new home development in the United States has also been fueled by a reduction in typical household sizes, with single-family housing rising at a rapid rate. The U.S. government provided many financing options at different levels including federal, state, and municipal levels to support the development of sustainable building environment. Tax incentives available for the construction of energy efficient commercial buildings and growing focus on green buildings by implementing The Green Building Incentive Program (GBIP) are expected to boost demand for green cement in the region.
Region with highest CAGR:
Asia Pacific is projected to have the highest CAGR over the forecast period owing to the powerful development of the car, bundling, and building and development businesses across China and India, rapid urbanization, and growth in the population. Developing economies particularly from the Asia Pacific region are the fastest growing infrastructure and construction markets propelled by high industrial growth rate where governments are spending extensively for public construction. Major companies in the region such as Navrattan Blue Crete Industries Pvt., Ltd, JSW Cement, Anhui Conch Cement Co., Ltd., China National Building Material Co., Ltd. (CNBM), are increasingly investing in the research and development (R&D) activities in order to produce stronger, sustainable, durable, and cost-effective construction material. For instance, the Chinese construction industry has witnessed a remarkable growth in the recent years. Ever since the Belt and road initiative, Chinese contractors had actively invested in numerous infrastructure projects including around 20,000 construction contracts along with the belt and road initiative globally.

Key players in the market
Some of the key players profiled in the Green Cement Market include Schneider Electric, Calera Capital, Kiran Global Chems Ltd, Navrattan Group, JSW Cement, Taiheiyo Cement Corporation, The Dow Chemical Company, HeidelbergCement AG, UltraTech Cement Ltd., BASF SE, CeraTech Inc, Pidilite Industries, Rpm International Inc., Sika Corporation, Solidia Technologies, CarbonCure Technologies Inc., Maipei Ltd, and CICO Technologies Ltd.
Key Developments:
In Dec 2020, UltraTech Cement Ltd., a subsidiary of the Aditya Birla Group, invested around USD 722 million to expand its capacity to 12.8 million tonnes per annum through a combination of brownfield and greenfield expansion. This expansion includes a 6.7 mtpa capacity expansion in Uttar Pradesh, Odisha, Bihar, West Bengal, and a cement plant in Pali, Rajasthan.
In Apr 2020, Navrattan Group announced that they are about to launch their green cement in the Indian market. This step will help them to cover substantial grounds in the coming years as the rising awareness regarding eco-friendly products are expected to provide tailwinds. The product has no limestone owing to which there is no requirement for the energy-extensive calcination process. The product also uses reusable materials as major components, which boosts its presence as an eco-friendly material.
In November 2018, JSW Cement, India’s one of the leading producer of green cement, announced the launch of an improved version of its flagship cement product ‘Concreel HD’ in Maharashtra, which is comes with enhanced properties that improve strength & durability.
In January 2016, Kiran Global Chems Ltd, a part of M S Jain Group, launched an environment-friendly green cement, branded “Geocement”, using patented technology. According to Company, using this product will help to save water, reduce emission of carbon dioxide as well as cut down on construction time.
Product Types Covered:
• Limestone-Based
• Fly Ash-Based
• Silica Fume-Based
• Blast Furnace Slag Based
• Geopolymer-Based
• Recycled Aggregates
Applications Covered:
• Repair & Maintenance Activities
• New Constructions Activities
• Bridges and Roads
• Mass Construction
End Users Covered:
• Non-Residential
• Residential
• Infrastructure
Regions Covered:
• North America
o US
o Canada
o Mexico
• Europe
o Germany
o UK
o Italy
o France
o Spain
o Rest of Europe
• Asia Pacific
o Japan
o China
o India
o Australia
o New Zealand
o South Korea
o Rest of Asia Pacific
• South America
o Argentina
o Brazil
o Chile
o Rest of South America
• Middle East & Africa
o Saudi Arabia
o UAE
o Qatar
o South Africa
o Rest of Middle East & Africa
What our report offers:
- Market share assessments for the regional and country-level segments
- Strategic recommendations for the new entrants
- Covers Market data for the years 2020, 2021, 2022, 2025, and 2028
- Market Trends (Drivers, Constraints, Opportunities, Threats, Challenges, Investment Opportunities, and recommendations)
- Strategic recommendations in key business segments based on the market estimations
- Competitive landscaping mapping the key common trends
- Company profiling with detailed strategies, financials, and recent developments
- Supply chain trends mapping the latest technological advancements
Free Customization Offerings:
All the customers of this report will be entitled to receive one of the following free customization options:
• Company Profiling
o Comprehensive profiling of additional market players (up to 3)
o SWOT Analysis of key players (up to 3)
• Regional Segmentation
o Market estimations, Forecasts and CAGR of any prominent country as per the client's interest (Note: Depends on feasibility check)
• Competitive Benchmarking
o Benchmarking of key players based on product portfolio, geographical presence, and strategic alliances
Table of Contents
1 Executive Summary
2 Preface
2.1 Abstract
2.2 Stake Holders
2.3 Research Scope
2.4 Research Methodology
2.4.1 Data Mining
2.4.2 Data Analysis
2.4.3 Data Validation
2.4.4 Research Approach
2.5 Research Sources
2.5.1 Primary Research Sources
2.5.2 Secondary Research Sources
2.5.3 Assumptions
3 Market Trend Analysis
3.1 Introduction
3.2 Drivers
3.3 Restraints
3.4 Opportunities
3.5 Threats
3.6 Product Analysis
3.7 Application Analysis
3.8 End User Analysis
3.9 Emerging Markets
3.10 Impact of Covid-19
4 Porters Five Force Analysis
4.1 Bargaining power of suppliers
4.2 Bargaining power of buyers
4.3 Threat of substitutes
4.4 Threat of new entrants
4.5 Competitive rivalry
5 Global Green Cement Market, By Product Type
5.1 Introduction
5.2 Limestone-Based
5.3 Fly Ash-Based
5.3.1 Class C
5.3.2 Class F
5.4 Silica Fume-Based
5.5 Blast Furnace Slag Based
5.6 Geopolymer-Based
5.7 Recycled Aggregates
6 Global Green Cement Market, By Application
6.1 Introduction
6.2 Repair & Maintenance Activities
6.3 New Constructions Activities
6.4 Bridges and Roads
6.5 Mass Construction
7 Global Green Cement Market, By End User
7.1 Introduction
7.2 Non-Residential
7.2.1 Industrial
7.2.2 Commercial
7.3 Residential
7.4 Infrastructure
8 Global Green Cement Market, By Geography
8.1 Introduction
8.2 North America
8.2.1 US
8.2.2 Canada
8.2.3 Mexico
8.3 Europe
8.3.1 Germany
8.3.2 UK
8.3.3 Italy
8.3.4 France
8.3.5 Spain
8.3.6 Rest of Europe
8.4 Asia Pacific
8.4.1 Japan
8.4.2 China
8.4.3 India
8.4.4 Australia
8.4.5 New Zealand
8.4.6 South Korea
8.4.7 Rest of Asia Pacific
8.5 South America
8.5.1 Argentina
8.5.2 Brazil
8.5.3 Chile
8.5.4 Rest of South America
8.6 Middle East & Africa
8.6.1 Saudi Arabia
8.6.2 UAE
8.6.3 Qatar
8.6.4 South Africa
8.6.5 Rest of Middle East & Africa
9 Key Developments
9.1 Agreements, Partnerships, Collaborations and Joint Ventures
9.2 Acquisitions & Mergers
9.3 New Product Launch
9.4 Expansions
9.5 Other Key Strategies
10 Company Profiling
10.1 Schneider Electric
10.2 Calera Capital
10.3 Kiran Global Chems Ltd
10.4 Navrattan Group
10.5 JSW Cement
10.6 Taiheiyo Cement Corporation
10.7 The Dow Chemical Company
10.8 HeidelbergCement AG
10.9 UltraTech Cement Ltd.
10.10 BASF SE
10.11 CeraTech Inc
10.12 Pidilite Industries
10.13 Rpm International Inc.
10.14 Sika Corporation
10.15 Solidia Technologies
10.16 CarbonCure Technologies Inc.
10.17 Maipei Ltd
10.18 CICO Technologies Ltd.
List of Tables
1 Global Green Cement Market Outlook, By Region (2020-2028) ($MN)
2 Global Green Cement Market Outlook, By Product Type (2020-2028) ($MN)
3 Global Green Cement Market Outlook, By Limestone-Based (2020-2028) ($MN)
4 Global Green Cement Market Outlook, By Fly Ash-Based (2020-2028) ($MN)
5 Global Green Cement Market Outlook, By Class C (2020-2028) ($MN)
6 Global Green Cement Market Outlook, By Class F (2020-2028) ($MN)
7 Global Green Cement Market Outlook, By Silica Fume-Based (2020-2028) ($MN)
8 Global Green Cement Market Outlook, By Blast Furnace Slag Based (2020-2028) ($MN)
9 Global Green Cement Market Outlook, By Geopolymer-Based (2020-2028) ($MN)
10 Global Green Cement Market Outlook, By Recycled Aggregates (2020-2028) ($MN)
11 Global Green Cement Market Outlook, By Application (2020-2028) ($MN)
12 Global Green Cement Market Outlook, By Repair & Maintenance Activities (2020-2028) ($MN)
13 Global Green Cement Market Outlook, By New Constructions Activities (2020-2028) ($MN)
14 Global Green Cement Market Outlook, By Bridges and Roads (2020-2028) ($MN)
15 Global Green Cement Market Outlook, By Mass Construction (2020-2028) ($MN)
16 Global Green Cement Market Outlook, By End User (2020-2028) ($MN)
17 Global Green Cement Market Outlook, By Non-Residential (2020-2028) ($MN)
18 Global Green Cement Market Outlook, By Industrial (2020-2028) ($MN)
19 Global Green Cement Market Outlook, By Commercial (2020-2028) ($MN)
20 Global Green Cement Market Outlook, By Residential (2020-2028) ($MN)
21 Global Green Cement Market Outlook, By Infrastructure (2020-2028) ($MN)
22 North America Green Cement Market Outlook, By Country (2020-2028) ($MN)
23 North America Green Cement Market Outlook, By Product Type (2020-2028) ($MN)
24 North America Green Cement Market Outlook, By Limestone-Based (2020-2028) ($MN)
25 North America Green Cement Market Outlook, By Fly Ash-Based (2020-2028) ($MN)
26 North America Green Cement Market Outlook, By Class C (2020-2028) ($MN)
27 North America Green Cement Market Outlook, By Class F (2020-2028) ($MN)
28 North America Green Cement Market Outlook, By Silica Fume-Based (2020-2028) ($MN)
29 North America Green Cement Market Outlook, By Blast Furnace Slag Based (2020-2028) ($MN)
30 North America Green Cement Market Outlook, By Geopolymer-Based (2020-2028) ($MN)
31 North America Green Cement Market Outlook, By Recycled Aggregates (2020-2028) ($MN)
32 North America Green Cement Market Outlook, By Application (2020-2028) ($MN)
33 North America Green Cement Market Outlook, By Repair & Maintenance Activities (2020-2028) ($MN)
34 North America Green Cement Market Outlook, By New Constructions Activities (2020-2028) ($MN)
35 North America Green Cement Market Outlook, By Bridges and Roads (2020-2028) ($MN)
36 North America Green Cement Market Outlook, By Mass Construction (2020-2028) ($MN)
37 North America Green Cement Market Outlook, By End User (2020-2028) ($MN)
38 North America Green Cement Market Outlook, By Non-Residential (2020-2028) ($MN)
39 North America Green Cement Market Outlook, By Industrial (2020-2028) ($MN)
40 North America Green Cement Market Outlook, By Commercial (2020-2028) ($MN)
41 North America Green Cement Market Outlook, By Residential (2020-2028) ($MN)
42 North America Green Cement Market Outlook, By Infrastructure (2020-2028) ($MN)
43 Europe Green Cement Market Outlook, By Country (2020-2028) ($MN)
44 Europe Green Cement Market Outlook, By Product Type (2020-2028) ($MN)
45 Europe Green Cement Market Outlook, By Limestone-Based (2020-2028) ($MN)
46 Europe Green Cement Market Outlook, By Fly Ash-Based (2020-2028) ($MN)
47 Europe Green Cement Market Outlook, By Class C (2020-2028) ($MN)
48 Europe Green Cement Market Outlook, By Class F (2020-2028) ($MN)
49 Europe Green Cement Market Outlook, By Silica Fume-Based (2020-2028) ($MN)
50 Europe Green Cement Market Outlook, By Blast Furnace Slag Based (2020-2028) ($MN)
51 Europe Green Cement Market Outlook, By Geopolymer-Based (2020-2028) ($MN)
52 Europe Green Cement Market Outlook, By Recycled Aggregates (2020-2028) ($MN)
53 Europe Green Cement Market Outlook, By Application (2020-2028) ($MN)
54 Europe Green Cement Market Outlook, By Repair & Maintenance Activities (2020-2028) ($MN)
55 Europe Green Cement Market Outlook, By New Constructions Activities (2020-2028) ($MN)
56 Europe Green Cement Market Outlook, By Bridges and Roads (2020-2028) ($MN)
57 Europe Green Cement Market Outlook, By Mass Construction (2020-2028) ($MN)
58 Europe Green Cement Market Outlook, By End User (2020-2028) ($MN)
59 Europe Green Cement Market Outlook, By Non-Residential (2020-2028) ($MN)
60 Europe Green Cement Market Outlook, By Industrial (2020-2028) ($MN)
61 Europe Green Cement Market Outlook, By Commercial (2020-2028) ($MN)
62 Europe Green Cement Market Outlook, By Residential (2020-2028) ($MN)
63 Europe Green Cement Market Outlook, By Infrastructure (2020-2028) ($MN)
64 Asia Pacific Green Cement Market Outlook, By Country (2020-2028) ($MN)
65 Asia Pacific Green Cement Market Outlook, By Product Type (2020-2028) ($MN)
66 Asia Pacific Green Cement Market Outlook, By Limestone-Based (2020-2028) ($MN)
67 Asia Pacific Green Cement Market Outlook, By Fly Ash-Based (2020-2028) ($MN)
68 Asia Pacific Green Cement Market Outlook, By Class C (2020-2028) ($MN)
69 Asia Pacific Green Cement Market Outlook, By Class F (2020-2028) ($MN)
70 Asia Pacific Green Cement Market Outlook, By Silica Fume-Based (2020-2028) ($MN)
71 Asia Pacific Green Cement Market Outlook, By Blast Furnace Slag Based (2020-2028) ($MN)
72 Asia Pacific Green Cement Market Outlook, By Geopolymer-Based (2020-2028) ($MN)
73 Asia Pacific Green Cement Market Outlook, By Recycled Aggregates (2020-2028) ($MN)
74 Asia Pacific Green Cement Market Outlook, By Application (2020-2028) ($MN)
75 Asia Pacific Green Cement Market Outlook, By Repair & Maintenance Activities (2020-2028) ($MN)
76 Asia Pacific Green Cement Market Outlook, By New Constructions Activities (2020-2028) ($MN)
77 Asia Pacific Green Cement Market Outlook, By Bridges and Roads (2020-2028) ($MN)
78 Asia Pacific Green Cement Market Outlook, By Mass Construction (2020-2028) ($MN)
79 Asia Pacific Green Cement Market Outlook, By End User (2020-2028) ($MN)
80 Asia Pacific Green Cement Market Outlook, By Non-Residential (2020-2028) ($MN)
81 Asia Pacific Green Cement Market Outlook, By Industrial (2020-2028) ($MN)
82 Asia Pacific Green Cement Market Outlook, By Commercial (2020-2028) ($MN)
83 Asia Pacific Green Cement Market Outlook, By Residential (2020-2028) ($MN)
84 Asia Pacific Green Cement Market Outlook, By Infrastructure (2020-2028) ($MN)
85 South America Green Cement Market Outlook, By Country (2020-2028) ($MN)
86 South America Green Cement Market Outlook, By Product Type (2020-2028) ($MN)
87 South America Green Cement Market Outlook, By Limestone-Based (2020-2028) ($MN)
88 South America Green Cement Market Outlook, By Fly Ash-Based (2020-2028) ($MN)
89 South America Green Cement Market Outlook, By Class C (2020-2028) ($MN)
90 South America Green Cement Market Outlook, By Class F (2020-2028) ($MN)
91 South America Green Cement Market Outlook, By Silica Fume-Based (2020-2028) ($MN)
92 South America Green Cement Market Outlook, By Blast Furnace Slag Based (2020-2028) ($MN)
93 South America Green Cement Market Outlook, By Geopolymer-Based (2020-2028) ($MN)
94 South America Green Cement Market Outlook, By Recycled Aggregates (2020-2028) ($MN)
95 South America Green Cement Market Outlook, By Application (2020-2028) ($MN)
96 South America Green Cement Market Outlook, By Repair & Maintenance Activities (2020-2028) ($MN)
97 South America Green Cement Market Outlook, By New Constructions Activities (2020-2028) ($MN)
98 South America Green Cement Market Outlook, By Bridges and Roads (2020-2028) ($MN)
99 South America Green Cement Market Outlook, By Mass Construction (2020-2028) ($MN)
100 South America Green Cement Market Outlook, By End User (2020-2028) ($MN)
101 South America Green Cement Market Outlook, By Non-Residential (2020-2028) ($MN)
102 South America Green Cement Market Outlook, By Industrial (2020-2028) ($MN)
103 South America Green Cement Market Outlook, By Commercial (2020-2028) ($MN)
104 South America Green Cement Market Outlook, By Residential (2020-2028) ($MN)
105 South America Green Cement Market Outlook, By Infrastructure (2020-2028) ($MN)
106 Middle East & Africa Green Cement Market Outlook, By Country (2020-2028) ($MN)
107 Middle East & Africa Green Cement Market Outlook, By Product Type (2020-2028) ($MN)
108 Middle East & Africa Green Cement Market Outlook, By Limestone-Based (2020-2028) ($MN)
109 Middle East & Africa Green Cement Market Outlook, By Fly Ash-Based (2020-2028) ($MN)
110 Middle East & Africa Green Cement Market Outlook, By Class C (2020-2028) ($MN)
111 Middle East & Africa Green Cement Market Outlook, By Class F (2020-2028) ($MN)
112 Middle East & Africa Green Cement Market Outlook, By Silica Fume-Based (2020-2028) ($MN)
113 Middle East & Africa Green Cement Market Outlook, By Blast Furnace Slag Based (2020-2028) ($MN)
114 Middle East & Africa Green Cement Market Outlook, By Geopolymer-Based (2020-2028) ($MN)
115 Middle East & Africa Green Cement Market Outlook, By Recycled Aggregates (2020-2028) ($MN)
116 Middle East & Africa Green Cement Market Outlook, By Application (2020-2028) ($MN)
117 Middle East & Africa Green Cement Market Outlook, By Repair & Maintenance Activities (2020-2028) ($MN)
118 Middle East & Africa Green Cement Market Outlook, By New Constructions Activities (2020-2028) ($MN)
119 Middle East & Africa Green Cement Market Outlook, By Bridges and Roads (2020-2028) ($MN)
120 Middle East & Africa Green Cement Market Outlook, By Mass Construction (2020-2028) ($MN)
121 Middle East & Africa Green Cement Market Outlook, By End User (2020-2028) ($MN)
122 Middle East & Africa Green Cement Market Outlook, By Non-Residential (2020-2028) ($MN)
123 Middle East & Africa Green Cement Market Outlook, By Industrial (2020-2028) ($MN)
124 Middle East & Africa Green Cement Market Outlook, By Commercial (2020-2028) ($MN)
125 Middle East & Africa Green Cement Market Outlook, By Residential (2020-2028) ($MN)
126 Middle East & Africa Green Cement Market Outlook, By Infrastructure (2020-2028) ($MN)
List of Figures
RESEARCH METHODOLOGY

We at ‘Stratistics’ opt for an extensive research approach which involves data mining, data validation, and data analysis. The various research sources include in-house repository, secondary research, competitor’s sources, social media research, client internal data, and primary research.
Our team of analysts prefers the most reliable and authenticated data sources in order to perform the comprehensive literature search. With access to most of the authenticated data bases our team highly considers the best mix of information through various sources to obtain extensive and accurate analysis.
Each report takes an average time of a month and a team of 4 industry analysts. The time may vary depending on the scope and data availability of the desired market report. The various parameters used in the market assessment are standardized in order to enhance the data accuracy.
Data Mining
The data is collected from several authenticated, reliable, paid and unpaid sources and is filtered depending on the scope & objective of the research. Our reports repository acts as an added advantage in this procedure. Data gathering from the raw material suppliers, distributors and the manufacturers is performed on a regular basis, this helps in the comprehensive understanding of the products value chain. Apart from the above mentioned sources the data is also collected from the industry consultants to ensure the objective of the study is in the right direction.
Market trends such as technological advancements, regulatory affairs, market dynamics (Drivers, Restraints, Opportunities and Challenges) are obtained from scientific journals, market related national & international associations and organizations.
Data Analysis
From the data that is collected depending on the scope & objective of the research the data is subjected for the analysis. The critical steps that we follow for the data analysis include:
- Product Lifecycle Analysis
- Competitor analysis
- Risk analysis
- Porters Analysis
- PESTEL Analysis
- SWOT Analysis
The data engineering is performed by the core industry experts considering both the Marketing Mix Modeling and the Demand Forecasting. The marketing mix modeling makes use of multiple-regression techniques to predict the optimal mix of marketing variables. Regression factor is based on a number of variables and how they relate to an outcome such as sales or profits.
Data Validation
The data validation is performed by the exhaustive primary research from the expert interviews. This includes telephonic interviews, focus groups, face to face interviews, and questionnaires to validate our research from all aspects. The industry experts we approach come from the leading firms, involved in the supply chain ranging from the suppliers, distributors to the manufacturers and consumers so as to ensure an unbiased analysis.
We are in touch with more than 15,000 industry experts with the right mix of consultants, CEO's, presidents, vice presidents, managers, experts from both supply side and demand side, executives and so on.
The data validation involves the primary research from the industry experts belonging to:
- Leading Companies
- Suppliers & Distributors
- Manufacturers
- Consumers
- Industry/Strategic Consultants
Apart from the data validation the primary research also helps in performing the fill gap research, i.e. providing solutions for the unmet needs of the research which helps in enhancing the reports quality.
For more details about research methodology, kindly write to us at info@strategymrc.com
Frequently Asked Questions
In case of any queries regarding this report, you can contact the customer service by filing the “Inquiry Before Buy” form available on the right hand side. You may also contact us through email: info@strategymrc.com or phone: +1-301-202-5929
Yes, the samples are available for all the published reports. You can request them by filling the “Request Sample” option available in this page.
Yes, you can request a sample with your specific requirements. All the customized samples will be provided as per the requirement with the real data masked.
All our reports are available in Digital PDF format. In case if you require them in any other formats, such as PPT, Excel etc you can submit a request through “Inquiry Before Buy” form available on the right hand side. You may also contact us through email: info@strategymrc.com or phone: +1-301-202-5929
We offer a free 15% customization with every purchase. This requirement can be fulfilled for both pre and post sale. You may send your customization requirements through email at info@strategymrc.com or call us on +1-301-202-5929.
We have 3 different licensing options available in electronic format.
- Single User Licence: Allows one person, typically the buyer, to have access to the ordered product. The ordered product cannot be distributed to anyone else.
- 2-5 User Licence: Allows the ordered product to be shared among a maximum of 5 people within your organisation.
- Corporate License: Allows the product to be shared among all employees of your organisation regardless of their geographical location.
All our reports are typically be emailed to you as an attachment.
To order any available report you need to register on our website. The payment can be made either through CCAvenue or PayPal payments gateways which accept all international cards.
We extend our support to 6 months post sale. A post sale customization is also provided to cover your unmet needs in the report.
Request Customization
We offer complimentary customization of up to 15% with every purchase. To share your customization requirements, feel free to email us at info@strategymrc.com or call us on +1-301-202-5929. .
Please Note: Customization within the 15% threshold is entirely free of charge. If your request exceeds this limit, we will conduct a feasibility assessment. Following that, a detailed quote and timeline will be provided.
WHY CHOOSE US ?

Assured Quality
Best in class reports with high standard of research integrity

24X7 Research Support
Continuous support to ensure the best customer experience.

Free Customization
Adding more values to your product of interest.

Safe & Secure Access
Providing a secured environment for all online transactions.

Trusted by 600+ Brands
Serving the most reputed brands across the world.