
Haying And Forage Equipment Market
Haying and Forage Equipment Market Forecasts to 2032 - Global Analysis By Equipment Type (Mowers, Balers, Tedders, Rakes, Forage Harvesters and Other Equipment Types), Operation (Semi-Automatic and Fully Automatic), Power Source, Application, End User and By Geography

|
Years Covered |
2024-2032 |
|
Estimated Year Value (2025) |
US $10.03 BN |
|
Projected Year Value (2032) |
US $15.18 BN |
|
CAGR (2025 - 2032) |
6.10% |
|
Regions Covered |
North America, Europe, Asia Pacific, South America, and Middle East & Africa |
|
Countries Covered |
US, Canada, Mexico, Germany, UK, Italy, France, Spain, Japan, China, India, Australia, New Zealand, South Korea, Rest of Asia Pacific, South America, Argentina, Brazil, Chile, Middle East & Africa, Saudi Arabia, UAE, Qatar, and South Africa |
|
Largest Market |
North America |
|
Highest Growing Market |
Asia Pacific |
According to Stratistics MRC, the Global Haying and Forage Equipment Market is accounted for $10.03 billion in 2025 and is expected to reach $15.18 billion by 2032 growing at a CAGR of 6.10% during the forecast period. Haying and forage equipment refers to a variety of agricultural tools that are essential for feeding livestock and are used for the harvesting, processing, and storage of forage crops, such as grass, alfalfa, and clover. Each of these pieces of equipment—mowers, tedders, rakes, balers, and forage harvesters—has a distinct function in the haymaking process, from cutting and drying to gathering and baling. Modern haying and forage equipment is made to be more efficient, save labor costs, and maintain the forage's nutritional value. Moreover, this equipment is crucial for contemporary dairy and livestock farming operations because of technological developments like automated controls and GPS integration that have further optimized operations.
According to the European agricultural machinery association (CEMA), volume sales of machinery are projected to decline by up to 10% this year.
Market Dynamics:
Driver:
Growing interest in livestock products
Dairy, beef, and other animal products are becoming more and more popular due to the world's population growth, urbanization, and rising incomes, especially in emerging economies. Livestock farmers require a steady and superior supply of forage crops like hay, alfalfa, and silage in order to meet this growing demand. In order to guarantee prompt harvesting, effective storage, and minimal nutritional loss, farmers are forced to rely on sophisticated haying and forage equipment. The health and productivity of livestock are directly supported by high-performance equipment, which guarantees that the forage is harvested at its highest nutritional value. Furthermore, as the livestock industry continues to grow, so does the market for haying and forage equipment.
Restraint:
Exorbitant startup and ownership expenses
The substantial initial outlay required to acquire sophisticated machinery is one of the main factors limiting the market for haying and forage equipment. Machines like precision mowers, round balers, and self-propelled forage harvesters demand large capital expenditures, frequently amounting to tens or even hundreds of thousands of dollars. Small and medium-sized farmers frequently cannot afford such costs without outside financial assistance, particularly in developing nations. The total cost of ownership also includes the purchase price plus additional expenses for fuel, maintenance, replacement parts, and skilled operator training. Additionally, these monetary barriers impede the rate of adoption, especially for cost-conscious users who might stick with manual or traditional approaches.
Opportunity:
Creation of personalized equipment for small and medium-sized farms
Although many developed markets are dominated by large-scale commercial farms, the majority of agricultural holdings worldwide are still small and medium-sized farms. For these smaller operations, there is an increasing demand for haying and forage equipment that is small, inexpensive, and simple to maintain. Businesses can take advantage of this underutilized market by creating machines that are modular, multipurpose, or have less horsepower. For instance, tractor-mounted mowers or small balers designed for fields smaller than 20 acres are growing in popularity. Manufacturers can establish a significant presence in this market by emphasizing flexibility in financing options and low-cost innovation.
Threat:
Increasing low-cost manufacturer competition
Manufacturers from nations with lower production costs, like China, India, and Turkey, are becoming more competitive in the global market. These businesses are appealing to price-conscious markets in Africa, Southeast Asia, and Latin America because they frequently provide comparable or basic-functional haying and forage equipment at much lower prices. Many small and medium-sized farmers rely on these inexpensive alternatives to meet their basic needs, even though they might not be as durable or technologically advanced as premium brands. Moreover, the market share and profitability of well-known brands are at risk due to this trend, which forces them to reduce prices or improve their value proposition.
Covid-19 Impact:
The market for haying and forage equipment was severely disrupted by the COVID-19 pandemic because it caused labour shortages, supply chain disruptions, and delayed equipment purchases because of the global economic uncertainty that farmers faced. Production and distribution of machinery components were hindered by lockdowns and transportation restrictions, which resulted in delays and higher manufacturing costs. Reduced on-farm labor availability also had an impact on timely harvesting operations, which in turn affected the need for replacement or new equipment. However, as farmers looked to maximize productivity with limited workforce access, the pandemic also accelerated the adoption of automation and precision agriculture technologies.
The PTO-driven (power take-off) segment is expected to be the largest during the forecast period
The PTO-driven (power take-off) segment is expected to account for the largest market share during the forecast period. PTO-driven machinery provides dependable and effective power transmission straight from tractors, which is why tractor-powered equipment is so common in haying and forage operations. Unlike hydraulic and electric power alternatives, PTO-driven systems are more adaptable, simpler to integrate with current farm equipment, and less expensive to operate. Moreover, their strong performance and versatility in different farming environments make them the go-to option for farmers, creating substantial market demand and maintaining their top spot in this market.
The silage segment is expected to have the highest CAGR during the forecast period
Over the forecast period, the silage segment is predicted to witness the highest growth rate. Increased use of silage techniques, which support higher livestock productivity due to their superior nutritional value and improved forage quality preservation, is what is driving this growth. Demand is further increased by improvements in silage-making machinery, such as harvesters and balers, which increase productivity and lower labor expenses. Additionally, the growing demand for silage in contemporary agriculture is also a result of growing awareness of sustainable farming methods and the requirement for year-round fodder availability.
Region with largest share:
During the forecast period, the North America region is expected to hold the largest market share. The region's vast agricultural infrastructure, high rates of adoption of cutting-edge farming technologies, and significant government support for agricultural mechanization are all factors contributing to its dominance. Due to its extensive livestock industry, large-scale farming operations, and emphasis on sustainable farming methods, the United States leads the market in particular. Furthermore, North America's dominant position in the market is further supported by the existence of significant producers of agricultural equipment and continuous technological advancements.
Region with highest CAGR:
Over the forecast period, the Asia Pacific region is anticipated to exhibit the highest CAGR. The expansion of livestock farming, growing agricultural mechanization, and encouraging government policies are the main drivers of this growth. To meet the rising demand for food and increase farm productivity, nations like China and India are making significant investments in modernizing their agricultural sectors. The adoption of sophisticated haying and forage machinery is being driven by the growing demand for high-quality forage in emerging economies. Moreover, the market in the area is distinguished by the growing accessibility of reasonably priced equipment, the development of better infrastructure, and the rising recognition of the advantages of mechanized agriculture.

Key players in the market
Some of the key players in Haying and Forage Equipment Market include Alamo Group Inc., John Deere & Company, Krone NA, Inc., AGCO Corporation, CNH Industrial N.V., Kubota Corporation, Vermeer Corporation, Buhler Industries Inc., Kuhn Group, Massey Ferguson Ltd., Claas KGaA, Hesston Corporation, Lely International N.V., Kverneland Group GmbH and Pöttinger Landtechnik GmbH.
Key Developments:
In May 2025, CNH Industrial N.V. CNH has inked a deal with Starlink, a SpaceX subsidiary, to deliver cutting-edge satellite connectivity to farmers. This collaboration will provide users of CNH’s brands, Case IH, New Holland and STEYR, with reliable and cost-effective high-speed connectivity, even in the most remote rural areas.
In July 2024, AGCO Corporation announced it has entered into a definitive agreement to sell the majority of its Grain & Protein business to American Industrial Partners (""AIP"") in an all-cash transaction valued at $700 million, subject to working capital and other customary closing adjustments.
In January 2024, Deere & Company announced it has entered into an agreement with SpaceX to provide cutting-edge satellite communications (SATCOM) service to farmers. Utilizing the industry-leading Starlink network, this solution will allow farmers facing rural connectivity challenges to fully leverage precision agriculture technologies.
Equipment Types Covered:
• Mowers
• Balers
• Tedders
• Rakes
• Forage Harvesters
• Other Equipment Types
Operations Covered:
• Semi-Automatic
• Fully Automatic
Power Sources Covered:
• PTO-Driven (Power Take-Off)
• Hydraulic Power
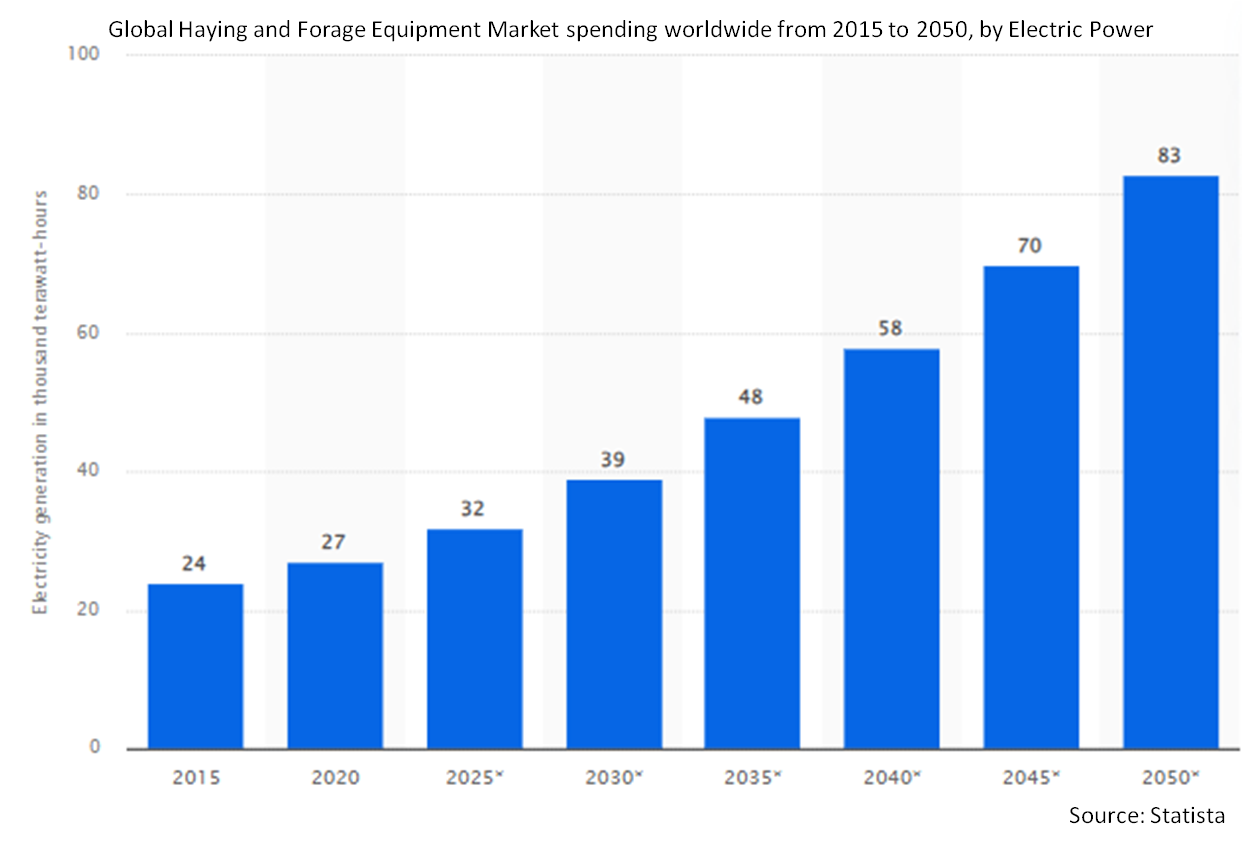
• Electric Power
Applications Covered:
• Hay
• Grass/Alfalfa
• Straw
• Silage
• Other Applications
End Users Covered:
• Livestock Farming
• Dairy Farming
• Forage Harvesting & Processing
• Other End Users
Regions Covered:
• North America
o US
o Canada
o Mexico
• Europe
o Germany
o UK
o Italy
o France
o Spain
o Rest of Europe
• Asia Pacific
o Japan
o China
o India
o Australia
o New Zealand
o South Korea
o Rest of Asia Pacific
• South America
o Argentina
o Brazil
o Chile
o Rest of South America
• Middle East & Africa
o Saudi Arabia
o UAE
o Qatar
o South Africa
o Rest of Middle East & Africa
What our report offers:
- Market share assessments for the regional and country-level segments
- Strategic recommendations for the new entrants
- Covers Market data for the years 2024, 2025, 2026, 2028, and 2032
- Market Trends (Drivers, Constraints, Opportunities, Threats, Challenges, Investment Opportunities, and recommendations)
- Strategic recommendations in key business segments based on the market estimations
- Competitive landscaping mapping the key common trends
- Company profiling with detailed strategies, financials, and recent developments
- Supply chain trends mapping the latest technological advancements
Free Customization Offerings:
All the customers of this report will be entitled to receive one of the following free customization options:
• Company Profiling
o Comprehensive profiling of additional market players (up to 3)
o SWOT Analysis of key players (up to 3)
• Regional Segmentation
o Market estimations, Forecasts and CAGR of any prominent country as per the client's interest (Note: Depends on feasibility check)
• Competitive Benchmarking
o Benchmarking of key players based on product portfolio, geographical presence, and strategic alliances
Table of Contents
1 Executive Summary
2 Preface
2.1 Abstract
2.2 Stake Holders
2.3 Research Scope
2.4 Research Methodology
2.4.1 Data Mining
2.4.2 Data Analysis
2.4.3 Data Validation
2.4.4 Research Approach
2.5 Research Sources
2.5.1 Primary Research Sources
2.5.2 Secondary Research Sources
2.5.3 Assumptions
3 Market Trend Analysis
3.1 Introduction
3.2 Drivers
3.3 Restraints
3.4 Opportunities
3.5 Threats
3.6 Application Analysis
3.7 End User Analysis
3.8 Emerging Markets
3.9 Impact of Covid-19
4 Porters Five Force Analysis
4.1 Bargaining power of suppliers
4.2 Bargaining power of buyers
4.3 Threat of substitutes
4.4 Threat of new entrants
4.5 Competitive rivalry
5 Global Haying and Forage Equipment Market, By Equipment Type
5.1 Introduction
5.2 Mowers
5.3 Balers
5.4 Tedders
5.5 Rakes
5.6 Forage Harvesters
5.7 Other Equipment Types
6 Global Haying and Forage Equipment Market, By Operation
6.1 Introduction
6.2 Semi-Automatic
6.3 Fully Automatic
7 Global Haying and Forage Equipment Market, By Power Source
7.1 Introduction
7.2 PTO-Driven (Power Take-Off)
7.3 Hydraulic Power
7.4 Electric Power
8 Global Haying and Forage Equipment Market, By Application
8.1 Introduction
8.2 Hay
8.3 Grass/Alfalfa
8.4 Straw
8.5 Silage
8.6 Other Applications
9 Global Haying and Forage Equipment Market, By End User
9.1 Introduction
9.2 Livestock Farming
9.3 Dairy Farming
9.4 Forage Harvesting & Processing
9.5 Other End Users
10 Global Haying and Forage Equipment Market, By Geography
10.1 Introduction
10.2 North America
10.2.1 US
10.2.2 Canada
10.2.3 Mexico
10.3 Europe
10.3.1 Germany
10.3.2 UK
10.3.3 Italy
10.3.4 France
10.3.5 Spain
10.3.6 Rest of Europe
10.4 Asia Pacific
10.4.1 Japan
10.4.2 China
10.4.3 India
10.4.4 Australia
10.4.5 New Zealand
10.4.6 South Korea
10.4.7 Rest of Asia Pacific
10.5 South America
10.5.1 Argentina
10.5.2 Brazil
10.5.3 Chile
10.5.4 Rest of South America
10.6 Middle East & Africa
10.6.1 Saudi Arabia
10.6.2 UAE
10.6.3 Qatar
10.6.4 South Africa
10.6.5 Rest of Middle East & Africa
11 Key Developments
11.1 Agreements, Partnerships, Collaborations and Joint Ventures
11.2 Acquisitions & Mergers
11.3 New Product Launch
11.4 Expansions
11.5 Other Key Strategies
12 Company Profiling
12.1 Alamo Group Inc.
12.2 John Deere & Company
12.3 Krone NA, Inc.
12.4 AGCO Corporation
12.5 CNH Industrial N.V.
12.6 Kubota Corporation
12.7 Vermeer Corporation
12.8 Buhler Industries Inc.
12.9 Kuhn Group
12.10 Massey Ferguson Ltd.
12.11 Claas KGaA
12.12 Hesston Corporation
12.13 Lely International N.V.
12.14 Kverneland Group GmbH
12.15 Pöttinger Landtechnik GmbH
List of Tables
1 Global Haying and Forage Equipment Market Outlook, By Region (2024-2032) ($MN)
2 Global Haying and Forage Equipment Market Outlook, By Equipment Type (2024-2032) ($MN)
3 Global Haying and Forage Equipment Market Outlook, By Mowers (2024-2032) ($MN)
4 Global Haying and Forage Equipment Market Outlook, By Balers (2024-2032) ($MN)
5 Global Haying and Forage Equipment Market Outlook, By Tedders (2024-2032) ($MN)
6 Global Haying and Forage Equipment Market Outlook, By Rakes (2024-2032) ($MN)
7 Global Haying and Forage Equipment Market Outlook, By Forage Harvesters (2024-2032) ($MN)
8 Global Haying and Forage Equipment Market Outlook, By Other Equipment Types (2024-2032) ($MN)
9 Global Haying and Forage Equipment Market Outlook, By Operation (2024-2032) ($MN)
10 Global Haying and Forage Equipment Market Outlook, By Semi-Automatic (2024-2032) ($MN)
11 Global Haying and Forage Equipment Market Outlook, By Fully Automatic (2024-2032) ($MN)
12 Global Haying and Forage Equipment Market Outlook, By Power Source (2024-2032) ($MN)
13 Global Haying and Forage Equipment Market Outlook, By PTO-Driven (Power Take-Off) (2024-2032) ($MN)
14 Global Haying and Forage Equipment Market Outlook, By Hydraulic Power (2024-2032) ($MN)
15 Global Haying and Forage Equipment Market Outlook, By Electric Power (2024-2032) ($MN)
16 Global Haying and Forage Equipment Market Outlook, By Application (2024-2032) ($MN)
17 Global Haying and Forage Equipment Market Outlook, By Hay (2024-2032) ($MN)
18 Global Haying and Forage Equipment Market Outlook, By Grass/Alfalfa (2024-2032) ($MN)
19 Global Haying and Forage Equipment Market Outlook, By Straw (2024-2032) ($MN)
20 Global Haying and Forage Equipment Market Outlook, By Silage (2024-2032) ($MN)
21 Global Haying and Forage Equipment Market Outlook, By Other Applications (2024-2032) ($MN)
22 Global Haying and Forage Equipment Market Outlook, By End User (2024-2032) ($MN)
23 Global Haying and Forage Equipment Market Outlook, By Livestock Farming (2024-2032) ($MN)
24 Global Haying and Forage Equipment Market Outlook, By Dairy Farming (2024-2032) ($MN)
25 Global Haying and Forage Equipment Market Outlook, By Forage Harvesting & Processing (2024-2032) ($MN)
26 Global Haying and Forage Equipment Market Outlook, By Other End Users (2024-2032) ($MN)
Note: Tables for North America, Europe, APAC, South America, and Middle East & Africa Regions are also represented in the same manner as above.
List of Figures
RESEARCH METHODOLOGY

We at ‘Stratistics’ opt for an extensive research approach which involves data mining, data validation, and data analysis. The various research sources include in-house repository, secondary research, competitor’s sources, social media research, client internal data, and primary research.
Our team of analysts prefers the most reliable and authenticated data sources in order to perform the comprehensive literature search. With access to most of the authenticated data bases our team highly considers the best mix of information through various sources to obtain extensive and accurate analysis.
Each report takes an average time of a month and a team of 4 industry analysts. The time may vary depending on the scope and data availability of the desired market report. The various parameters used in the market assessment are standardized in order to enhance the data accuracy.
Data Mining
The data is collected from several authenticated, reliable, paid and unpaid sources and is filtered depending on the scope & objective of the research. Our reports repository acts as an added advantage in this procedure. Data gathering from the raw material suppliers, distributors and the manufacturers is performed on a regular basis, this helps in the comprehensive understanding of the products value chain. Apart from the above mentioned sources the data is also collected from the industry consultants to ensure the objective of the study is in the right direction.
Market trends such as technological advancements, regulatory affairs, market dynamics (Drivers, Restraints, Opportunities and Challenges) are obtained from scientific journals, market related national & international associations and organizations.
Data Analysis
From the data that is collected depending on the scope & objective of the research the data is subjected for the analysis. The critical steps that we follow for the data analysis include:
- Product Lifecycle Analysis
- Competitor analysis
- Risk analysis
- Porters Analysis
- PESTEL Analysis
- SWOT Analysis
The data engineering is performed by the core industry experts considering both the Marketing Mix Modeling and the Demand Forecasting. The marketing mix modeling makes use of multiple-regression techniques to predict the optimal mix of marketing variables. Regression factor is based on a number of variables and how they relate to an outcome such as sales or profits.
Data Validation
The data validation is performed by the exhaustive primary research from the expert interviews. This includes telephonic interviews, focus groups, face to face interviews, and questionnaires to validate our research from all aspects. The industry experts we approach come from the leading firms, involved in the supply chain ranging from the suppliers, distributors to the manufacturers and consumers so as to ensure an unbiased analysis.
We are in touch with more than 15,000 industry experts with the right mix of consultants, CEO's, presidents, vice presidents, managers, experts from both supply side and demand side, executives and so on.
The data validation involves the primary research from the industry experts belonging to:
- Leading Companies
- Suppliers & Distributors
- Manufacturers
- Consumers
- Industry/Strategic Consultants
Apart from the data validation the primary research also helps in performing the fill gap research, i.e. providing solutions for the unmet needs of the research which helps in enhancing the reports quality.
For more details about research methodology, kindly write to us at info@strategymrc.com
Frequently Asked Questions
In case of any queries regarding this report, you can contact the customer service by filing the “Inquiry Before Buy” form available on the right hand side. You may also contact us through email: info@strategymrc.com or phone: +1-301-202-5929
Yes, the samples are available for all the published reports. You can request them by filling the “Request Sample” option available in this page.
Yes, you can request a sample with your specific requirements. All the customized samples will be provided as per the requirement with the real data masked.
All our reports are available in Digital PDF format. In case if you require them in any other formats, such as PPT, Excel etc you can submit a request through “Inquiry Before Buy” form available on the right hand side. You may also contact us through email: info@strategymrc.com or phone: +1-301-202-5929
We offer a free 15% customization with every purchase. This requirement can be fulfilled for both pre and post sale. You may send your customization requirements through email at info@strategymrc.com or call us on +1-301-202-5929.
We have 3 different licensing options available in electronic format.
- Single User Licence: Allows one person, typically the buyer, to have access to the ordered product. The ordered product cannot be distributed to anyone else.
- 2-5 User Licence: Allows the ordered product to be shared among a maximum of 5 people within your organisation.
- Corporate License: Allows the product to be shared among all employees of your organisation regardless of their geographical location.
All our reports are typically be emailed to you as an attachment.
To order any available report you need to register on our website. The payment can be made either through CCAvenue or PayPal payments gateways which accept all international cards.
We extend our support to 6 months post sale. A post sale customization is also provided to cover your unmet needs in the report.
Request Customization
We offer complimentary customization of up to 15% with every purchase. To share your customization requirements, feel free to email us at info@strategymrc.com or call us on +1-301-202-5929. .
Please Note: Customization within the 15% threshold is entirely free of charge. If your request exceeds this limit, we will conduct a feasibility assessment. Following that, a detailed quote and timeline will be provided.
WHY CHOOSE US ?

Assured Quality
Best in class reports with high standard of research integrity

24X7 Research Support
Continuous support to ensure the best customer experience.

Free Customization
Adding more values to your product of interest.

Safe & Secure Access
Providing a secured environment for all online transactions.

Trusted by 600+ Brands
Serving the most reputed brands across the world.