
Industrial Counterweights Market
Industrial Counterweights Market Forecasts to 2028 - Global Analysis By Type (Fixed, Swinging), Material (Concrete, Iron & Steel), Application (Excavators, Grinding Wheels), End User (Mining, Construction) and By Geography

|
Years Covered |
2020-2028 |
|
Estimated Year Value (2022) |
US $7.15 BN |
|
Projected Year Value (2028) |
US $10.55 BN |
|
CAGR (2022 - 2028) |
6.7% |
|
Regions Covered |
North America, Europe, Asia Pacific, South America, and Middle East & Africa |
|
Countries Covered |
US, Canada, Mexico, Germany, UK, Italy, France, Spain, Japan, China, India, Australia, New Zealand, South Korea, Rest of Asia Pacific, South America, Argentina, Brazil, Chile, Middle East & Africa, Saudi Arabia, UAE, Qatar, and South Africa |
|
Largest Market |
Asia Pacific |
|
Highest Growing Market |
North America |
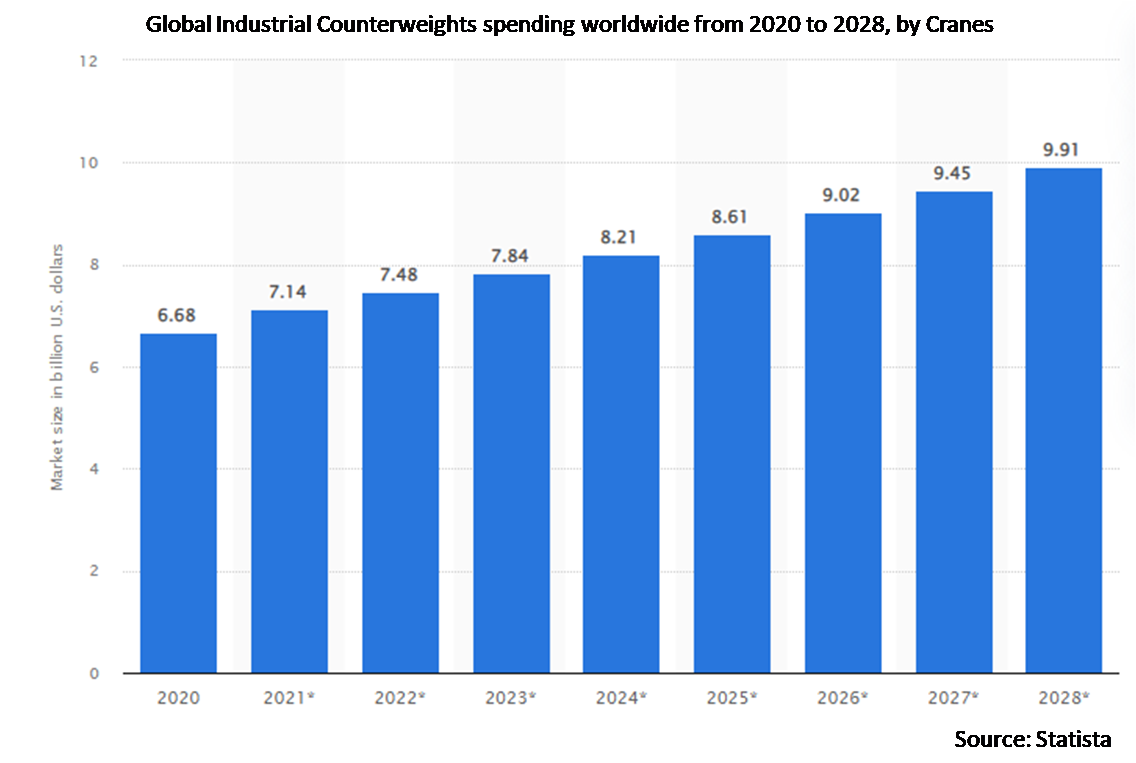
According to Stratistics MRC, the Global Industrial Counterweights Market is accounted for $7.15 billion in 2022 and is expected to reach $10.55 billion by 2028 growing at a CAGR of 6.7% during the forecast period. Industrial counterweights are integral components of any machinery that is responsible for lifting significantly heavy loads. The purpose of industrial counterweight is to make lifting the load faster and more efficient, which saves energy and is less taxing on the lifting machine.
In the face of production halts, temporary layoffs and liquidity issues stemming from the COVID-19 pandemic, the European shipbuilding and maritime equipment manufacturing industries have sought additional support – beyond horizontal industrial policies and financial support – calling for sector-specific support measures. By doing so, they aim to preserve the economic contribution of the sector but, more importantly, to prevent potential dependence on Asian foreign suppliers for maritime technology, a strategic element to generate value in the maritime supply chain. The European Shipbuilding and Maritime Equipment Association estimated that this scenario could mean losing about €120 billion of added value created by the maritime technology sector; 1 million jobs in maritime technology companies and Europe’s innovation and technological global leadership in complex ship types.
Market Dynamics:
Driver:
Soaring demand for counterweights
The growth of the manufacturing, transportation, logistics, construction, and e-commerce industries has led to the increasing need for material handling equipment, in part due to heightened focus on automation and safe working practices, especially in the manufacturing sector. Warehousing has become a crucial part of several industries. Thus, the need for material handling equipment has increased, which, in turn, has increased the demand for counterweights.
Restraint:
Varying cost of counterweights
Due to the varying cost of the raw materials used for counterweights, end users are compromising on the quality of the product by selecting other materials that are comparatively cheaper but provide similar benefits. Consumers are selecting concrete counterweights for their applications as they are cheaper. Concrete density can be improved by adding dense aggregates such as limonite, hematite, or magnetite, or metal bits and scraps into the concrete mix.
Opportunity:
The generation of additional demand for material handling equipment
The generation of additional demand for material handling equipment by booming retail sector will provide new opportunities for the market. As a result, growing spending on construction industry will necessitate the use of more industrial counterweights in the construction of different buildings, which will serve as a catalyst for the industrial counterweights industry in the future. Since most of the material handling systems require counterweights to counterbalance the load, the demand for counterweights has increased due to new opportunities created by the material handling equipment market.
Threat:
Environmental constraints
Due to varying temperatures across different regions of the world, manufacturers of counterweights need to wisely choose the material for counterweights. High temperature reduces the material’s strength and stiffness, whereas low temperature increases material stiffness and strength. Also, at low temperatures, they tend to shrink in size and become brittle. Since material properties like tensile strength, yield strength, and modules of elasticity are least impacted by high temperature, it may affect the market growth.
The iron & steel segment is expected to be the largest during the forecast period
The use of industrial counterweights made from steel and iron are gaining considerable traction. The properties of iron and steel such as good ductility, tensile strength, etc. prove to be useful for demand generation. Hence, the iron and steel material segment is estimated to observe the highest growth.
The construction segment is expected to have the highest CAGR during the forecast period
Construction industry use industrial counterweights systems to decrease the human interference, to increase efficiency and to increase stability of the equipments used. Using industrial counterweights systems, construction industry operators can easily load and unload the material by counterbalancing the weights with the help of counterweights used.
Region with largest share:
Asia Pacific is projected to hold the largest market share due to the factors such as fast-growing economies, increasing demand of huge population and necessity for high-rise buildings. Moreover, increased production rates, Countries such as China and Japan are focusing on construction activities and industrial manufacturing business like automotive to reduce human lanor, are expected to drive the industrial counterweights market in this region.
Region with highest CAGR:
North America is projected to have the highest CAGR due to the factors such as electric forklift trucks are getting a lot of traction in industrialized countries of the region. Rather than traditional forklift trucks, players here are investing heavily in innovative and modern forklift trucks.

Key players in the market:
Some of the key players profiled in the Industrial Counterweights Market include International Steel & Counterweights, Agescan International, Edgetech Industries, Shanxi Huaxiang Group Co. Ltd., Tenwinkel GmbH & Co.KG, Betonfertigteile Ernst Binder GmbH, Casting Quality and Bruckert Beton GmbH.
Key developments:
In October 2019: CMN partnered with Hydroquest and designed gravity-based ballasts together.
In February 2019: Crescent Foundry expanded its cast iron castings manufacturing capacity from 1,900 tpm to 8,333 tpm at Kulgachia in the Howrah district of West Bengal, India.
In January 2019: Sic Lazaro acquired Diamond Industries, a metal fabrication firm, to expand its fabrication capabilities, and, thus, the manufacturing of counterweights.
Types Covered:
• Fixed
• Swinging
Materials Covered:
• Concrete
• Iron & Steel
Applications Covered:
• Excavators
• Grinding Wheels
• Elevators
• Forklifts
• Cranes
• Lifts
End Users Covered:
• Mining
• Construction
• Renewables
• Industrial Manufacturing
• Marine
• Agriculture
• Logistics
Regions Covered:
• North America
o US
o Canada
o Mexico
• Europe
o Germany
o UK
o Italy
o France
o Spain
o Rest of Europe
• Asia Pacific
o Japan
o China
o India
o Australia
o New Zealand
o South Korea
o Rest of Asia Pacific
• South America
o Argentina
o Brazil
o Chile
o Rest of South America
• Middle East & Africa
o Saudi Arabia
o UAE
o Qatar
o South Africa
o Rest of Middle East & Africa
What our report offers:
- Market share assessments for the regional and country-level segments
- Strategic recommendations for the new entrants
- Covers Market data for the years 2020, 2021, 2022, 2025 and 2028
- Market Trends (Drivers, Constraints, Opportunities, Threats, Challenges, Investment Opportunities, and recommendations)
- Strategic recommendations in key business segments based on the market estimations
- Competitive landscaping mapping the key common trends
- Company profiling with detailed strategies, financials, and recent developments
- Supply chain trends mapping the latest technological advancements
Free Customization Offerings:
All the customers of this report will be entitled to receive one of the following free customization options:
• Company Profiling
o Comprehensive profiling of additional market players (up to 3)
o SWOT Analysis of key players (up to 3)
• Regional Segmentation
o Market estimations, Forecasts and CAGR of any prominent country as per the client's interest (Note: Depends on feasibility check)
• Competitive Benchmarking
o Benchmarking of key players based on product portfolio, geographical presence, and strategic alliances
Table of Contents
1 Executive Summary
2 Preface
2.1 Abstract
2.2 Stake Holders
2.3 Research Scope
2.4 Research Methodology
2.4.1 Data Mining
2.4.2 Data Analysis
2.4.3 Data Validation
2.4.4 Research Approach
2.5 Research Sources
2.5.1 Primary Research Sources
2.5.2 Secondary Research Sources
2.5.3 Assumptions
3 Market Trend Analysis
3.1 Introduction
3.2 Drivers
3.3 Restraints
3.4 Opportunities
3.5 Threats
3.6 Application Analysis
3.7 End User Analysis
3.8 Emerging Markets
3.9 Impact of Covid-19
4 Porters Five Force Analysis
4.1 Bargaining power of suppliers
4.2 Bargaining power of buyers
4.3 Threat of substitutes
4.4 Threat of new entrants
4.5 Competitive rivalry
5 Global Industrial Counterweights Market, By Type
5.1 Introduction
5.2 Fixed
5.2.1 Fixed Frames
5.2.2 Floating Frames
5.3 Swinging
6 Global Industrial Counterweights Market, By Material
6.1 Introduction
6.2 Concrete
6.3 Iron & Steel
7 Global Industrial Counterweights Market, By Application
7.1 Introduction
7.2 Excavators
7.3 Grinding Wheels
7.4 Elevators
7.5 Forklifts
7.6 Cranes
7.7 Lifts
8 Global Industrial Counterweights Market, By End User
8.1 Introduction
8.2 Mining
8.3 Construction
8.4 Renewables
8.5 Industrial Manufacturing
8.6 Marine
8.7 Agriculture
8.8 Logistics
9 Global Industrial Counterweights Market, By Geography
9.1 Introduction
9.2 North America
9.2.1 US
9.2.2 Canada
9.2.3 Mexico
9.3 Europe
9.3.1 Germany
9.3.2 UK
9.3.3 Italy
9.3.4 France
9.3.5 Spain
9.3.6 Rest of Europe
9.4 Asia Pacific
9.4.1 Japan
9.4.2 China
9.4.3 India
9.4.4 Australia
9.4.5 New Zealand
9.4.6 South Korea
9.4.7 Rest of Asia Pacific
9.5 South America
9.5.1 Argentina
9.5.2 Brazil
9.5.3 Chile
9.5.4 Rest of South America
9.6 Middle East & Africa
9.6.1 Saudi Arabia
9.6.2 UAE
9.6.3 Qatar
9.6.4 South Africa
9.6.5 Rest of Middle East & Africa
10 Key Developments
10.1 Agreements, Partnerships, Collaborations and Joint Ventures
10.2 Acquisitions & Mergers
10.3 New Product Launch
10.4 Expansions
10.5 Other Key Strategies
11 Company Profiling
11.1 International Steel & Counterweights
11.2 Agescan International
11.3 Edgetech Industries
11.4 Shanxi Huaxiang Group Co. Ltd.
11.5 Tenwinkel GmbH & Co.KG
11.6 Betonfertigteile Ernst Binder GmbH
11.7 Casting Quality
11.8 Bruckert Beton GmbH
List of Tables
1 Global Industrial Counterweights Market Outlook, By Region (2020-2028) ($MN)
2 Global Industrial Counterweights Market Outlook, By Type (2020-2028) ($MN)
3 Global Industrial Counterweights Market Outlook, By Fixed (2020-2028) ($MN)
4 Global Industrial Counterweights Market Outlook, By Fixed Frames (2020-2028) ($MN)
5 Global Industrial Counterweights Market Outlook, By Floating Frames (2020-2028) ($MN)
6 Global Industrial Counterweights Market Outlook, By Swinging (2020-2028) ($MN)
7 Global Industrial Counterweights Market Outlook, By Material (2020-2028) ($MN)
8 Global Industrial Counterweights Market Outlook, By Concrete (2020-2028) ($MN)
9 Global Industrial Counterweights Market Outlook, By Iron & Steel (2020-2028) ($MN)
10 Global Industrial Counterweights Market Outlook, By Application (2020-2028) ($MN)
11 Global Industrial Counterweights Market Outlook, By Excavators (2020-2028) ($MN)
12 Global Industrial Counterweights Market Outlook, By Grinding Wheels (2020-2028) ($MN)
13 Global Industrial Counterweights Market Outlook, By Elevators (2020-2028) ($MN)
14 Global Industrial Counterweights Market Outlook, By Forklifts (2020-2028) ($MN)
15 Global Industrial Counterweights Market Outlook, By Cranes (2020-2028) ($MN)
16 Global Industrial Counterweights Market Outlook, By Lifts (2020-2028) ($MN)
17 Global Industrial Counterweights Market Outlook, By End User (2020-2028) ($MN)
18 Global Industrial Counterweights Market Outlook, By Mining (2020-2028) ($MN)
19 Global Industrial Counterweights Market Outlook, By Construction (2020-2028) ($MN)
20 Global Industrial Counterweights Market Outlook, By Renewables (2020-2028) ($MN)
21 Global Industrial Counterweights Market Outlook, By Industrial Manufacturing (2020-2028) ($MN)
22 Global Industrial Counterweights Market Outlook, By Marine (2020-2028) ($MN)
23 Global Industrial Counterweights Market Outlook, By Agriculture (2020-2028) ($MN)
24 Global Industrial Counterweights Market Outlook, By Logistics (2020-2028) ($MN)
25 North America Industrial Counterweights Market Outlook, By Country (2020-2028) ($MN)
26 North America Industrial Counterweights Market Outlook, By Type (2020-2028) ($MN)
27 North America Industrial Counterweights Market Outlook, By Fixed (2020-2028) ($MN)
28 North America Industrial Counterweights Market Outlook, By Fixed Frames (2020-2028) ($MN)
29 North America Industrial Counterweights Market Outlook, By Floating Frames (2020-2028) ($MN)
30 North America Industrial Counterweights Market Outlook, By Swinging (2020-2028) ($MN)
31 North America Industrial Counterweights Market Outlook, By Material (2020-2028) ($MN)
32 North America Industrial Counterweights Market Outlook, By Concrete (2020-2028) ($MN)
33 North America Industrial Counterweights Market Outlook, By Iron & Steel (2020-2028) ($MN)
34 North America Industrial Counterweights Market Outlook, By Application (2020-2028) ($MN)
35 North America Industrial Counterweights Market Outlook, By Excavators (2020-2028) ($MN)
36 North America Industrial Counterweights Market Outlook, By Grinding Wheels (2020-2028) ($MN)
37 North America Industrial Counterweights Market Outlook, By Elevators (2020-2028) ($MN)
38 North America Industrial Counterweights Market Outlook, By Forklifts (2020-2028) ($MN)
39 North America Industrial Counterweights Market Outlook, By Cranes (2020-2028) ($MN)
40 North America Industrial Counterweights Market Outlook, By Lifts (2020-2028) ($MN)
41 North America Industrial Counterweights Market Outlook, By End User (2020-2028) ($MN)
42 North America Industrial Counterweights Market Outlook, By Mining (2020-2028) ($MN)
43 North America Industrial Counterweights Market Outlook, By Construction (2020-2028) ($MN)
44 North America Industrial Counterweights Market Outlook, By Renewables (2020-2028) ($MN)
45 North America Industrial Counterweights Market Outlook, By Industrial Manufacturing (2020-2028) ($MN)
46 North America Industrial Counterweights Market Outlook, By Marine (2020-2028) ($MN)
47 North America Industrial Counterweights Market Outlook, By Agriculture (2020-2028) ($MN)
48 North America Industrial Counterweights Market Outlook, By Logistics (2020-2028) ($MN)
49 Europe Industrial Counterweights Market Outlook, By Country (2020-2028) ($MN)
50 Europe Industrial Counterweights Market Outlook, By Type (2020-2028) ($MN)
51 Europe Industrial Counterweights Market Outlook, By Fixed (2020-2028) ($MN)
52 Europe Industrial Counterweights Market Outlook, By Fixed Frames (2020-2028) ($MN)
53 Europe Industrial Counterweights Market Outlook, By Floating Frames (2020-2028) ($MN)
54 Europe Industrial Counterweights Market Outlook, By Swinging (2020-2028) ($MN)
55 Europe Industrial Counterweights Market Outlook, By Material (2020-2028) ($MN)
56 Europe Industrial Counterweights Market Outlook, By Concrete (2020-2028) ($MN)
57 Europe Industrial Counterweights Market Outlook, By Iron & Steel (2020-2028) ($MN)
58 Europe Industrial Counterweights Market Outlook, By Application (2020-2028) ($MN)
59 Europe Industrial Counterweights Market Outlook, By Excavators (2020-2028) ($MN)
60 Europe Industrial Counterweights Market Outlook, By Grinding Wheels (2020-2028) ($MN)
61 Europe Industrial Counterweights Market Outlook, By Elevators (2020-2028) ($MN)
62 Europe Industrial Counterweights Market Outlook, By Forklifts (2020-2028) ($MN)
63 Europe Industrial Counterweights Market Outlook, By Cranes (2020-2028) ($MN)
64 Europe Industrial Counterweights Market Outlook, By Lifts (2020-2028) ($MN)
65 Europe Industrial Counterweights Market Outlook, By End User (2020-2028) ($MN)
66 Europe Industrial Counterweights Market Outlook, By Mining (2020-2028) ($MN)
67 Europe Industrial Counterweights Market Outlook, By Construction (2020-2028) ($MN)
68 Europe Industrial Counterweights Market Outlook, By Renewables (2020-2028) ($MN)
69 Europe Industrial Counterweights Market Outlook, By Industrial Manufacturing (2020-2028) ($MN)
70 Europe Industrial Counterweights Market Outlook, By Marine (2020-2028) ($MN)
71 Europe Industrial Counterweights Market Outlook, By Agriculture (2020-2028) ($MN)
72 Europe Industrial Counterweights Market Outlook, By Logistics (2020-2028) ($MN)
73 Asia Pacific Industrial Counterweights Market Outlook, By Country (2020-2028) ($MN)
74 Asia Pacific Industrial Counterweights Market Outlook, By Type (2020-2028) ($MN)
75 Asia Pacific Industrial Counterweights Market Outlook, By Fixed (2020-2028) ($MN)
76 Asia Pacific Industrial Counterweights Market Outlook, By Fixed Frames (2020-2028) ($MN)
77 Asia Pacific Industrial Counterweights Market Outlook, By Floating Frames (2020-2028) ($MN)
78 Asia Pacific Industrial Counterweights Market Outlook, By Swinging (2020-2028) ($MN)
79 Asia Pacific Industrial Counterweights Market Outlook, By Material (2020-2028) ($MN)
80 Asia Pacific Industrial Counterweights Market Outlook, By Concrete (2020-2028) ($MN)
81 Asia Pacific Industrial Counterweights Market Outlook, By Iron & Steel (2020-2028) ($MN)
82 Asia Pacific Industrial Counterweights Market Outlook, By Application (2020-2028) ($MN)
83 Asia Pacific Industrial Counterweights Market Outlook, By Excavators (2020-2028) ($MN)
84 Asia Pacific Industrial Counterweights Market Outlook, By Grinding Wheels (2020-2028) ($MN)
85 Asia Pacific Industrial Counterweights Market Outlook, By Elevators (2020-2028) ($MN)
86 Asia Pacific Industrial Counterweights Market Outlook, By Forklifts (2020-2028) ($MN)
87 Asia Pacific Industrial Counterweights Market Outlook, By Cranes (2020-2028) ($MN)
88 Asia Pacific Industrial Counterweights Market Outlook, By Lifts (2020-2028) ($MN)
89 Asia Pacific Industrial Counterweights Market Outlook, By End User (2020-2028) ($MN)
90 Asia Pacific Industrial Counterweights Market Outlook, By Mining (2020-2028) ($MN)
91 Asia Pacific Industrial Counterweights Market Outlook, By Construction (2020-2028) ($MN)
92 Asia Pacific Industrial Counterweights Market Outlook, By Renewables (2020-2028) ($MN)
93 Asia Pacific Industrial Counterweights Market Outlook, By Industrial Manufacturing (2020-2028) ($MN)
94 Asia Pacific Industrial Counterweights Market Outlook, By Marine (2020-2028) ($MN)
95 Asia Pacific Industrial Counterweights Market Outlook, By Agriculture (2020-2028) ($MN)
96 Asia Pacific Industrial Counterweights Market Outlook, By Logistics (2020-2028) ($MN)
97 South America Industrial Counterweights Market Outlook, By Country (2020-2028) ($MN)
98 South America Industrial Counterweights Market Outlook, By Type (2020-2028) ($MN)
99 South America Industrial Counterweights Market Outlook, By Fixed (2020-2028) ($MN)
100 South America Industrial Counterweights Market Outlook, By Fixed Frames (2020-2028) ($MN)
101 South America Industrial Counterweights Market Outlook, By Floating Frames (2020-2028) ($MN)
102 South America Industrial Counterweights Market Outlook, By Swinging (2020-2028) ($MN)
103 South America Industrial Counterweights Market Outlook, By Material (2020-2028) ($MN)
104 South America Industrial Counterweights Market Outlook, By Concrete (2020-2028) ($MN)
105 South America Industrial Counterweights Market Outlook, By Iron & Steel (2020-2028) ($MN)
106 South America Industrial Counterweights Market Outlook, By Application (2020-2028) ($MN)
107 South America Industrial Counterweights Market Outlook, By Excavators (2020-2028) ($MN)
108 South America Industrial Counterweights Market Outlook, By Grinding Wheels (2020-2028) ($MN)
109 South America Industrial Counterweights Market Outlook, By Elevators (2020-2028) ($MN)
110 South America Industrial Counterweights Market Outlook, By Forklifts (2020-2028) ($MN)
111 South America Industrial Counterweights Market Outlook, By Cranes (2020-2028) ($MN)
112 South America Industrial Counterweights Market Outlook, By Lifts (2020-2028) ($MN)
113 South America Industrial Counterweights Market Outlook, By End User (2020-2028) ($MN)
114 South America Industrial Counterweights Market Outlook, By Mining (2020-2028) ($MN)
115 South America Industrial Counterweights Market Outlook, By Construction (2020-2028) ($MN)
116 South America Industrial Counterweights Market Outlook, By Renewables (2020-2028) ($MN)
117 South America Industrial Counterweights Market Outlook, By Industrial Manufacturing (2020-2028) ($MN)
118 South America Industrial Counterweights Market Outlook, By Marine (2020-2028) ($MN)
119 South America Industrial Counterweights Market Outlook, By Agriculture (2020-2028) ($MN)
120 South America Industrial Counterweights Market Outlook, By Logistics (2020-2028) ($MN)
121 Middle East & Africa Industrial Counterweights Market Outlook, By Country (2020-2028) ($MN)
122 Middle East & Africa Industrial Counterweights Market Outlook, By Type (2020-2028) ($MN)
123 Middle East & Africa Industrial Counterweights Market Outlook, By Fixed (2020-2028) ($MN)
124 Middle East & Africa Industrial Counterweights Market Outlook, By Fixed Frames (2020-2028) ($MN)
125 Middle East & Africa Industrial Counterweights Market Outlook, By Floating Frames (2020-2028) ($MN)
126 Middle East & Africa Industrial Counterweights Market Outlook, By Swinging (2020-2028) ($MN)
127 Middle East & Africa Industrial Counterweights Market Outlook, By Material (2020-2028) ($MN)
128 Middle East & Africa Industrial Counterweights Market Outlook, By Concrete (2020-2028) ($MN)
129 Middle East & Africa Industrial Counterweights Market Outlook, By Iron & Steel (2020-2028) ($MN)
130 Middle East & Africa Industrial Counterweights Market Outlook, By Application (2020-2028) ($MN)
131 Middle East & Africa Industrial Counterweights Market Outlook, By Excavators (2020-2028) ($MN)
132 Middle East & Africa Industrial Counterweights Market Outlook, By Grinding Wheels (2020-2028) ($MN)
133 Middle East & Africa Industrial Counterweights Market Outlook, By Elevators (2020-2028) ($MN)
134 Middle East & Africa Industrial Counterweights Market Outlook, By Forklifts (2020-2028) ($MN)
135 Middle East & Africa Industrial Counterweights Market Outlook, By Cranes (2020-2028) ($MN)
136 Middle East & Africa Industrial Counterweights Market Outlook, By Lifts (2020-2028) ($MN)
137 Middle East & Africa Industrial Counterweights Market Outlook, By End User (2020-2028) ($MN)
138 Middle East & Africa Industrial Counterweights Market Outlook, By Mining (2020-2028) ($MN)
139 Middle East & Africa Industrial Counterweights Market Outlook, By Construction (2020-2028) ($MN)
140 Middle East & Africa Industrial Counterweights Market Outlook, By Renewables (2020-2028) ($MN)
141 Middle East & Africa Industrial Counterweights Market Outlook, By Industrial Manufacturing (2020-2028) ($MN)
142 Middle East & Africa Industrial Counterweights Market Outlook, By Marine (2020-2028) ($MN)
143 Middle East & Africa Industrial Counterweights Market Outlook, By Agriculture (2020-2028) ($MN)
144 Middle East & Africa Industrial Counterweights Market Outlook, By Logistics (2020-2028) ($MN)
List of Figures
RESEARCH METHODOLOGY

We at ‘Stratistics’ opt for an extensive research approach which involves data mining, data validation, and data analysis. The various research sources include in-house repository, secondary research, competitor’s sources, social media research, client internal data, and primary research.
Our team of analysts prefers the most reliable and authenticated data sources in order to perform the comprehensive literature search. With access to most of the authenticated data bases our team highly considers the best mix of information through various sources to obtain extensive and accurate analysis.
Each report takes an average time of a month and a team of 4 industry analysts. The time may vary depending on the scope and data availability of the desired market report. The various parameters used in the market assessment are standardized in order to enhance the data accuracy.
Data Mining
The data is collected from several authenticated, reliable, paid and unpaid sources and is filtered depending on the scope & objective of the research. Our reports repository acts as an added advantage in this procedure. Data gathering from the raw material suppliers, distributors and the manufacturers is performed on a regular basis, this helps in the comprehensive understanding of the products value chain. Apart from the above mentioned sources the data is also collected from the industry consultants to ensure the objective of the study is in the right direction.
Market trends such as technological advancements, regulatory affairs, market dynamics (Drivers, Restraints, Opportunities and Challenges) are obtained from scientific journals, market related national & international associations and organizations.
Data Analysis
From the data that is collected depending on the scope & objective of the research the data is subjected for the analysis. The critical steps that we follow for the data analysis include:
- Product Lifecycle Analysis
- Competitor analysis
- Risk analysis
- Porters Analysis
- PESTEL Analysis
- SWOT Analysis
The data engineering is performed by the core industry experts considering both the Marketing Mix Modeling and the Demand Forecasting. The marketing mix modeling makes use of multiple-regression techniques to predict the optimal mix of marketing variables. Regression factor is based on a number of variables and how they relate to an outcome such as sales or profits.
Data Validation
The data validation is performed by the exhaustive primary research from the expert interviews. This includes telephonic interviews, focus groups, face to face interviews, and questionnaires to validate our research from all aspects. The industry experts we approach come from the leading firms, involved in the supply chain ranging from the suppliers, distributors to the manufacturers and consumers so as to ensure an unbiased analysis.
We are in touch with more than 15,000 industry experts with the right mix of consultants, CEO's, presidents, vice presidents, managers, experts from both supply side and demand side, executives and so on.
The data validation involves the primary research from the industry experts belonging to:
- Leading Companies
- Suppliers & Distributors
- Manufacturers
- Consumers
- Industry/Strategic Consultants
Apart from the data validation the primary research also helps in performing the fill gap research, i.e. providing solutions for the unmet needs of the research which helps in enhancing the reports quality.
For more details about research methodology, kindly write to us at info@strategymrc.com
Frequently Asked Questions
In case of any queries regarding this report, you can contact the customer service by filing the “Inquiry Before Buy” form available on the right hand side. You may also contact us through email: info@strategymrc.com or phone: +1-301-202-5929
Yes, the samples are available for all the published reports. You can request them by filling the “Request Sample” option available in this page.
Yes, you can request a sample with your specific requirements. All the customized samples will be provided as per the requirement with the real data masked.
All our reports are available in Digital PDF format. In case if you require them in any other formats, such as PPT, Excel etc you can submit a request through “Inquiry Before Buy” form available on the right hand side. You may also contact us through email: info@strategymrc.com or phone: +1-301-202-5929
We offer a free 15% customization with every purchase. This requirement can be fulfilled for both pre and post sale. You may send your customization requirements through email at info@strategymrc.com or call us on +1-301-202-5929.
We have 3 different licensing options available in electronic format.
- Single User Licence: Allows one person, typically the buyer, to have access to the ordered product. The ordered product cannot be distributed to anyone else.
- 2-5 User Licence: Allows the ordered product to be shared among a maximum of 5 people within your organisation.
- Corporate License: Allows the product to be shared among all employees of your organisation regardless of their geographical location.
All our reports are typically be emailed to you as an attachment.
To order any available report you need to register on our website. The payment can be made either through CCAvenue or PayPal payments gateways which accept all international cards.
We extend our support to 6 months post sale. A post sale customization is also provided to cover your unmet needs in the report.
Request Customization
We offer complimentary customization of up to 15% with every purchase. To share your customization requirements, feel free to email us at info@strategymrc.com or call us on +1-301-202-5929. .
Please Note: Customization within the 15% threshold is entirely free of charge. If your request exceeds this limit, we will conduct a feasibility assessment. Following that, a detailed quote and timeline will be provided.
WHY CHOOSE US ?

Assured Quality
Best in class reports with high standard of research integrity

24X7 Research Support
Continuous support to ensure the best customer experience.

Free Customization
Adding more values to your product of interest.

Safe & Secure Access
Providing a secured environment for all online transactions.

Trusted by 600+ Brands
Serving the most reputed brands across the world.