
Industrial Sugar Market
Industrial Sugar Market Forecasts to 2028 - Global Analysis By Type (White Sugar, Brown Sugar and Liquid Sugar), Source (Sugarbeet, Sugarcane and Other sources), Form, Application and By Geography

|
Years Covered |
2020-2028 |
|
Estimated Year Value (2022) |
US $44.19 BN |
|
Projected Year Value (2028) |
US $59.21 BN |
|
CAGR (2022 - 2028) |
4.8% |
|
Regions Covered |
North America, Europe, Asia Pacific, South America, and Middle East & Africa |
|
Countries Covered |
US, Canada, Mexico, Germany, UK, Italy, France, Spain, Japan, China, India, Australia, New Zealand, South Korea, Rest of Asia Pacific, South America, Argentina, Brazil, Chile, Middle East & Africa, Saudi Arabia, UAE, Qatar, and South Africa |
|
Largest Market |
Asia Pacific |
|
Highest Growing Market |
Middle East & Africa |
According to Stratistics MRC, the Global Industrial Sugar Market is accounted for $44.19 billion in 2022 and is expected to reach $59.21 billion by 2028 growing at a CAGR of 4.8% during the forecast period. Sugar is a crucial and vital part of the food business. The method of extracting sugar from sugarcane molasses or sugar beets involves multiple steps, including washing, crystallization, drying, and extraction. Sugar comes in a variety of forms and sizes, and its use depends on the purpose. The manufacturing of ethanol, food and beverage production, brewing, baking, candy and confectionery production, medicines, animal feed production, and fermentation processes are just a few of the industrial uses of sugar.
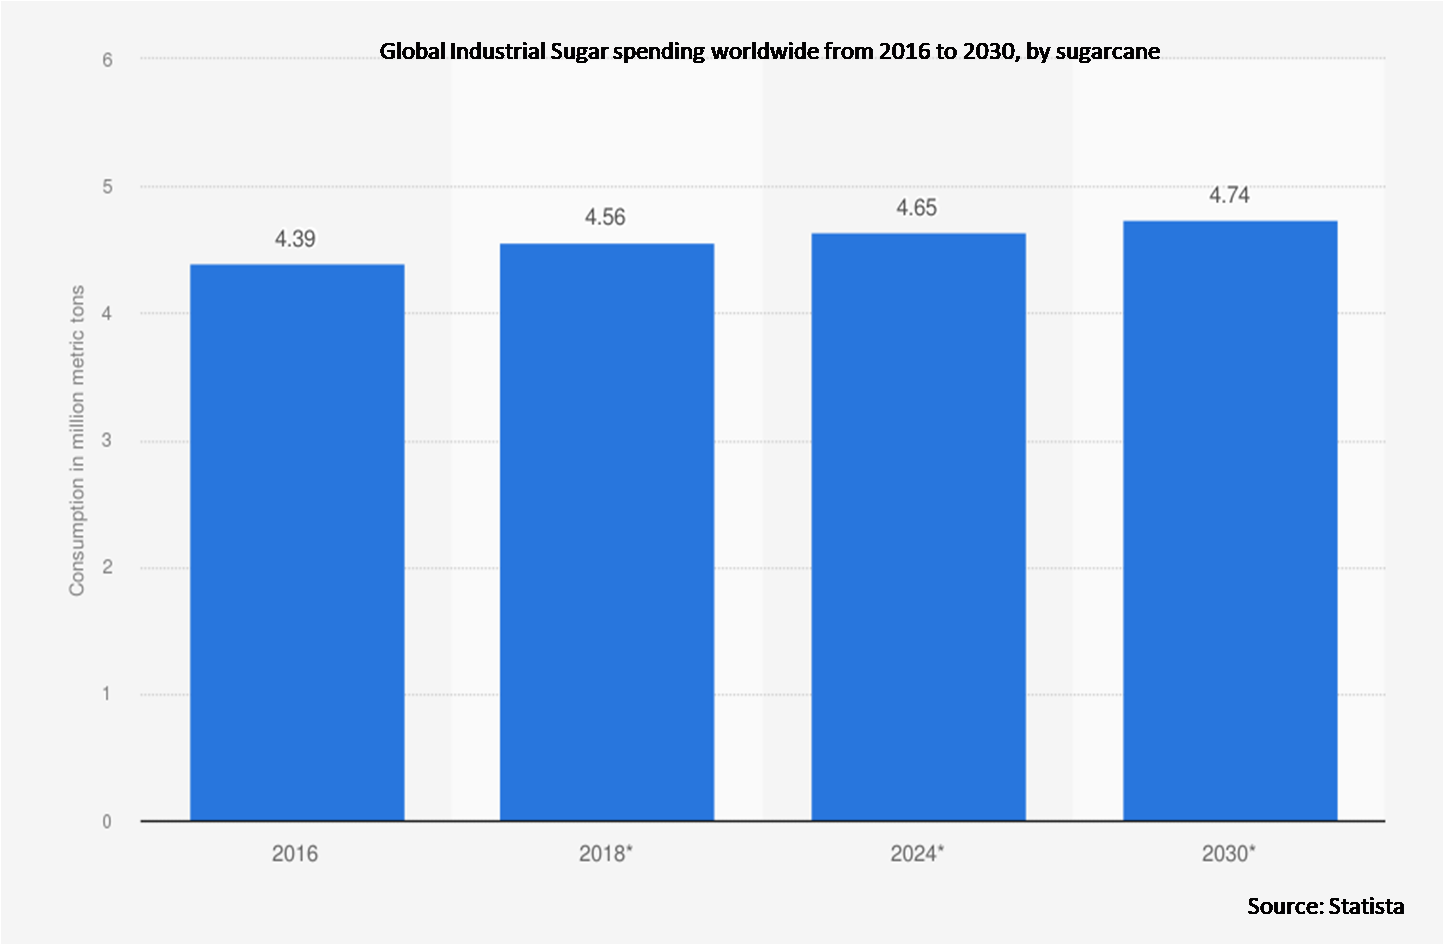
According to the Organization for Economic Co-operation and Development (OECD) and Food and Agricultural Organization (FAO), Sugarcane accounts for around 86% of the total sugar crop production.
Market Dynamics:
Driver:
Growing demand from processed food & beverages
Sugar's wide range of uses has made it a crucial component in the food processing sector. Both alcoholic and non-alcoholic beverages consume a lot of sugar. Alcoholic beverages wouldn't exist without it. In order to make alcohol, a source of natural sugar is typically heated, extracted, allowed to ferment, and then a catalyst is added. Drinking as a snack is a new trend that has greatly boosted demand for different beverages and therefore increased market demand.
Restraint:
Availability of alternate sweeteners
The alternatives to industrial sugar include crystalline fructose, HFCS, glucose, dextrose, and fructose. Due to the strong sweetness of these non-caloric sweeteners, only minuscule amounts are needed to sweeten meals. High fructose corn syrup (HFCS), which is frequently compared to commercial granulated sugar, is the main alternative sweetener. These substitutes, which can take the place of commercial sugar in a variety of meals, are extremely unpredictable.
Opportunity:
Rise in exports and imports of organic cane sugar
Compared to conventional sugar, organic sugar offers certain advantages, such as rich sugarcane flavor, texture, and nutritional advantages. Chemicals are not used in the natural processes that produce organic sugar. Calcium, carbohydrates, and other minerals abound in organic sugars. They are extensively utilized in both food and beverages. Most ayurvedic medications and potions utilize organic cane sugar because it keeps all of the nutrients. The massive consumption from the food & beverage and pharmaceutical industries is driving up market demand.
Threat:
Adverse health effects
The rising incidence of lifestyle-related illnesses like obesity and diabetes are linked to overindulgence in sugar. To avoid these illnesses and maintain general health, consumers are drawn to diets that are low in sugar, glycemic index, and carbohydrates. Thus, it is anticipated that the rising prevalence of ailments including diabetes and cardiovascular disorders will slow market expansion in general.
Covid-19 Impact
Due to growing consumer health concerns, the COVID-19 pandemic had a significant influence on sugar demand. Additionally, there was a major impact on sugar consumption from the widespread lockdowns and limitations on the supply of components to food manufacturing firms. Because of the decreased demand, industrial sugar prices fell dramatically, which also decreased the market's worth. However, once the pandemic's restrictive measures were withdrawn, the market's supply chain has also gotten back on track, which has resumed market growth.
The white sugar segment is expected to be the largest during the forecast period
The white sugar segment is estimated to have a lucrative growth, due to growing bakery sectors. The food industry and pastry industries utilize white sugar extensively. White sugars include tiny granules that are ideal for use in cooking and baking. They are also the most often used in homes, bakeries, cafés, restaurants, and facilities for preparing food. Popular white sugar subtypes include granulated, caster, icing, and jam-setting sugar. The segment's growth is growing due to its diverse set of applications.
The syrup segment is expected to have the highest CAGR during the forecast period
The syrup segment is anticipated to witness the fastest CAGR growth during the forecast period. Several factors contribute to the rising popularity of sugar made from syrup. For instance, because it dissolves more rapidly than granulated sugar and has a smoother texture, it is simpler to utilize in some applications, such as drinks and baked products. It is also more practical for goods with longer shelf lives than granulated sugar because of its longer shelf life. It has a lower glycemic index and less processing, which is promoting the growth of segment.
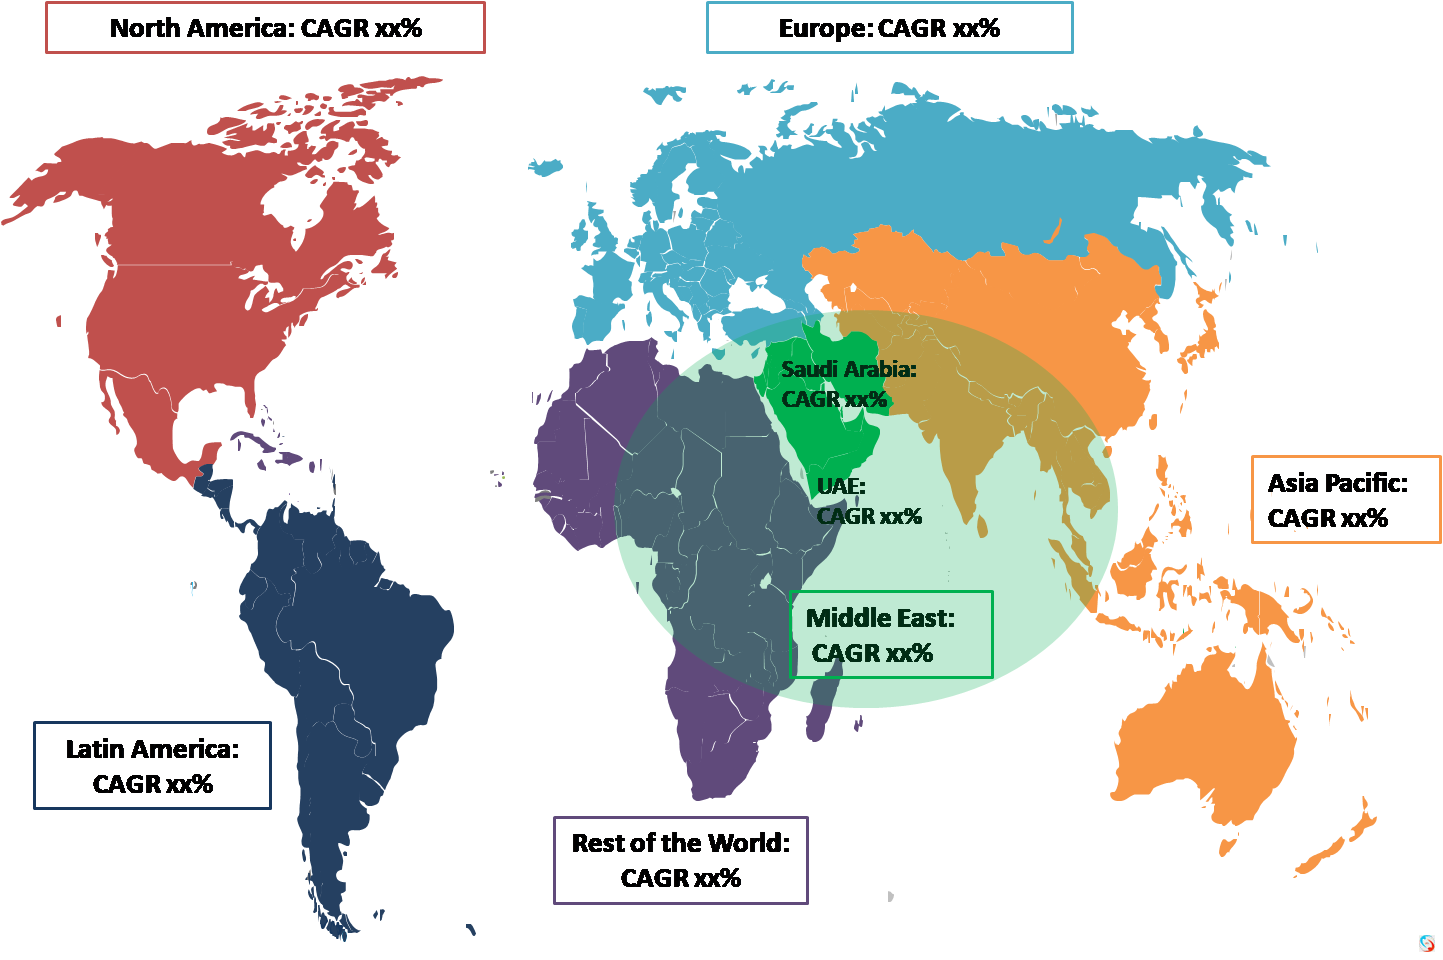
Region with largest share:
Asia Pacific is projected to hold the largest market share during the forecast period. Soft beverages and confectionary items loaded with sugar are quite popular in this region. Promising opportunities for expansion and diversification in the region's food sector are presented by the expanding spending power, the quickening rise of the middle-class population, and the rising consumer demand for processed goods. Due to increased consumer discretionary incomes and a growing population, India is expected to see the strongest growth in the area, followed by China and then Indonesia.
Region with highest CAGR:
Middle East & Africa is projected to have the highest CAGR over the forecast period. The key driver of market expansion in this area is the constantly changing food processing industry. In nations like Saudi Arabia and the UAE, bakery goods, sweets, dairy items, and drinks are growing increasingly popular. The need for sugar has greatly expanded over the last few years as a result of the region's rapidly expanding dairy industry. The market is expected to be driven by the growing demand for ready-to-eat and ready-to-cook goods throughout the predicted time frame.
Key players in the market
Some of the key players profiled in the Industrial Sugar Market include Crystal Sugar Company, Wilmar International Limited, Tereos Internacional SA, Mitr Phol Sugar Corporation Limited, Shree Renuka Sugars Ltd, Associated British Foods Plc, Suedzucker AG, Cargill, Archer Daniels Midland Company, Nordzucker Group AG, Raizen SA, Tongaat Hulett Group, Louis Dreyfus Company, Michigan Sugar Company, Dwarikesh Sugar Industries Ltd, THAI SUGAR GROUP, MEHTA GROUP, DALMIA BHARAT GROUP, BAJAJ Hindusthan Sugar Ltd and Bannari Amman Group.
Key Developments:
In March 2023, Bajaj Hindusthan Sugar Ltd has acquired a 98 per cent stake in Phenil Sugars by converting existing preference shares worth Rs 350 crore into equity shares. The company has converted 3,50,03,927 redeemable non-cumulative convertible preference shares of Rs 100 amounting to Rs 350.04 crore into equity shares of 35,00,39,270 equity shares of Rs 10 each of PSL.
In December 2021, Wilmar International Limited and MSM Malaysia Holdings Bhd (MSM) signed an agreement to collaborate in the establishment of a sustainable sugar supply chain. MSM and Wilmar Sugar collaborated to pilot a method for sustainable raw sugar sourcing within MSM and Wilmar Sugar's joint supply chain by focusing on traceability reporting of sugar supplies and monitoring sustainability performance.
Types Covered:
• White Sugar
• Brown Sugar
• Liquid Sugar
Sources Covered:
• Sugarbeet
• Sugarcane
• Other sources
Forms Covered:
• Powdered
• Syrup
• Granules
Applications Covered:
• Food & Beverages
• Pharmaceuticals
• Dairy Products
• Sweetener
• Frozen Desserts
• Bakery Products
• Confectionery
• Packaged Foods
• Other Applications
Regions Covered:
• North America
o US
o Canada
o Mexico
• Europe
o Germany
o UK
o Italy
o France
o Spain
o Rest of Europe
• Asia Pacific
o Japan
o China
o India
o Australia
o New Zealand
o South Korea
o Rest of Asia Pacific
• South America
o Argentina
o Brazil
o Chile
o Rest of South America
• Middle East & Africa
o Saudi Arabia
o UAE
o Qatar
o South Africa
o Rest of Middle East & Africa
What our report offers:
- Market share assessments for the regional and country-level segments
- Strategic recommendations for the new entrants
- Covers Market data for the years 2020, 2021, 2022, 2025, and 2028
- Market Trends (Drivers, Constraints, Opportunities, Threats, Challenges, Investment Opportunities, and recommendations)
- Strategic recommendations in key business segments based on the market estimations
- Competitive landscaping mapping the key common trends
- Company profiling with detailed strategies, financials, and recent developments
- Supply chain trends mapping the latest technological advancements
Free Customization Offerings:
All the customers of this report will be entitled to receive one of the following free customization options:
• Company Profiling
o Comprehensive profiling of additional market players (up to 3)
o SWOT Analysis of key players (up to 3)
• Regional Segmentation
o Market estimations, Forecasts and CAGR of any prominent country as per the client's interest (Note: Depends on feasibility check)
• Competitive Benchmarking
o Benchmarking of key players based on product portfolio, geographical presence, and strategic alliances
Table of Contents
1 Executive Summary
2 Preface
2.1 Abstract
2.2 Stake Holders
2.3 Research Scope
2.4 Research Methodology
2.4.1 Data Mining
2.4.2 Data Analysis
2.4.3 Data Validation
2.4.4 Research Approach
2.5 Research Sources
2.5.1 Primary Research Sources
2.5.2 Secondary Research Sources
2.5.3 Assumptions
3 Market Trend Analysis
3.1 Introduction
3.2 Drivers
3.3 Restraints
3.4 Opportunities
3.5 Threats
3.6 Application Analysis
3.7 Emerging Markets
3.8 Impact of Covid-19
4 Porters Five Force Analysis
4.1 Bargaining power of suppliers
4.2 Bargaining power of buyers
4.3 Threat of substitutes
4.4 Threat of new entrants
4.5 Competitive rivalry
5 Global Industrial Sugar Market, By Type
5.1 Introduction
5.2 White Sugar
5.3 Brown Sugar
5.4 Liquid Sugar
6 Global Industrial Sugar Market, By Source
6.1 Introduction
6.2 Sugarbeet
6.3 Sugarcane
6.4 Other sources
7 Global Industrial Sugar Market, By Form
7.1 Introduction
7.2 Powdered
7.3 Syrup
7.4 Granules
8 Global Industrial Sugar Market, By Application
8.1 Introduction
8.2 Food & Beverages
8.3 Pharmaceuticals
8.4 Dairy Products
8.5 Sweetener
8.6 Frozen Desserts
8.7 Bakery Products
8.8 Confectionery
8.9 Packaged Foods
8.10 Other Applications
9 Global Industrial Sugar Market, By Geography
9.1 Introduction
9.2 North America
9.2.1 US
9.2.2 Canada
9.2.3 Mexico
9.3 Europe
9.3.1 Germany
9.3.2 UK
9.3.3 Italy
9.3.4 France
9.3.5 Spain
9.3.6 Rest of Europe
9.4 Asia Pacific
9.4.1 Japan
9.4.2 China
9.4.3 India
9.4.4 Australia
9.4.5 New Zealand
9.4.6 South Korea
9.4.7 Rest of Asia Pacific
9.5 South America
9.5.1 Argentina
9.5.2 Brazil
9.5.3 Chile
9.5.4 Rest of South America
9.6 Middle East & Africa
9.6.1 Saudi Arabia
9.6.2 UAE
9.6.3 Qatar
9.6.4 South Africa
9.6.5 Rest of Middle East & Africa
10 Key Developments
10.1 Agreements, Partnerships, Collaborations and Joint Ventures
10.2 Acquisitions & Mergers
10.3 New Product Launch
10.4 Expansions
10.5 Other Key Strategies
11 Company Profiling
11.1 Crystal Sugar Company
11.2 Wilmar International Limited
11.3 Tereos Internacional SA
11.4 Mitr Phol Sugar Corporation Limited
11.5 Shree Renuka Sugars Ltd
11.6 Associated British Foods Plc
11.7 Suedzucker AG
11.8 Cargill
11.9 Archer Daniels Midland Company
11.10 Nordzucker Group AG
11.11 Raizen SA
11.12 Tongaat Hulett Group
11.13 Louis Dreyfus Company
11.14 Michigan Sugar Company
11.15 Dwarikesh Sugar Industries Ltd
11.16 THAI SUGAR GROUP
11.17 MEHTA GROUP
11.18 DALMIA BHARAT GROUP
11.19 BAJAJ Hindusthan Sugar Ltd
11.20 Bannari Amman Group
List of Tables
1 Global Industrial Sugar Market Outlook, By Region (2020-2028) ($MN)
2 Global Industrial Sugar Market Outlook, By Type (2020-2028) ($MN)
3 Global Industrial Sugar Market Outlook, By White Sugar (2020-2028) ($MN)
4 Global Industrial Sugar Market Outlook, By Brown Sugar (2020-2028) ($MN)
5 Global Industrial Sugar Market Outlook, By Liquid Sugar (2020-2028) ($MN)
6 Global Industrial Sugar Market Outlook, By Source (2020-2028) ($MN)
7 Global Industrial Sugar Market Outlook, By Sugarbeet (2020-2028) ($MN)
8 Global Industrial Sugar Market Outlook, By Sugarcane (2020-2028) ($MN)
9 Global Industrial Sugar Market Outlook, By Other sources (2020-2028) ($MN)
10 Global Industrial Sugar Market Outlook, By Form (2020-2028) ($MN)
11 Global Industrial Sugar Market Outlook, By Powdered (2020-2028) ($MN)
12 Global Industrial Sugar Market Outlook, By Syrup (2020-2028) ($MN)
13 Global Industrial Sugar Market Outlook, By Granules (2020-2028) ($MN)
14 Global Industrial Sugar Market Outlook, By Application (2020-2028) ($MN)
15 Global Industrial Sugar Market Outlook, By Food & Beverages (2020-2028) ($MN)
16 Global Industrial Sugar Market Outlook, By Pharmaceuticals (2020-2028) ($MN)
17 Global Industrial Sugar Market Outlook, By Dairy Products (2020-2028) ($MN)
18 Global Industrial Sugar Market Outlook, By Sweetener (2020-2028) ($MN)
19 Global Industrial Sugar Market Outlook, By Frozen Desserts (2020-2028) ($MN)
20 Global Industrial Sugar Market Outlook, By Bakery Products (2020-2028) ($MN)
21 Global Industrial Sugar Market Outlook, By Confectionery (2020-2028) ($MN)
22 Global Industrial Sugar Market Outlook, By Packaged Foods (2020-2028) ($MN)
23 Global Industrial Sugar Market Outlook, By Other Applications (2020-2028) ($MN)
24 North America Industrial Sugar Market Outlook, By Country (2020-2028) ($MN)
25 North America Industrial Sugar Market Outlook, By Type (2020-2028) ($MN)
26 North America Industrial Sugar Market Outlook, By White Sugar (2020-2028) ($MN)
27 North America Industrial Sugar Market Outlook, By Brown Sugar (2020-2028) ($MN)
28 North America Industrial Sugar Market Outlook, By Liquid Sugar (2020-2028) ($MN)
29 North America Industrial Sugar Market Outlook, By Source (2020-2028) ($MN)
30 North America Industrial Sugar Market Outlook, By Sugarbeet (2020-2028) ($MN)
31 North America Industrial Sugar Market Outlook, By Sugarcane (2020-2028) ($MN)
32 North America Industrial Sugar Market Outlook, By Other sources (2020-2028) ($MN)
33 North America Industrial Sugar Market Outlook, By Form (2020-2028) ($MN)
34 North America Industrial Sugar Market Outlook, By Powdered (2020-2028) ($MN)
35 North America Industrial Sugar Market Outlook, By Syrup (2020-2028) ($MN)
36 North America Industrial Sugar Market Outlook, By Granules (2020-2028) ($MN)
37 North America Industrial Sugar Market Outlook, By Application (2020-2028) ($MN)
38 North America Industrial Sugar Market Outlook, By Food & Beverages (2020-2028) ($MN)
39 North America Industrial Sugar Market Outlook, By Pharmaceuticals (2020-2028) ($MN)
40 North America Industrial Sugar Market Outlook, By Dairy Products (2020-2028) ($MN)
41 North America Industrial Sugar Market Outlook, By Sweetener (2020-2028) ($MN)
42 North America Industrial Sugar Market Outlook, By Frozen Desserts (2020-2028) ($MN)
43 North America Industrial Sugar Market Outlook, By Bakery Products (2020-2028) ($MN)
44 North America Industrial Sugar Market Outlook, By Confectionery (2020-2028) ($MN)
45 North America Industrial Sugar Market Outlook, By Packaged Foods (2020-2028) ($MN)
46 North America Industrial Sugar Market Outlook, By Other Applications (2020-2028) ($MN)
47 Europe Industrial Sugar Market Outlook, By Country (2020-2028) ($MN)
48 Europe Industrial Sugar Market Outlook, By Type (2020-2028) ($MN)
49 Europe Industrial Sugar Market Outlook, By White Sugar (2020-2028) ($MN)
50 Europe Industrial Sugar Market Outlook, By Brown Sugar (2020-2028) ($MN)
51 Europe Industrial Sugar Market Outlook, By Liquid Sugar (2020-2028) ($MN)
52 Europe Industrial Sugar Market Outlook, By Source (2020-2028) ($MN)
53 Europe Industrial Sugar Market Outlook, By Sugarbeet (2020-2028) ($MN)
54 Europe Industrial Sugar Market Outlook, By Sugarcane (2020-2028) ($MN)
55 Europe Industrial Sugar Market Outlook, By Other sources (2020-2028) ($MN)
56 Europe Industrial Sugar Market Outlook, By Form (2020-2028) ($MN)
57 Europe Industrial Sugar Market Outlook, By Powdered (2020-2028) ($MN)
58 Europe Industrial Sugar Market Outlook, By Syrup (2020-2028) ($MN)
59 Europe Industrial Sugar Market Outlook, By Granules (2020-2028) ($MN)
60 Europe Industrial Sugar Market Outlook, By Application (2020-2028) ($MN)
61 Europe Industrial Sugar Market Outlook, By Food & Beverages (2020-2028) ($MN)
62 Europe Industrial Sugar Market Outlook, By Pharmaceuticals (2020-2028) ($MN)
63 Europe Industrial Sugar Market Outlook, By Dairy Products (2020-2028) ($MN)
64 Europe Industrial Sugar Market Outlook, By Sweetener (2020-2028) ($MN)
65 Europe Industrial Sugar Market Outlook, By Frozen Desserts (2020-2028) ($MN)
66 Europe Industrial Sugar Market Outlook, By Bakery Products (2020-2028) ($MN)
67 Europe Industrial Sugar Market Outlook, By Confectionery (2020-2028) ($MN)
68 Europe Industrial Sugar Market Outlook, By Packaged Foods (2020-2028) ($MN)
69 Europe Industrial Sugar Market Outlook, By Other Applications (2020-2028) ($MN)
70 Asia Pacific Industrial Sugar Market Outlook, By Country (2020-2028) ($MN)
71 Asia Pacific Industrial Sugar Market Outlook, By Type (2020-2028) ($MN)
72 Asia Pacific Industrial Sugar Market Outlook, By White Sugar (2020-2028) ($MN)
73 Asia Pacific Industrial Sugar Market Outlook, By Brown Sugar (2020-2028) ($MN)
74 Asia Pacific Industrial Sugar Market Outlook, By Liquid Sugar (2020-2028) ($MN)
75 Asia Pacific Industrial Sugar Market Outlook, By Source (2020-2028) ($MN)
76 Asia Pacific Industrial Sugar Market Outlook, By Sugarbeet (2020-2028) ($MN)
77 Asia Pacific Industrial Sugar Market Outlook, By Sugarcane (2020-2028) ($MN)
78 Asia Pacific Industrial Sugar Market Outlook, By Other sources (2020-2028) ($MN)
79 Asia Pacific Industrial Sugar Market Outlook, By Form (2020-2028) ($MN)
80 Asia Pacific Industrial Sugar Market Outlook, By Powdered (2020-2028) ($MN)
81 Asia Pacific Industrial Sugar Market Outlook, By Syrup (2020-2028) ($MN)
82 Asia Pacific Industrial Sugar Market Outlook, By Granules (2020-2028) ($MN)
83 Asia Pacific Industrial Sugar Market Outlook, By Application (2020-2028) ($MN)
84 Asia Pacific Industrial Sugar Market Outlook, By Food & Beverages (2020-2028) ($MN)
85 Asia Pacific Industrial Sugar Market Outlook, By Pharmaceuticals (2020-2028) ($MN)
86 Asia Pacific Industrial Sugar Market Outlook, By Dairy Products (2020-2028) ($MN)
87 Asia Pacific Industrial Sugar Market Outlook, By Sweetener (2020-2028) ($MN)
88 Asia Pacific Industrial Sugar Market Outlook, By Frozen Desserts (2020-2028) ($MN)
89 Asia Pacific Industrial Sugar Market Outlook, By Bakery Products (2020-2028) ($MN)
90 Asia Pacific Industrial Sugar Market Outlook, By Confectionery (2020-2028) ($MN)
91 Asia Pacific Industrial Sugar Market Outlook, By Packaged Foods (2020-2028) ($MN)
92 Asia Pacific Industrial Sugar Market Outlook, By Other Applications (2020-2028) ($MN)
93 South America Industrial Sugar Market Outlook, By Country (2020-2028) ($MN)
94 South America Industrial Sugar Market Outlook, By Type (2020-2028) ($MN)
95 South America Industrial Sugar Market Outlook, By White Sugar (2020-2028) ($MN)
96 South America Industrial Sugar Market Outlook, By Brown Sugar (2020-2028) ($MN)
97 South America Industrial Sugar Market Outlook, By Liquid Sugar (2020-2028) ($MN)
98 South America Industrial Sugar Market Outlook, By Source (2020-2028) ($MN)
99 South America Industrial Sugar Market Outlook, By Sugarbeet (2020-2028) ($MN)
100 South America Industrial Sugar Market Outlook, By Sugarcane (2020-2028) ($MN)
101 South America Industrial Sugar Market Outlook, By Other sources (2020-2028) ($MN)
102 South America Industrial Sugar Market Outlook, By Form (2020-2028) ($MN)
103 South America Industrial Sugar Market Outlook, By Powdered (2020-2028) ($MN)
104 South America Industrial Sugar Market Outlook, By Syrup (2020-2028) ($MN)
105 South America Industrial Sugar Market Outlook, By Granules (2020-2028) ($MN)
106 South America Industrial Sugar Market Outlook, By Application (2020-2028) ($MN)
107 South America Industrial Sugar Market Outlook, By Food & Beverages (2020-2028) ($MN)
108 South America Industrial Sugar Market Outlook, By Pharmaceuticals (2020-2028) ($MN)
109 South America Industrial Sugar Market Outlook, By Dairy Products (2020-2028) ($MN)
110 South America Industrial Sugar Market Outlook, By Sweetener (2020-2028) ($MN)
111 South America Industrial Sugar Market Outlook, By Frozen Desserts (2020-2028) ($MN)
112 South America Industrial Sugar Market Outlook, By Bakery Products (2020-2028) ($MN)
113 South America Industrial Sugar Market Outlook, By Confectionery (2020-2028) ($MN)
114 South America Industrial Sugar Market Outlook, By Packaged Foods (2020-2028) ($MN)
115 South America Industrial Sugar Market Outlook, By Other Applications (2020-2028) ($MN)
116 Middle East & Africa Industrial Sugar Market Outlook, By Country (2020-2028) ($MN)
117 Middle East & Africa Industrial Sugar Market Outlook, By Type (2020-2028) ($MN)
118 Middle East & Africa Industrial Sugar Market Outlook, By White Sugar (2020-2028) ($MN)
119 Middle East & Africa Industrial Sugar Market Outlook, By Brown Sugar (2020-2028) ($MN)
120 Middle East & Africa Industrial Sugar Market Outlook, By Liquid Sugar (2020-2028) ($MN)
121 Middle East & Africa Industrial Sugar Market Outlook, By Source (2020-2028) ($MN)
122 Middle East & Africa Industrial Sugar Market Outlook, By Sugarbeet (2020-2028) ($MN)
123 Middle East & Africa Industrial Sugar Market Outlook, By Sugarcane (2020-2028) ($MN)
124 Middle East & Africa Industrial Sugar Market Outlook, By Other sources (2020-2028) ($MN)
125 Middle East & Africa Industrial Sugar Market Outlook, By Form (2020-2028) ($MN)
126 Middle East & Africa Industrial Sugar Market Outlook, By Powdered (2020-2028) ($MN)
127 Middle East & Africa Industrial Sugar Market Outlook, By Syrup (2020-2028) ($MN)
128 Middle East & Africa Industrial Sugar Market Outlook, By Granules (2020-2028) ($MN)
129 Middle East & Africa Industrial Sugar Market Outlook, By Application (2020-2028) ($MN)
130 Middle East & Africa Industrial Sugar Market Outlook, By Food & Beverages (2020-2028) ($MN)
131 Middle East & Africa Industrial Sugar Market Outlook, By Pharmaceuticals (2020-2028) ($MN)
132 Middle East & Africa Industrial Sugar Market Outlook, By Dairy Products (2020-2028) ($MN)
133 Middle East & Africa Industrial Sugar Market Outlook, By Sweetener (2020-2028) ($MN)
134 Middle East & Africa Industrial Sugar Market Outlook, By Frozen Desserts (2020-2028) ($MN)
135 Middle East & Africa Industrial Sugar Market Outlook, By Bakery Products (2020-2028) ($MN)
136 Middle East & Africa Industrial Sugar Market Outlook, By Confectionery (2020-2028) ($MN)
137 Middle East & Africa Industrial Sugar Market Outlook, By Packaged Foods (2020-2028) ($MN)
138 Middle East & Africa Industrial Sugar Market Outlook, By Other Applications (2020-2028) ($MN)
List of Figures
RESEARCH METHODOLOGY

We at ‘Stratistics’ opt for an extensive research approach which involves data mining, data validation, and data analysis. The various research sources include in-house repository, secondary research, competitor’s sources, social media research, client internal data, and primary research.
Our team of analysts prefers the most reliable and authenticated data sources in order to perform the comprehensive literature search. With access to most of the authenticated data bases our team highly considers the best mix of information through various sources to obtain extensive and accurate analysis.
Each report takes an average time of a month and a team of 4 industry analysts. The time may vary depending on the scope and data availability of the desired market report. The various parameters used in the market assessment are standardized in order to enhance the data accuracy.
Data Mining
The data is collected from several authenticated, reliable, paid and unpaid sources and is filtered depending on the scope & objective of the research. Our reports repository acts as an added advantage in this procedure. Data gathering from the raw material suppliers, distributors and the manufacturers is performed on a regular basis, this helps in the comprehensive understanding of the products value chain. Apart from the above mentioned sources the data is also collected from the industry consultants to ensure the objective of the study is in the right direction.
Market trends such as technological advancements, regulatory affairs, market dynamics (Drivers, Restraints, Opportunities and Challenges) are obtained from scientific journals, market related national & international associations and organizations.
Data Analysis
From the data that is collected depending on the scope & objective of the research the data is subjected for the analysis. The critical steps that we follow for the data analysis include:
- Product Lifecycle Analysis
- Competitor analysis
- Risk analysis
- Porters Analysis
- PESTEL Analysis
- SWOT Analysis
The data engineering is performed by the core industry experts considering both the Marketing Mix Modeling and the Demand Forecasting. The marketing mix modeling makes use of multiple-regression techniques to predict the optimal mix of marketing variables. Regression factor is based on a number of variables and how they relate to an outcome such as sales or profits.
Data Validation
The data validation is performed by the exhaustive primary research from the expert interviews. This includes telephonic interviews, focus groups, face to face interviews, and questionnaires to validate our research from all aspects. The industry experts we approach come from the leading firms, involved in the supply chain ranging from the suppliers, distributors to the manufacturers and consumers so as to ensure an unbiased analysis.
We are in touch with more than 15,000 industry experts with the right mix of consultants, CEO's, presidents, vice presidents, managers, experts from both supply side and demand side, executives and so on.
The data validation involves the primary research from the industry experts belonging to:
- Leading Companies
- Suppliers & Distributors
- Manufacturers
- Consumers
- Industry/Strategic Consultants
Apart from the data validation the primary research also helps in performing the fill gap research, i.e. providing solutions for the unmet needs of the research which helps in enhancing the reports quality.
For more details about research methodology, kindly write to us at info@strategymrc.com
Frequently Asked Questions
In case of any queries regarding this report, you can contact the customer service by filing the “Inquiry Before Buy” form available on the right hand side. You may also contact us through email: info@strategymrc.com or phone: +1-301-202-5929
Yes, the samples are available for all the published reports. You can request them by filling the “Request Sample” option available in this page.
Yes, you can request a sample with your specific requirements. All the customized samples will be provided as per the requirement with the real data masked.
All our reports are available in Digital PDF format. In case if you require them in any other formats, such as PPT, Excel etc you can submit a request through “Inquiry Before Buy” form available on the right hand side. You may also contact us through email: info@strategymrc.com or phone: +1-301-202-5929
We offer a free 15% customization with every purchase. This requirement can be fulfilled for both pre and post sale. You may send your customization requirements through email at info@strategymrc.com or call us on +1-301-202-5929.
We have 3 different licensing options available in electronic format.
- Single User Licence: Allows one person, typically the buyer, to have access to the ordered product. The ordered product cannot be distributed to anyone else.
- 2-5 User Licence: Allows the ordered product to be shared among a maximum of 5 people within your organisation.
- Corporate License: Allows the product to be shared among all employees of your organisation regardless of their geographical location.
All our reports are typically be emailed to you as an attachment.
To order any available report you need to register on our website. The payment can be made either through CCAvenue or PayPal payments gateways which accept all international cards.
We extend our support to 6 months post sale. A post sale customization is also provided to cover your unmet needs in the report.
Request Customization
We provide a free 15% customization on every purchase. This requirement can be fulfilled for both pre and post sale. You may send your customization requirements through email at info@strategymrc.com or call us on +1-301-202-5929.
Note: This customization is absolutely free until it falls under the 15% bracket. If your requirement exceeds this a feasibility check will be performed. Post that, a quote will be provided along with the timelines.
WHY CHOOSE US ?

Assured Quality
Best in class reports with high standard of research integrity

24X7 Research Support
Continuous support to ensure the best customer experience.

Free Customization
Adding more values to your product of interest.

Safe & Secure Access
Providing a secured environment for all online transactions.

Trusted by 600+ Brands
Serving the most reputed brands across the world.