
Interactive Educational Content Market
Interactive Educational Content Market Forecasts to 2034 – Global Analysis By Content Type (Interactive Videos, Educational Games, Interactive E-Books, Simulations and Virtual Labs, Interactive Quizzes and Exercises and Other Content Types), Delivery Mode, Subject Area, Technology, Education Level, Business Model, End User and By Geography

Market Dynamics:
Driver:
Rising Adoption of Blended Learning Models
Educational institutions increasingly integrate digital interactive materials into conventional classroom instruction to combine face-to-face teaching with technology-mediated self-paced learning. This hybrid approach addresses diverse learner needs while preserving direct educator involvement, which in turn drives demand for content that functions seamlessly across in-person and remote settings. Schools and universities investing in blended infrastructure consequently prioritize interactive resources that support both synchronous and asynchronous engagement.
Restraint:
Fragmented Content Standards and Interoperability Constraints
The absence of universally adopted technical standards across interactive content platforms creates significant integration challenges for educational institutions managing multiple systems. Schools frequently encounter compatibility issues when attempting to deploy content from different vendors within existing learning management environments, which increases implementation costs and limits content reuse. This fragmentation discourages some institutions from expanding their interactive content portfolios and slows broader adoption across districts with constrained technical resources.
Opportunity:
Expansion of AI-Driven Personalized Learning Pathways
Artificial intelligence capabilities enable interactive content platforms to adapt difficulty, pacing, and content selection based on individual learner performance in real time. This personalization capability addresses a longstanding limitation of one-size-fits-all educational materials, which in turn creates substantial opportunities for platforms that can demonstrate measurable learning outcome improvements. Vendors integrating AI coaching and adaptive assessment into interactive content can differentiate their offerings in an increasingly crowded marketplace.
Threat:
Data Privacy and Student Information Protection Risks
Interactive educational platforms collect extensive data on learner behavior, performance, and engagement patterns, creating compliance obligations under regulations such as FERPA, COPPA, and various state-level student privacy laws. Breaches or misuse of this information can expose content providers to legal liability and reputational damage while eroding institutional trust. Schools increasingly demand rigorous data governance assurances before adopting new platforms, which raises compliance costs and extends sales cycles for vendors.
Covid-19 Impact:
The pandemic initially disrupted school operations and forced emergency remote instruction, exposing gaps in digital readiness across institutions. Mid-pandemic demand surged for interactive content that could sustain student engagement without direct teacher supervision. Post-pandemic, institutions have retained hybrid delivery models and now prioritize interactive materials that support continuity between physical and virtual learning environments, embedding digital engagement as a permanent component of instructional strategy.
The interactive videos segment is expected to be the largest during the forecast period
The interactive videos segment is expected to account for the largest market share during the forecast period, due to their ability to combine visual engagement with embedded assessments and branching narratives that sustain learner attention. Video remains the dominant medium for digital instruction because it accommodates diverse learning preferences while conveying complex concepts efficiently. Educational institutions increasingly favor interactive video platforms that provide completion tracking and comprehension checks, thereby enabling educators to verify engagement rather than assume it from passive viewing metrics.
The mobile-based segment is expected to have the highest CAGR during the forecast period
Over the forecast period, the mobile-based segment is predicted to witness the highest growth rate, driven by the near-universal availability of smartphones among learners and the convenience of accessing educational content during transit or outside formal study hours. Mobile delivery reduces infrastructure barriers in regions where personal computers remain scarce, as it leverages devices already present in most households. Publishers are consequently prioritizing mobile-optimized interactive content and offline access capabilities, thereby extending their reach to learners in emerging markets and underserved communities.
Region with largest share:
During the forecast period, the North America region is expected to hold the largest market share, due to the presence of established educational technology vendors and high institutional spending on digital learning resources across the United States. School districts and universities in the region have broadly adopted learning management systems and interactive content as complements to traditional instruction. Major publishers including Pearson, McGraw Hill, and Cengage maintain significant operations in North America, while supportive policy frameworks for educational technology procurement sustain demand.
Region with highest CAGR:
Over the forecast period, the Asia Pacific region is anticipated to exhibit the highest CAGR, due to rapid expansion of digital infrastructure and increasing government investment in education technology across countries such as China, India, and Southeast Asian nations. Rising smartphone penetration and growing middle-class demand for supplementary learning resources create favorable conditions for interactive content adoption. Government initiatives promoting digital classrooms and teacher training in the region further accelerate demand for engaging, curriculum-aligned interactive materials.
Key players in the market
Some of the key players in Interactive Educational Content Market include Pearson plc, McGraw Hill, LLC, Cengage Group, Houghton Mifflin Harcourt, Discovery Education, Inc., Kahoot! ASA, Quizizz Inc., Nearpod Inc., BrainPOP LLC, Khan Academy, Duolingo, Inc., IXL Learning, Inc., PBS LearningMedia, Labster ApS, PhET Interactive Simulations, Epic! Creations, Inc., Twinkl Ltd., and BookWidgets.
Key Developments:
In August 2026, Discovery Education, Inc. launched a conversational AI chat interface within its Google Classroom add-on, enabling teachers to retrieve vetted, standards-aligned K-12 resources through natural language prompts during lesson planning workflows.
In August 2026, Cengage Group expanded integrated AI capabilities across more than 800 higher education products, deploying Student Assistant and Instructor Assistant to support contextual coaching and actionable instructor insights grounded in course content.
In August 2026, Pearson plc completed its acquisition of ITS, a trusted assessment technology provider, bringing remote testing, proctoring, and performance-based assessment capabilities in-house to strengthen its enterprise assessment platform.
Content Types Covered:
• Interactive Videos
• Educational Games
• Interactive E-Books
• Simulations and Virtual Labs
• Interactive Quizzes and Exercises
• Other Content Types
Delivery Modes Covered:
• Web-Based
• Mobile-Based
• Offline and Downloadable
• Blended Delivery
Subject Areas Covered:
• STEM
• Language and Literacy
• Social Sciences
• Arts and Humanities
• Vocational and Technical Subjects
• Other Subjects
Technologies Covered:
• HTML5 and Web Technologies
• Augmented and Virtual Reality
• Artificial Intelligence
• Other Technologies
Education Levels Covered:
• Early Childhood
• K-12 Education
• Higher Education
• Professional and Continuing Education
Business Models Covered:
• Subscription-Based
• Perpetual Licensing
• Pay-Per-Content
• Freemium and Advertising-Supported
Regions Covered:
• North America
o United States
o Canada
o Mexico
• Europe
o United Kingdom
o Germany
o France
o Italy
o Spain
o Netherlands
o Belgium
o Sweden
o Switzerland
o Poland
o Rest of Europe
• Asia Pacific
o China
o Japan
o India
o South Korea
o Australia
o Indonesia
o Thailand
o Malaysia
o Singapore
o Vietnam
o Rest of Asia Pacific
• South America
o Brazil
o Argentina
o Colombia
o Chile
o Peru
o Rest of South America
• Rest of the World (RoW)
o Middle East
§ Saudi Arabia
§ United Arab Emirates
§ Qatar
§ Israel
§ Rest of Middle East
o Africa
§ South Africa
§ Egypt
§ Morocco
§ Rest of Africa
What our report offers:
- Market share assessments for the regional and country-level segments
- Strategic recommendations for the new entrants
- Covers Market data for the years 2023, 2024, 2025, 2026, 2027, 2028, 2030, 2032 and 2034
- Market Trends (Drivers, Constraints, Opportunities, Threats, Challenges, Investment Opportunities, and recommendations)
- Strategic recommendations in key business segments based on the market estimations
- Competitive landscaping mapping the key common trends
- Company profiling with detailed strategies, financials, and recent developments
- Supply chain trends mapping the latest technological advancements
Free Customization Offerings:
All the customers of this report will be entitled to receive one of the following free customization options:
• Company Profiling
o Comprehensive profiling of additional market players (up to 3)
o SWOT Analysis of key players (up to 3)
• Regional Segmentation
o Market estimations, Forecasts and CAGR of any prominent country as per the client's interest (Note: Depends on feasibility check)
• Competitive Benchmarking
o Benchmarking of key players based on product portfolio, geographical presence, and strategic alliances
Table of Contents
1 Executive Summary1.1 Market Snapshot and Key Highlights
1.2 Growth Drivers, Challenges, and Opportunities
1.3 Competitive Landscape Overview
1.4 Strategic Insights and Recommendations
2 Research Framework
2.1 Study Objectives and Scope
2.2 Stakeholder Analysis
2.3 Research Assumptions and Limitations
2.4 Research Methodology
2.4.1 Data Collection (Primary and Secondary)
2.4.2 Data Modeling and Estimation Techniques
2.4.3 Data Validation and Triangulation
2.4.4 Analytical and Forecasting Approach
3 Market Dynamics and Trend Analysis
3.1 Market Definition and Structure
3.2 Key Market Drivers
3.3 Market Restraints and Challenges
3.4 Growth Opportunities and Investment Hotspots
3.5 Industry Threats and Risk Assessment
3.6 Technology and Innovation Landscape
3.7 Emerging and High-Growth Markets
3.8 Regulatory and Policy Environment
3.9 Impact of COVID-19 and Recovery Outlook
4 Competitive and Strategic Assessment
4.1 Porter's Five Forces Analysis
4.1.1 Supplier Bargaining Power
4.1.2 Buyer Bargaining Power
4.1.3 Threat of Substitutes
4.1.4 Threat of New Entrants
4.1.5 Competitive Rivalry
4.2 Market Share Analysis of Key Players
4.3 Product Benchmarking and Performance Comparison
5 Global Interactive Educational Content Market, By Content Type
5.1 Interactive Videos
5.2 Educational Games
5.3 Interactive E-Books
5.4 Simulations and Virtual Labs
5.5 Interactive Quizzes and Exercises
5.6 Other Content Types
6 Global Interactive Educational Content Market, By Delivery Mode
6.1 Web-Based
6.2 Mobile-Based
6.3 Offline and Downloadable
6.4 Blended Delivery
7 Global Interactive Educational Content Market, By Subject Area
7.1 STEM
7.2 Language and Literacy
7.3 Social Sciences
7.4 Arts and Humanities
7.5 Vocational and Technical Subjects
7.6 Other Subjects
8 Global Interactive Educational Content Market, By Technology
8.1 HTML5 and Web Technologies
8.2 Augmented and Virtual Reality
8.3 Artificial Intelligence
8.4 Other Technologies
9 Global Interactive Educational Content Market, By Education Level
9.1 Early Childhood
9.2 K-12 Education
9.3 Higher Education
9.4 Professional and Continuing Education
10 Global Interactive Educational Content Market, By Business Model
10.1 Subscription-Based
10.2 Perpetual Licensing
10.3 Pay-Per-Content
10.4 Freemium and Advertising-Supported
11 Global Interactive Educational Content Market, By End User
11.1 Schools
11.2 Colleges and Universities
11.3 Corporate Training Providers
11.4 Individual Learners
11.5 Other End Users
12 Global Interactive Educational Content Market, By Geography
12.1 North America
12.1.1 United States
12.1.2 Canada
12.1.3 Mexico
12.2 Europe
12.2.1 United Kingdom
12.2.2 Germany
12.2.3 France
12.2.4 Italy
12.2.5 Spain
12.2.6 Netherlands
12.2.7 Belgium
12.2.8 Sweden
12.2.9 Switzerland
12.2.10 Poland
12.2.11 Rest of Europe
12.3 Asia Pacific
12.3.1 China
12.3.2 Japan
12.3.3 India
12.3.4 South Korea
12.3.5 Australia
12.3.6 Indonesia
12.3.7 Thailand
12.3.8 Malaysia
12.3.9 Singapore
12.3.10 Vietnam
12.3.11 Rest of Asia Pacific
12.4 South America
12.4.1 Brazil
12.4.2 Argentina
12.4.3 Colombia
12.4.4 Chile
12.4.5 Peru
12.4.6 Rest of South America
12.5 Rest of the World (RoW)
12.5.1 Middle East
12.5.1.1 Saudi Arabia
12.5.1.2 United Arab Emirates
12.5.1.3 Qatar
12.5.1.4 Israel
12.5.1.5 Rest of Middle East
12.5.2 Africa
12.5.2.1 South Africa
12.5.2.2 Egypt
12.5.2.3 Morocco
12.5.2.4 Rest of Africa
13 Strategic Market Intelligence
13.1 Industry Value Network and Supply Chain Assessment
13.2 White-Space and Opportunity Mapping
13.3 Product Evolution and Market Life Cycle Analysis
13.4 Channel, Distributor, and Go-to-Market Assessment
14 Industry Developments and Strategic Initiatives
14.1 Mergers and Acquisitions
14.2 Partnerships, Alliances, and Joint Ventures
14.3 New Product Launches and Certifications
14.4 Capacity Expansion and Investments
14.5 Other Strategic Initiatives
15 Company Profiles
15.1 Pearson plc
15.2 McGraw Hill, LLC
15.3 Cengage Group
15.4 Houghton Mifflin Harcourt
15.5 Discovery Education, Inc.
15.6 Kahoot! ASA
15.7 Quizizz Inc.
15.8 Nearpod Inc.
15.9 BrainPOP LLC
15.10 Khan Academy
15.11 Duolingo, Inc.
15.12 IXL Learning, Inc.
15.13 PBS LearningMedia
15.14 Labster ApS
15.15 PhET Interactive Simulations
15.16 Epic! Creations, Inc.
15.17 Twinkl Ltd.
15.18 BookWidgets
List of Tables
1 Global Interactive Educational Content Market Outlook, By Region (2023-2034) ($MN)
2 Global Interactive Educational Content Market Outlook, By Content Type (2023-2034) ($MN)
3 Global Interactive Educational Content Market Outlook, By Interactive Videos (2023-2034) ($MN)
4 Global Interactive Educational Content Market Outlook, By Educational Games (2023-2034) ($MN)
5 Global Interactive Educational Content Market Outlook, By Interactive E-Books (2023-2034) ($MN)
6 Global Interactive Educational Content Market Outlook, By Simulations and Virtual Labs (2023-2034) ($MN)
7 Global Interactive Educational Content Market Outlook, By Interactive Quizzes and Exercises (2023-2034) ($MN)
8 Global Interactive Educational Content Market Outlook, By Other Content Types (2023-2034) ($MN)
9 Global Interactive Educational Content Market Outlook, By Delivery Mode (2023-2034) ($MN)
10 Global Interactive Educational Content Market Outlook, By Web-Based (2023-2034) ($MN)
11 Global Interactive Educational Content Market Outlook, By Mobile-Based (2023-2034) ($MN)
12 Global Interactive Educational Content Market Outlook, By Offline and Downloadable (2023-2034) ($MN)
13 Global Interactive Educational Content Market Outlook, By Blended Delivery (2023-2034) ($MN)
14 Global Interactive Educational Content Market Outlook, By Subject Area (2023-2034) ($MN)
15 Global Interactive Educational Content Market Outlook, By STEM (2023-2034) ($MN)
16 Global Interactive Educational Content Market Outlook, By Language and Literacy (2023-2034) ($MN)
17 Global Interactive Educational Content Market Outlook, By Social Sciences (2023-2034) ($MN)
18 Global Interactive Educational Content Market Outlook, By Arts and Humanities (2023-2034) ($MN)
19 Global Interactive Educational Content Market Outlook, By Vocational and Technical Subjects (2023-2034) ($MN)
20 Global Interactive Educational Content Market Outlook, By Other Subjects (2023-2034) ($MN)
21 Global Interactive Educational Content Market Outlook, By Technology (2023-2034) ($MN)
22 Global Interactive Educational Content Market Outlook, By HTML5 and Web Technologies (2023-2034) ($MN)
23 Global Interactive Educational Content Market Outlook, By Augmented and Virtual Reality (2023-2034) ($MN)
24 Global Interactive Educational Content Market Outlook, By Artificial Intelligence (2023-2034) ($MN)
25 Global Interactive Educational Content Market Outlook, By Other Technologies (2023-2034) ($MN)
26 Global Interactive Educational Content Market Outlook, By Education Level (2023-2034) ($MN)
27 Global Interactive Educational Content Market Outlook, By Early Childhood (2023-2034) ($MN)
28 Global Interactive Educational Content Market Outlook, By K-12 Education (2023-2034) ($MN)
29 Global Interactive Educational Content Market Outlook, By Higher Education (2023-2034) ($MN)
30 Global Interactive Educational Content Market Outlook, By Professional and Continuing Education (2023-2034) ($MN)
31 Global Interactive Educational Content Market Outlook, By Business Model (2023-2034) ($MN)
32 Global Interactive Educational Content Market Outlook, By Subscription-Based (2023-2034) ($MN)
33 Global Interactive Educational Content Market Outlook, By Perpetual Licensing (2023-2034) ($MN)
34 Global Interactive Educational Content Market Outlook, By Pay-Per-Content (2023-2034) ($MN)
35 Global Interactive Educational Content Market Outlook, By Freemium and Advertising-Supported (2023-2034) ($MN)
36 Global Interactive Educational Content Market Outlook, By End User (2023-2034) ($MN)
37 Global Interactive Educational Content Market Outlook, By Schools (2023-2034) ($MN)
38 Global Interactive Educational Content Market Outlook, By Colleges and Universities (2023-2034) ($MN)
39 Global Interactive Educational Content Market Outlook, By Corporate Training Providers (2023-2034) ($MN)
40 Global Interactive Educational Content Market Outlook, By Individual Learners (2023-2034) ($MN)
41 Global Interactive Educational Content Market Outlook, By Other End Users (2023-2034) ($MN)
Note: Tables for North America, Europe, APAC, South America, and Rest of the World (RoW) Regions are also represented in the same manner as above.
List of Figures
RESEARCH METHODOLOGY
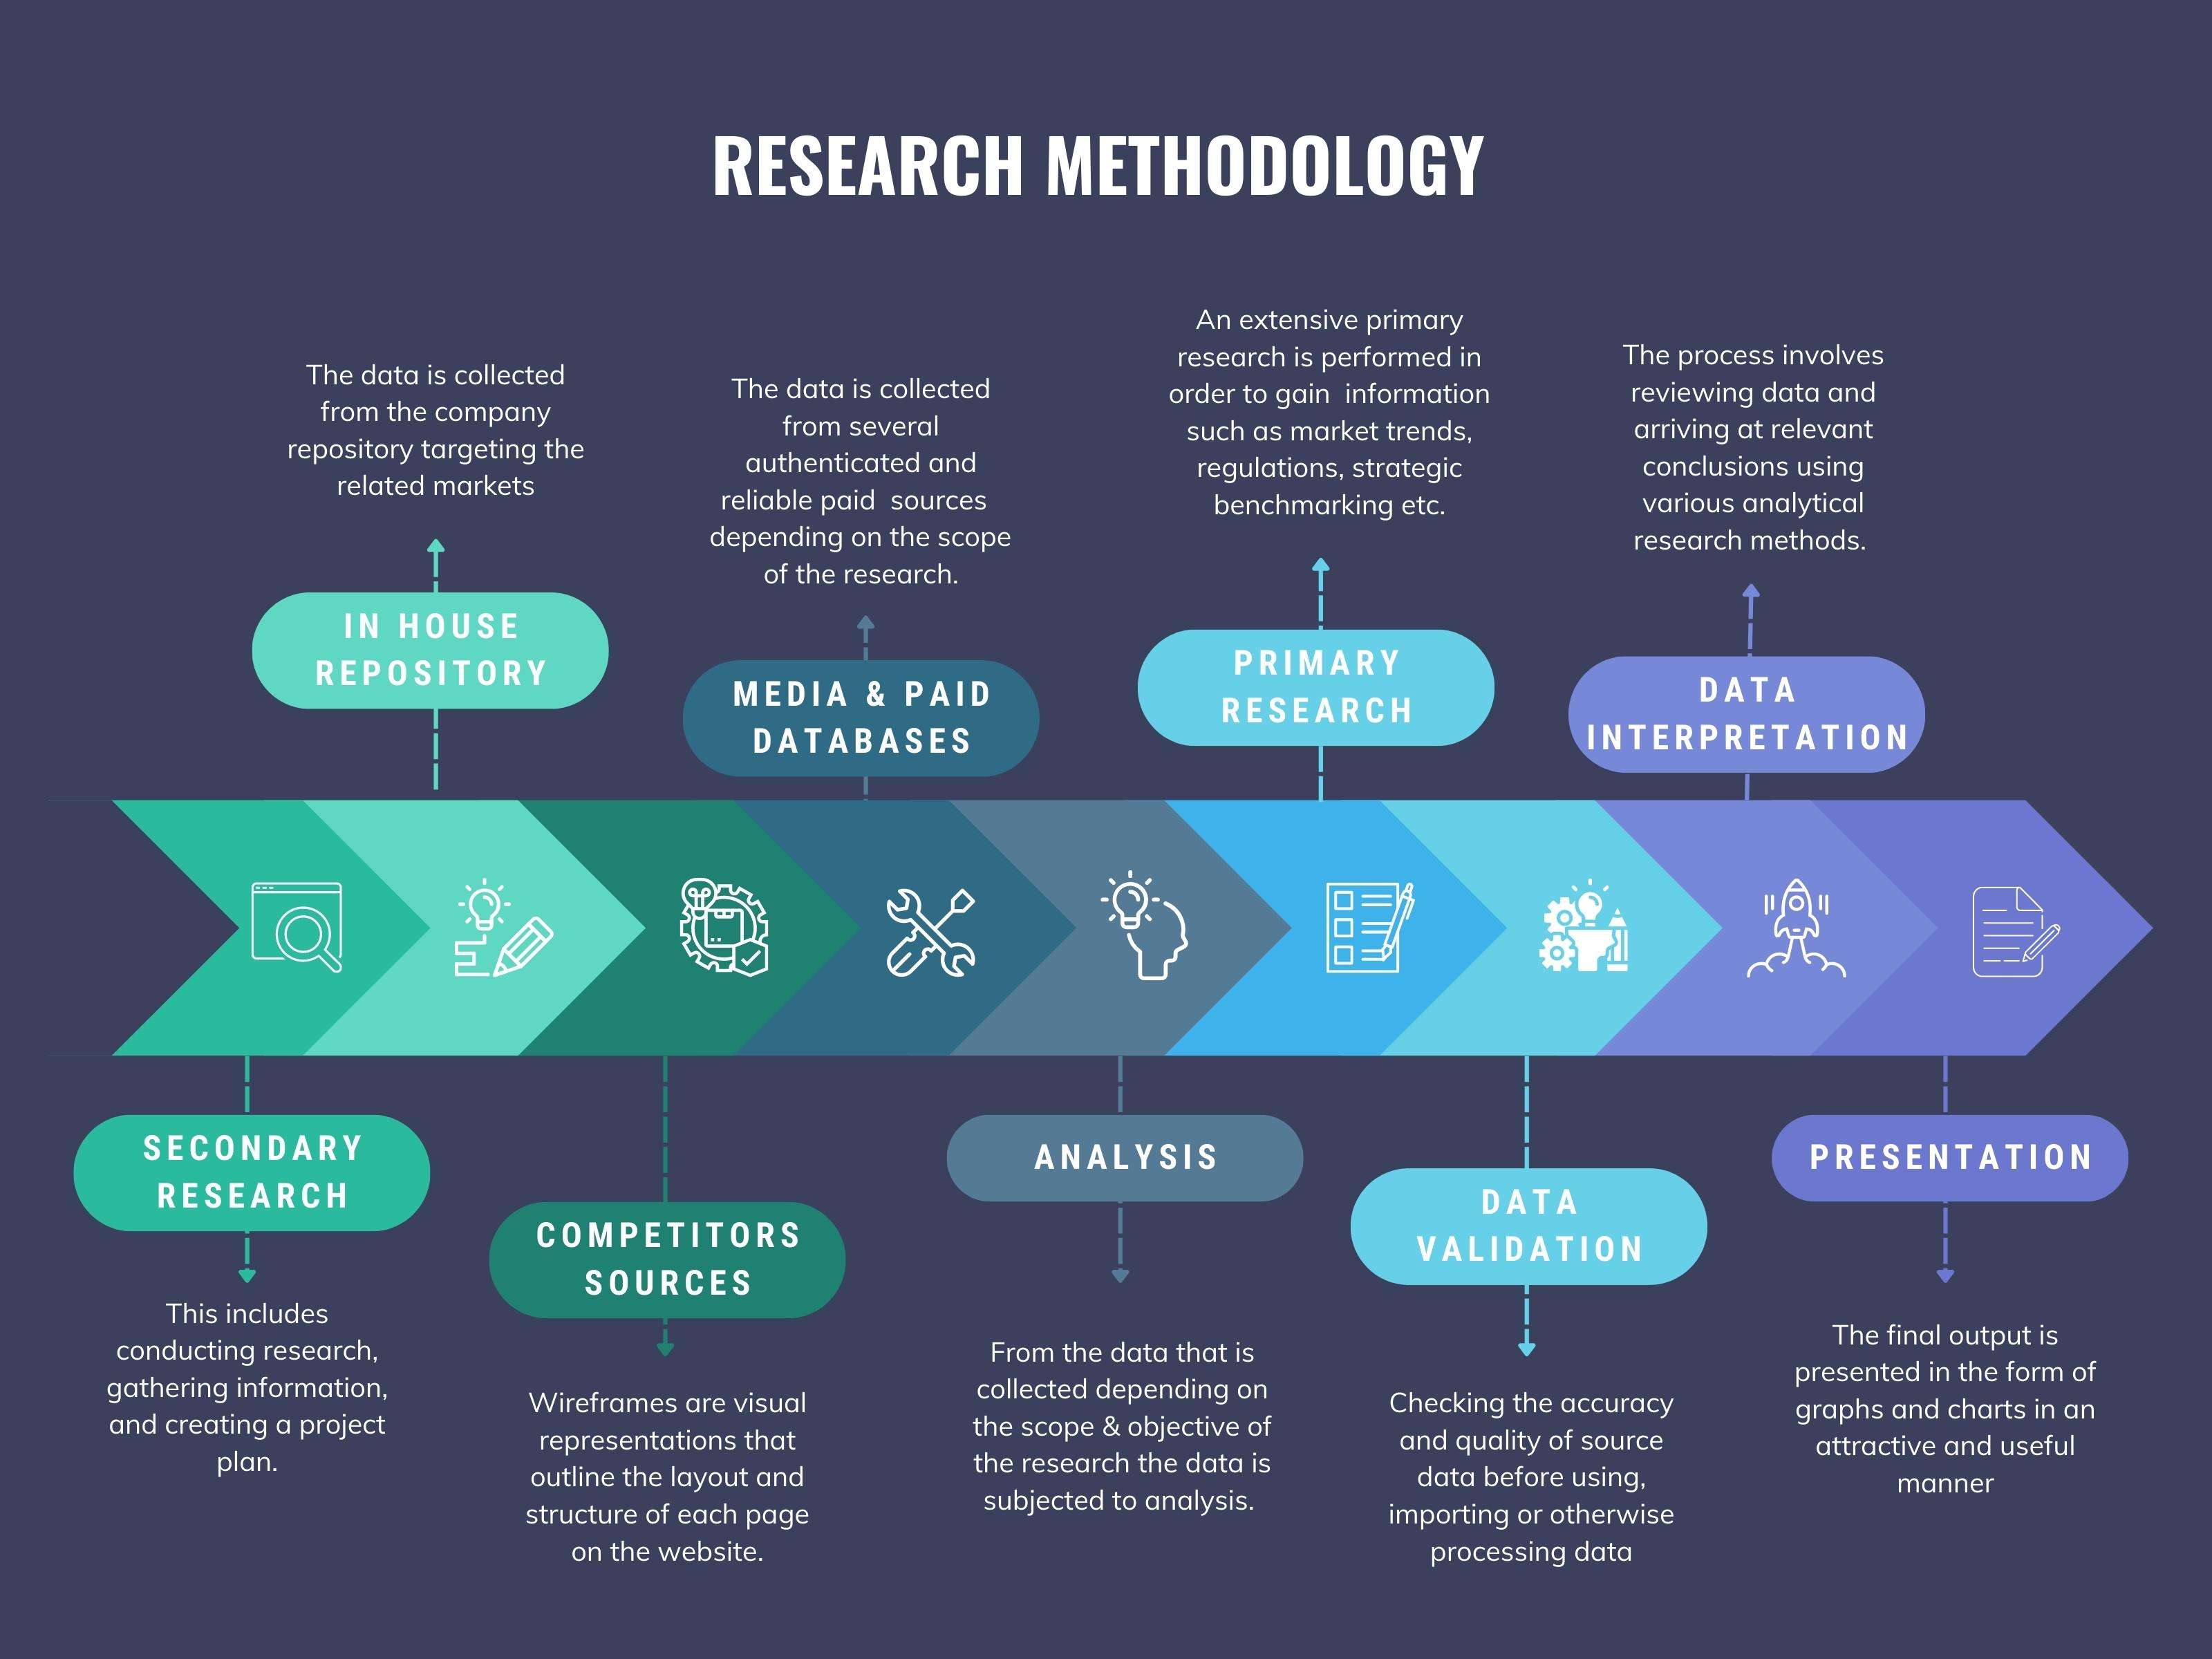
We at ‘Stratistics’ opt for an extensive research approach which involves data mining, data validation, and data analysis. The various research sources include in-house repository, secondary research, competitor’s sources, social media research, client internal data, and primary research.
Our team of analysts prefers the most reliable and authenticated data sources in order to perform the comprehensive literature search. With access to most of the authenticated data bases our team highly considers the best mix of information through various sources to obtain extensive and accurate analysis.
Each report takes an average time of a month and a team of 4 industry analysts. The time may vary depending on the scope and data availability of the desired market report. The various parameters used in the market assessment are standardized in order to enhance the data accuracy.
Data Mining
The data is collected from several authenticated, reliable, paid and unpaid sources and is filtered depending on the scope & objective of the research. Our reports repository acts as an added advantage in this procedure. Data gathering from the raw material suppliers, distributors and the manufacturers is performed on a regular basis, this helps in the comprehensive understanding of the products value chain. Apart from the above mentioned sources the data is also collected from the industry consultants to ensure the objective of the study is in the right direction.
Market trends such as technological advancements, regulatory affairs, market dynamics (Drivers, Restraints, Opportunities and Challenges) are obtained from scientific journals, market related national & international associations and organizations.
Data Analysis
From the data that is collected depending on the scope & objective of the research the data is subjected for the analysis. The critical steps that we follow for the data analysis include:
- Product Lifecycle Analysis
- Competitor analysis
- Risk analysis
- Porters Analysis
- PESTEL Analysis
- SWOT Analysis
The data engineering is performed by the core industry experts considering both the Marketing Mix Modeling and the Demand Forecasting. The marketing mix modeling makes use of multiple-regression techniques to predict the optimal mix of marketing variables. Regression factor is based on a number of variables and how they relate to an outcome such as sales or profits.
Data Validation
The data validation is performed by the exhaustive primary research from the expert interviews. This includes telephonic interviews, focus groups, face to face interviews, and questionnaires to validate our research from all aspects. The industry experts we approach come from the leading firms, involved in the supply chain ranging from the suppliers, distributors to the manufacturers and consumers so as to ensure an unbiased analysis.
We are in touch with more than 15,000 industry experts with the right mix of consultants, CEO's, presidents, vice presidents, managers, experts from both supply side and demand side, executives and so on.
The data validation involves the primary research from the industry experts belonging to:
- Leading Companies
- Suppliers & Distributors
- Manufacturers
- Consumers
- Industry/Strategic Consultants
Apart from the data validation the primary research also helps in performing the fill gap research, i.e. providing solutions for the unmet needs of the research which helps in enhancing the reports quality.
For more details about research methodology, kindly write to us at info@strategymrc.com
Frequently Asked Questions
In case of any queries regarding this report, you can contact the customer service by filing the “Inquiry Before Buy” form available on the right hand side. You may also contact us through email: info@strategymrc.com or phone: +1-301-202-5929
Yes, the samples are available for all the published reports. You can request them by filling the “Request Sample” option available in this page.
Yes, you can request a sample with your specific requirements. All the customized samples will be provided as per the requirement with the real data masked.
All our reports are available in Digital PDF format. In case if you require them in any other formats, such as PPT, Excel etc you can submit a request through “Inquiry Before Buy” form available on the right hand side. You may also contact us through email: info@strategymrc.com or phone: +1-301-202-5929
We offer a free 15% customization with every purchase. This requirement can be fulfilled for both pre and post sale. You may send your customization requirements through email at info@strategymrc.com or call us on +1-301-202-5929.
We have 3 different licensing options available in electronic format.
- Single User Licence: Allows one person, typically the buyer, to have access to the ordered product. The ordered product cannot be distributed to anyone else.
- 2-5 User Licence: Allows the ordered product to be shared among a maximum of 5 people within your organisation.
- Corporate License: Allows the product to be shared among all employees of your organisation regardless of their geographical location.
All our reports are typically be emailed to you as an attachment.
To order any available report you need to register on our website. The payment can be made either through CCAvenue or PayPal payments gateways which accept all international cards.
We extend our support to 6 months post sale. A post sale customization is also provided to cover your unmet needs in the report.
Request Customization
We offer complimentary customization of up to 15% with every purchase. To share your customization requirements, feel free to email us at info@strategymrc.com or call us on +1-301-202-5929. .
Please Note: Customization within the 15% threshold is entirely free of charge. If your request exceeds this limit, we will conduct a feasibility assessment. Following that, a detailed quote and timeline will be provided.
WHY CHOOSE US ?

Assured Quality
Best in class reports with high standard of research integrity

24X7 Research Support
Continuous support to ensure the best customer experience.

Free Customization
Adding more values to your product of interest.

Safe & Secure Access
Providing a secured environment for all online transactions.

Trusted by 600+ Brands
Serving the most reputed brands across the world.