
Level Sensor Market
Level Sensor Market Forecasts to 2028 - Global Analysis By Technology (Magnetostrictive, Ultrasonic, Hydrostatic, Optical and Other Technologies), Monitoring Type (Point Level Sensing, Continuous Level Sensing and Interface Level Sensing), End User (Food & Beverage, Chemical, Oil & Gas, Industrial Manufacturing, Water & Wastewater Treatment, Pharmaceuticals and Other End Users) and By Geography

|
Years Covered |
2020-2028 |
|
Estimated Year Value (2022) |
US $6.15 BN |
|
Projected Year Value (2028) |
US $10.0 BN |
|
CAGR (2022 - 2028) |
8.5% |
|
Regions Covered |
North America, Europe, Asia Pacific, South America, and Middle East & Africa |
|
Countries Covered |
US, Canada, Mexico, Germany, UK, Italy, France, Spain, Japan, China, India, Australia, New Zealand, South Korea, Rest of Asia Pacific, South America, Argentina, Brazil, Chile, Middle East & Africa, Saudi Arabia, UAE, Qatar, and South Africa |
|
Largest Market |
North America |
|
Highest Growing Market |
Asia Pacific |
According to Stratistics MRC, the Global Level Sensor Market is accounted for $6.15 billion in 2022 and is expected to reach $10.0 billion by 2028 growing at a CAGR of 8.5% during the forecast period. Level sensors are used to determine the position of the surface within a container containing both liquids and solids in the form of powders. The chapter investigates the applicability of several types of sensors for measuring such liquids and solids. Level sensors are largely utilised in the manufacturing and automotive industries, but they can also be found in many residential products, such as refrigerator ice makers thus increase the demand for level sensor market.
According to British Petroleum's Statistical Review of World Energy, 2018, more than 33% of the global refining capacity is concentrated in the Asia-Pacific region. Countries like China, India, Japan, and South Korea have the most active oil and downstream gas sectors in the region, which, together, are responsible for over 78% of the Asia-Pacific oil refining capacity region.
Market Dynamics:
Driver:
Reduced sensor size
Massive technological advancements in the previous decade have resulted in a significant reduction in the size of level sensors, which has played a significant influence in the growth of the level sensor market. The reduction in size and increasing penetration of MEMS technology in the level sensor industry have provided a broad horizon of applications for level sensors in industries such as automotive, aerospace, and defence, health care, industrial chemicals, and so on, accelerating market expansion.
Restraint:
Presence of alternative brand choices
Presence of various brands of level sensors which are available at cheaper cost than that of the brands are gaining importance due to its low cost thus restraining the market. Key players acquire key level sensor technology firms or small scale sensor manufacturers with expertise in a certain technology, a significant geographic presence, and a well-established sales network. Furthermore, leading players develop and integrate strong communication protocols into their level sensor technologies to ensure compliance with specific industrial certification thereby hindering the growth of the market.
Opportunity:
Adoption to industry 4.0
The rapid adoption of AI and IoT in different industries, known as industrial revolution 4.0, has proven to be a driving force in the level sensor industry. Level sensors are employed in industries such as food and beverage, energy and electricity, healthcare, and others that are transitioning to automation due to enhanced precision in redundant processes. The sophisticated sensors are used for a variety of processes that require more precision and accuracy. Furthermore, the incorporation of IoT and machine learning in level sensors has increased their demand in many sectors and aided in the global expansion of the level sensor market.
Threat:
Lack of precision and accuracy
The level sensors however may be widely used equipment but the readings of this equipment may not always be accurate such as if tank level readings are routinely imprecise, the measurements provided are most likely incorrect. This frequently results in reported water levels that are higher than 100% or never reach 100%, even when the tank is full. Level Determination Problems occur in this procedure because the DP cell's sensing line connections were inverted. This is common in systems with high operational pressure but low hydrostatic pressure due to fluid weight. When a DP cell is wrongly attached, the apparent level falls while the true tank level rises which might me inconvenient and takes many repairs which hinders the market.
Covid-19 Impact
With the advent of Covid 19, many end-user industries in the market analysed, such as manufacturing, oil and gas, and others, have been impacted due to reduced operations, temporary plant closures, and so on. Owing to Covid 19, primarily active new projects across the oil and gas value chain, project execution planning and risk management are anticipated to confront numerous obstacles. Major problems in the renewable energy business focus around worldwide supply chains, which are significantly reducing output in order to reduce investing on new measurement systems and sensors.
The Contact level sensors segment is expected to be the largest during the forecast period
The Contact level sensors segment is estimated to have a lucrative growth, due to the use to measure point or continuous levels. Float, optical, Rf capacitance, conductivity, ultrasonic, and tuning fork are examples of types. A level sight gauge is often made out of a tube with apertures towards the top and bottom of the tank. The tube includes a transparent face, allowing the operator to observe the process material level. Several of the same issues that worry touch sensors should be considered, such as agitation, corrosiveness, tackiness, temperature, pressure, and so on, which could harm or obscure the viewing area.
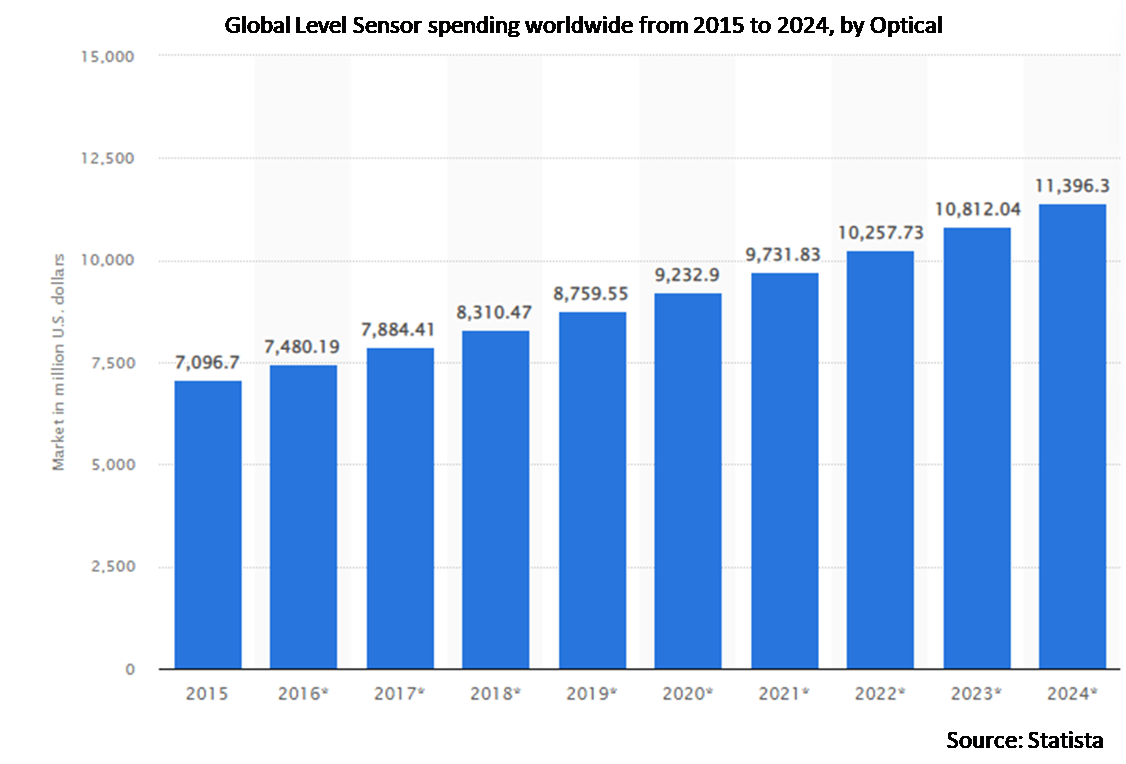
The Optical segment is expected to have the highest CAGR during the forecast period
The Optical segment is anticipated to witness the fastest CAGR growth during the forecast period, due to the optical level sensors are used for point level sensing and can withstand extreme temperatures and pressures. As a result, these sensors may be utilised for both point level detection and continuous monitoring of solids and liquids. These sensors would monitor the level of suspended solids in liquids, and optical level sensors can be utilised in industry to measure corrosive, organic, and aqueous liquids. An infrared LED and a light receiver make up the optical level sensor. These sensors can detect a drop or change in level by transmitting infrared light emitted by an infrared diode. The main benefits of optical level sensors are their small size, lack of moving components, and inexpensive cost which help in expansion of the market.
Region with largest share:
North America is projected to hold the largest market share during the forecast period owing to rising expenditures in automation and a focus on process efficiency across the pharmaceutical, oil and gas, and food processing industries. In the North American level sensor market, several technologies are used. Because of the tiny size and mobility of the sensors, ultrasonic is one of the most preferred approaches. The sensors are also simple to use and inexpensive. The sensors do not require much upkeep. Ultrasonic sensors are mostly used to detect solid substances and their capacity to perform in harsh environments encourages the market growth in this region.
Region with highest CAGR:
Asia Pacific is projected to have the highest CAGR over the forecast period, owing to result of technological developments and widespread usage of technology across a wide range of sectors. The level sensors market in Asia Pacific is expected to grow due to increased adoption of level sensors in several sectors such as industrial manufacturing, chemicals, and pharmaceuticals. China is expected to experience exponential growth in level sensors, owing to the combination of advanced signal conditioning with packaging techniques and high technology sensors that provide ideal extensive solutions for accurate, reliable, and economical level measurement thus enhancing the market the this region.

Key players in the market
Some of the key players profiled in the Level Sensor Market include Emerson Electric company, Texas Instruments Incorporated, ABB Ltd, Pepperl+Fuchs GmbH, Siemens AG, TE Connectivity Ltd, Nohken Inc, AMETEK Inc, Fortive Corporation, Honeywell, Schneider Electric, Gems Sensors, Endress+Hauser and Vega Grishaber KG
Key Developments:
In November 2020, Emerson SureService™ Long Term Service Agreements for measurement and analytical products allows you time to focus on your core business while factory trained, Rosemount certified personnel delve their knowledge, experience and best practices necessary to help you achieve your business goals.
Types Covered:
• Noncontact Level Sensors
• Contact Level Sensors
Technologies Covered:
• Magnetostrictive
• Ultrasonic
• Hydrostatic
• Optical
• Other Technologies
Monitoring Types Covered:
• Point Level Sensing
• Continuous Level Sensing
• Interface Level Sensing
End Users Covered:
• Food & Beverage
• Chemical
• Oil & Gas
• Industrial Manufacturing
• Water & Wastewater Treatment
• Pharmaceuticals
• Other End Users
Regions Covered:
• North America
o US
o Canada
o Mexico
• Europe
o Germany
o UK
o Italy
o France
o Spain
o Rest of Europe
• Asia Pacific
o Japan
o China
o India
o Australia
o New Zealand
o South Korea
o Rest of Asia Pacific
• South America
o Argentina
o Brazil
o Chile
o Rest of South America
• Middle East & Africa
o Saudi Arabia
o UAE
o Qatar
o South Africa
o Rest of Middle East & Africa
What our report offers:
- Market share assessments for the regional and country-level segments
- Strategic recommendations for the new entrants
- Covers Market data for the years 2020, 2021, 2022, 2025, and 2028
- Market Trends (Drivers, Constraints, Opportunities, Threats, Challenges, Investment Opportunities, and recommendations)
- Strategic recommendations in key business segments based on the market estimations
- Competitive landscaping mapping the key common trends
- Company profiling with detailed strategies, financials, and recent developments
- Supply chain trends mapping the latest technological advancements
Free Customization Offerings:
All the customers of this report will be entitled to receive one of the following free customization options:
• Company Profiling
o Comprehensive profiling of additional market players (up to 3)
o SWOT Analysis of key players (up to 3)
• Regional Segmentation
o Market estimations, Forecasts and CAGR of any prominent country as per the client's interest (Note: Depends on feasibility check)
• Competitive Benchmarking
o Benchmarking of key players based on product portfolio, geographical presence, and strategic alliances
Table of Contents
1 Executive Summary
2 Preface
2.1 Abstract
2.2 Stake Holders
2.3 Research Scope
2.4 Research Methodology
2.4.1 Data Mining
2.4.2 Data Analysis
2.4.3 Data Validation
2.4.4 Research Approach
2.5 Research Sources
2.5.1 Primary Research Sources
2.5.2 Secondary Research Sources
2.5.3 Assumptions
3 Market Trend Analysis
3.1 Introduction
3.2 Drivers
3.3 Restraints
3.4 Opportunities
3.5 Threats
3.6 Technology Analysis
3.7 End User Analysis
3.8 Emerging Markets
3.9 Impact of Covid-19
4 Porters Five Force Analysis
4.1 Bargaining power of suppliers
4.2 Bargaining power of buyers
4.3 Threat of substitutes
4.4 Threat of new entrants
4.5 Competitive rivalry
5 Global Level Sensor Market, By Type
5.1 Introduction
5.2 Noncontact Level Sensors
5.3 Contact Level Sensors
6 Global Level Sensor Market, By Technology
6.1 Introduction
6.2 Magnetostrictive
6.3 Ultrasonic
6.4 Hydrostatic
6.5 Optical
6.6 Other Technologies
7 Global Level Sensor Market, By Monitoring Type
7.1 Introduction
7.2 Point Level Sensing
7.3 Continuous Level Sensing
7.4 Interface Level Sensing
8 Global Level Sensor Market, By End User
8.1 Introduction
8.2 Food & Beverage
8.3 Chemical
8.4 Oil & Gas
8.5 Industrial Manufacturing
8.6 Water & Wastewater Treatment
8.7 Pharmaceuticals
8.8 Other End Users
9 Global Level Sensor Market, By Geography
9.1 Introduction
9.2 North America
9.2.1 US
9.2.2 Canada
9.2.3 Mexico
9.3 Europe
9.3.1 Germany
9.3.2 UK
9.3.3 Italy
9.3.4 France
9.3.5 Spain
9.3.6 Rest of Europe
9.4 Asia Pacific
9.4.1 Japan
9.4.2 China
9.4.3 India
9.4.4 Australia
9.4.5 New Zealand
9.4.6 South Korea
9.4.7 Rest of Asia Pacific
9.5 South America
9.5.1 Argentina
9.5.2 Brazil
9.5.3 Chile
9.5.4 Rest of South America
9.6 Middle East & Africa
9.6.1 Saudi Arabia
9.6.2 UAE
9.6.3 Qatar
9.6.4 South Africa
9.6.5 Rest of Middle East & Africa
10 Key Developments
10.1 Agreements, Partnerships, Collaborations and Joint Ventures
10.2 Acquisitions & Mergers
10.3 New Product Launch
10.4 Expansions
10.5 Other Key Strategies
11 Company Profiling
11.1 Emerson Electric company
11.2 Texas Instruments Incorporated
11.3 ABB Ltd
11.4 Pepperl+Fuchs GmbH
11.5 Siemens AG
11.6 TE Connectivity Ltd
11.7 Nohken Inc
11.8 AMETEK Inc
11.9 Fortive Corporation
11.10 Honeywell
11.11 Schneider Electric
11.12 Gems Sensors
11.13 Endress+Hauser
11.14 Vega Grishaber KG
List of Tables
1 Global Level Sensor Market Outlook, By Region (2020-2028) ($MN)
2 Global Level Sensor Market Outlook, By Type (2020-2028) ($MN)
3 Global Level Sensor Market Outlook, By Noncontact Level Sensors (2020-2028) ($MN)
4 Global Level Sensor Market Outlook, By Contact Level Sensors (2020-2028) ($MN)
5 Global Level Sensor Market Outlook, By Technology (2020-2028) ($MN)
6 Global Level Sensor Market Outlook, By Magnetostrictive (2020-2028) ($MN)
7 Global Level Sensor Market Outlook, By Ultrasonic (2020-2028) ($MN)
8 Global Level Sensor Market Outlook, By Hydrostatic (2020-2028) ($MN)
9 Global Level Sensor Market Outlook, By Optical (2020-2028) ($MN)
10 Global Level Sensor Market Outlook, By Other Technologies (2020-2028) ($MN)
11 Global Level Sensor Market Outlook, By Monitoring Type (2020-2028) ($MN)
12 Global Level Sensor Market Outlook, By Point Level Sensing (2020-2028) ($MN)
13 Global Level Sensor Market Outlook, By Continuous Level Sensing (2020-2028) ($MN)
14 Global Level Sensor Market Outlook, By Interface Level Sensing (2020-2028) ($MN)
15 Global Level Sensor Market Outlook, By End User (2020-2028) ($MN)
16 Global Level Sensor Market Outlook, By Food & Beverage (2020-2028) ($MN)
17 Global Level Sensor Market Outlook, By Chemical (2020-2028) ($MN)
18 Global Level Sensor Market Outlook, By Oil & Gas (2020-2028) ($MN)
19 Global Level Sensor Market Outlook, By Industrial Manufacturing (2020-2028) ($MN)
20 Global Level Sensor Market Outlook, By Water & Wastewater Treatment (2020-2028) ($MN)
21 Global Level Sensor Market Outlook, By Pharmaceuticals (2020-2028) ($MN)
22 Global Level Sensor Market Outlook, By Other End Users (2020-2028) ($MN)
23 North America Level Sensor Market Outlook, By Country (2020-2028) ($MN)
24 North America Level Sensor Market Outlook, By Type (2020-2028) ($MN)
25 North America Level Sensor Market Outlook, By Noncontact Level Sensors (2020-2028) ($MN)
26 North America Level Sensor Market Outlook, By Contact Level Sensors (2020-2028) ($MN)
27 North America Level Sensor Market Outlook, By Technology (2020-2028) ($MN)
28 North America Level Sensor Market Outlook, By Magnetostrictive (2020-2028) ($MN)
29 North America Level Sensor Market Outlook, By Ultrasonic (2020-2028) ($MN)
30 North America Level Sensor Market Outlook, By Hydrostatic (2020-2028) ($MN)
31 North America Level Sensor Market Outlook, By Optical (2020-2028) ($MN)
32 North America Level Sensor Market Outlook, By Other Technologies (2020-2028) ($MN)
33 North America Level Sensor Market Outlook, By Monitoring Type (2020-2028) ($MN)
34 North America Level Sensor Market Outlook, By Point Level Sensing (2020-2028) ($MN)
35 North America Level Sensor Market Outlook, By Continuous Level Sensing (2020-2028) ($MN)
36 North America Level Sensor Market Outlook, By Interface Level Sensing (2020-2028) ($MN)
37 North America Level Sensor Market Outlook, By End User (2020-2028) ($MN)
38 North America Level Sensor Market Outlook, By Food & Beverage (2020-2028) ($MN)
39 North America Level Sensor Market Outlook, By Chemical (2020-2028) ($MN)
40 North America Level Sensor Market Outlook, By Oil & Gas (2020-2028) ($MN)
41 North America Level Sensor Market Outlook, By Industrial Manufacturing (2020-2028) ($MN)
42 North America Level Sensor Market Outlook, By Water & Wastewater Treatment (2020-2028) ($MN)
43 North America Level Sensor Market Outlook, By Pharmaceuticals (2020-2028) ($MN)
44 North America Level Sensor Market Outlook, By Other End Users (2020-2028) ($MN)
45 Europe Level Sensor Market Outlook, By Country (2020-2028) ($MN)
46 Europe Level Sensor Market Outlook, By Type (2020-2028) ($MN)
47 Europe Level Sensor Market Outlook, By Noncontact Level Sensors (2020-2028) ($MN)
48 Europe Level Sensor Market Outlook, By Contact Level Sensors (2020-2028) ($MN)
49 Europe Level Sensor Market Outlook, By Technology (2020-2028) ($MN)
50 Europe Level Sensor Market Outlook, By Magnetostrictive (2020-2028) ($MN)
51 Europe Level Sensor Market Outlook, By Ultrasonic (2020-2028) ($MN)
52 Europe Level Sensor Market Outlook, By Hydrostatic (2020-2028) ($MN)
53 Europe Level Sensor Market Outlook, By Optical (2020-2028) ($MN)
54 Europe Level Sensor Market Outlook, By Other Technologies (2020-2028) ($MN)
55 Europe Level Sensor Market Outlook, By Monitoring Type (2020-2028) ($MN)
56 Europe Level Sensor Market Outlook, By Point Level Sensing (2020-2028) ($MN)
57 Europe Level Sensor Market Outlook, By Continuous Level Sensing (2020-2028) ($MN)
58 Europe Level Sensor Market Outlook, By Interface Level Sensing (2020-2028) ($MN)
59 Europe Level Sensor Market Outlook, By End User (2020-2028) ($MN)
60 Europe Level Sensor Market Outlook, By Food & Beverage (2020-2028) ($MN)
61 Europe Level Sensor Market Outlook, By Chemical (2020-2028) ($MN)
62 Europe Level Sensor Market Outlook, By Oil & Gas (2020-2028) ($MN)
63 Europe Level Sensor Market Outlook, By Industrial Manufacturing (2020-2028) ($MN)
64 Europe Level Sensor Market Outlook, By Water & Wastewater Treatment (2020-2028) ($MN)
65 Europe Level Sensor Market Outlook, By Pharmaceuticals (2020-2028) ($MN)
66 Europe Level Sensor Market Outlook, By Other End Users (2020-2028) ($MN)
67 Asia Pacific Level Sensor Market Outlook, By Country (2020-2028) ($MN)
68 Asia Pacific Level Sensor Market Outlook, By Type (2020-2028) ($MN)
69 Asia Pacific Level Sensor Market Outlook, By Noncontact Level Sensors (2020-2028) ($MN)
70 Asia Pacific Level Sensor Market Outlook, By Contact Level Sensors (2020-2028) ($MN)
71 Asia Pacific Level Sensor Market Outlook, By Technology (2020-2028) ($MN)
72 Asia Pacific Level Sensor Market Outlook, By Magnetostrictive (2020-2028) ($MN)
73 Asia Pacific Level Sensor Market Outlook, By Ultrasonic (2020-2028) ($MN)
74 Asia Pacific Level Sensor Market Outlook, By Hydrostatic (2020-2028) ($MN)
75 Asia Pacific Level Sensor Market Outlook, By Optical (2020-2028) ($MN)
76 Asia Pacific Level Sensor Market Outlook, By Other Technologies (2020-2028) ($MN)
77 Asia Pacific Level Sensor Market Outlook, By Monitoring Type (2020-2028) ($MN)
78 Asia Pacific Level Sensor Market Outlook, By Point Level Sensing (2020-2028) ($MN)
79 Asia Pacific Level Sensor Market Outlook, By Continuous Level Sensing (2020-2028) ($MN)
80 Asia Pacific Level Sensor Market Outlook, By Interface Level Sensing (2020-2028) ($MN)
81 Asia Pacific Level Sensor Market Outlook, By End User (2020-2028) ($MN)
82 Asia Pacific Level Sensor Market Outlook, By Food & Beverage (2020-2028) ($MN)
83 Asia Pacific Level Sensor Market Outlook, By Chemical (2020-2028) ($MN)
84 Asia Pacific Level Sensor Market Outlook, By Oil & Gas (2020-2028) ($MN)
85 Asia Pacific Level Sensor Market Outlook, By Industrial Manufacturing (2020-2028) ($MN)
86 Asia Pacific Level Sensor Market Outlook, By Water & Wastewater Treatment (2020-2028) ($MN)
87 Asia Pacific Level Sensor Market Outlook, By Pharmaceuticals (2020-2028) ($MN)
88 Asia Pacific Level Sensor Market Outlook, By Other End Users (2020-2028) ($MN)
89 South America Level Sensor Market Outlook, By Country (2020-2028) ($MN)
90 South America Level Sensor Market Outlook, By Type (2020-2028) ($MN)
91 South America Level Sensor Market Outlook, By Noncontact Level Sensors (2020-2028) ($MN)
92 South America Level Sensor Market Outlook, By Contact Level Sensors (2020-2028) ($MN)
93 South America Level Sensor Market Outlook, By Technology (2020-2028) ($MN)
94 South America Level Sensor Market Outlook, By Magnetostrictive (2020-2028) ($MN)
95 South America Level Sensor Market Outlook, By Ultrasonic (2020-2028) ($MN)
96 South America Level Sensor Market Outlook, By Hydrostatic (2020-2028) ($MN)
97 South America Level Sensor Market Outlook, By Optical (2020-2028) ($MN)
98 South America Level Sensor Market Outlook, By Other Technologies (2020-2028) ($MN)
99 South America Level Sensor Market Outlook, By Monitoring Type (2020-2028) ($MN)
100 South America Level Sensor Market Outlook, By Point Level Sensing (2020-2028) ($MN)
101 South America Level Sensor Market Outlook, By Continuous Level Sensing (2020-2028) ($MN)
102 South America Level Sensor Market Outlook, By Interface Level Sensing (2020-2028) ($MN)
103 South America Level Sensor Market Outlook, By End User (2020-2028) ($MN)
104 South America Level Sensor Market Outlook, By Food & Beverage (2020-2028) ($MN)
105 South America Level Sensor Market Outlook, By Chemical (2020-2028) ($MN)
106 South America Level Sensor Market Outlook, By Oil & Gas (2020-2028) ($MN)
107 South America Level Sensor Market Outlook, By Industrial Manufacturing (2020-2028) ($MN)
108 South America Level Sensor Market Outlook, By Water & Wastewater Treatment (2020-2028) ($MN)
109 South America Level Sensor Market Outlook, By Pharmaceuticals (2020-2028) ($MN)
110 South America Level Sensor Market Outlook, By Other End Users (2020-2028) ($MN)
111 Middle East & Africa Level Sensor Market Outlook, By Country (2020-2028) ($MN)
112 Middle East & Africa Level Sensor Market Outlook, By Type (2020-2028) ($MN)
113 Middle East & Africa Level Sensor Market Outlook, By Noncontact Level Sensors (2020-2028) ($MN)
114 Middle East & Africa Level Sensor Market Outlook, By Contact Level Sensors (2020-2028) ($MN)
115 Middle East & Africa Level Sensor Market Outlook, By Technology (2020-2028) ($MN)
116 Middle East & Africa Level Sensor Market Outlook, By Magnetostrictive (2020-2028) ($MN)
117 Middle East & Africa Level Sensor Market Outlook, By Ultrasonic (2020-2028) ($MN)
118 Middle East & Africa Level Sensor Market Outlook, By Hydrostatic (2020-2028) ($MN)
119 Middle East & Africa Level Sensor Market Outlook, By Optical (2020-2028) ($MN)
120 Middle East & Africa Level Sensor Market Outlook, By Other Technologies (2020-2028) ($MN)
121 Middle East & Africa Level Sensor Market Outlook, By Monitoring Type (2020-2028) ($MN)
122 Middle East & Africa Level Sensor Market Outlook, By Point Level Sensing (2020-2028) ($MN)
123 Middle East & Africa Level Sensor Market Outlook, By Continuous Level Sensing (2020-2028) ($MN)
124 Middle East & Africa Level Sensor Market Outlook, By Interface Level Sensing (2020-2028) ($MN)
125 Middle East & Africa Level Sensor Market Outlook, By End User (2020-2028) ($MN)
126 Middle East & Africa Level Sensor Market Outlook, By Food & Beverage (2020-2028) ($MN)
127 Middle East & Africa Level Sensor Market Outlook, By Chemical (2020-2028) ($MN)
128 Middle East & Africa Level Sensor Market Outlook, By Oil & Gas (2020-2028) ($MN)
129 Middle East & Africa Level Sensor Market Outlook, By Industrial Manufacturing (2020-2028) ($MN)
130 Middle East & Africa Level Sensor Market Outlook, By Water & Wastewater Treatment (2020-2028) ($MN)
131 Middle East & Africa Level Sensor Market Outlook, By Pharmaceuticals (2020-2028) ($MN)
132 Middle East & Africa Level Sensor Market Outlook, By Other End Users (2020-2028) ($MN)
List of Figures
RESEARCH METHODOLOGY

We at ‘Stratistics’ opt for an extensive research approach which involves data mining, data validation, and data analysis. The various research sources include in-house repository, secondary research, competitor’s sources, social media research, client internal data, and primary research.
Our team of analysts prefers the most reliable and authenticated data sources in order to perform the comprehensive literature search. With access to most of the authenticated data bases our team highly considers the best mix of information through various sources to obtain extensive and accurate analysis.
Each report takes an average time of a month and a team of 4 industry analysts. The time may vary depending on the scope and data availability of the desired market report. The various parameters used in the market assessment are standardized in order to enhance the data accuracy.
Data Mining
The data is collected from several authenticated, reliable, paid and unpaid sources and is filtered depending on the scope & objective of the research. Our reports repository acts as an added advantage in this procedure. Data gathering from the raw material suppliers, distributors and the manufacturers is performed on a regular basis, this helps in the comprehensive understanding of the products value chain. Apart from the above mentioned sources the data is also collected from the industry consultants to ensure the objective of the study is in the right direction.
Market trends such as technological advancements, regulatory affairs, market dynamics (Drivers, Restraints, Opportunities and Challenges) are obtained from scientific journals, market related national & international associations and organizations.
Data Analysis
From the data that is collected depending on the scope & objective of the research the data is subjected for the analysis. The critical steps that we follow for the data analysis include:
- Product Lifecycle Analysis
- Competitor analysis
- Risk analysis
- Porters Analysis
- PESTEL Analysis
- SWOT Analysis
The data engineering is performed by the core industry experts considering both the Marketing Mix Modeling and the Demand Forecasting. The marketing mix modeling makes use of multiple-regression techniques to predict the optimal mix of marketing variables. Regression factor is based on a number of variables and how they relate to an outcome such as sales or profits.
Data Validation
The data validation is performed by the exhaustive primary research from the expert interviews. This includes telephonic interviews, focus groups, face to face interviews, and questionnaires to validate our research from all aspects. The industry experts we approach come from the leading firms, involved in the supply chain ranging from the suppliers, distributors to the manufacturers and consumers so as to ensure an unbiased analysis.
We are in touch with more than 15,000 industry experts with the right mix of consultants, CEO's, presidents, vice presidents, managers, experts from both supply side and demand side, executives and so on.
The data validation involves the primary research from the industry experts belonging to:
- Leading Companies
- Suppliers & Distributors
- Manufacturers
- Consumers
- Industry/Strategic Consultants
Apart from the data validation the primary research also helps in performing the fill gap research, i.e. providing solutions for the unmet needs of the research which helps in enhancing the reports quality.
For more details about research methodology, kindly write to us at info@strategymrc.com
Frequently Asked Questions
In case of any queries regarding this report, you can contact the customer service by filing the “Inquiry Before Buy” form available on the right hand side. You may also contact us through email: info@strategymrc.com or phone: +1-301-202-5929
Yes, the samples are available for all the published reports. You can request them by filling the “Request Sample” option available in this page.
Yes, you can request a sample with your specific requirements. All the customized samples will be provided as per the requirement with the real data masked.
All our reports are available in Digital PDF format. In case if you require them in any other formats, such as PPT, Excel etc you can submit a request through “Inquiry Before Buy” form available on the right hand side. You may also contact us through email: info@strategymrc.com or phone: +1-301-202-5929
We offer a free 15% customization with every purchase. This requirement can be fulfilled for both pre and post sale. You may send your customization requirements through email at info@strategymrc.com or call us on +1-301-202-5929.
We have 3 different licensing options available in electronic format.
- Single User Licence: Allows one person, typically the buyer, to have access to the ordered product. The ordered product cannot be distributed to anyone else.
- 2-5 User Licence: Allows the ordered product to be shared among a maximum of 5 people within your organisation.
- Corporate License: Allows the product to be shared among all employees of your organisation regardless of their geographical location.
All our reports are typically be emailed to you as an attachment.
To order any available report you need to register on our website. The payment can be made either through CCAvenue or PayPal payments gateways which accept all international cards.
We extend our support to 6 months post sale. A post sale customization is also provided to cover your unmet needs in the report.
Request Customization
We offer complimentary customization of up to 15% with every purchase. To share your customization requirements, feel free to email us at info@strategymrc.com or call us on +1-301-202-5929. .
Please Note: Customization within the 15% threshold is entirely free of charge. If your request exceeds this limit, we will conduct a feasibility assessment. Following that, a detailed quote and timeline will be provided.
WHY CHOOSE US ?

Assured Quality
Best in class reports with high standard of research integrity

24X7 Research Support
Continuous support to ensure the best customer experience.

Free Customization
Adding more values to your product of interest.

Safe & Secure Access
Providing a secured environment for all online transactions.

Trusted by 600+ Brands
Serving the most reputed brands across the world.