
Localized Air Quality Monitoring Market
Localized Air Quality Monitoring Market Forecasts to 2034 - Global Analysis By Component (Hardware, Solutions and Services), Pollutant Type, Deployment Type, Technology, Application, End User and By Geography

|
Years Covered |
2023-2034 |
|
Estimated Year Value (2026) |
US $5.84 BN |
|
Projected Year Value (2034) |
US $9.45 BN |
|
CAGR (2026-2034) |
6.2% |
|
Regions Covered |
North America, Europe, Asia Pacific, South America, and Rest of the World (RoW) |
|
Countries Covered |
United States, Canada, Mexico, United Kingdom, Germany, France, Italy, Spain, Netherlands, Belgium, Sweden, Switzerland, Poland, Rest of Europe, China, Japan, India, South Korea, Australia, Indonesia, Thailand, Malaysia, Singapore, Vietnam, Rest of Asia Pacific, Brazil, Argentina, Colombia, Chile, Peru, Rest of South America, Saudi Arabia, United Arab Emirates, Qatar, Israel, Rest of Middle East, South Africa, Egypt, Morocco, and Rest of Africa. |
|
Largest Market |
Europe |
|
Highest Growing Market |
Asia Pacific |
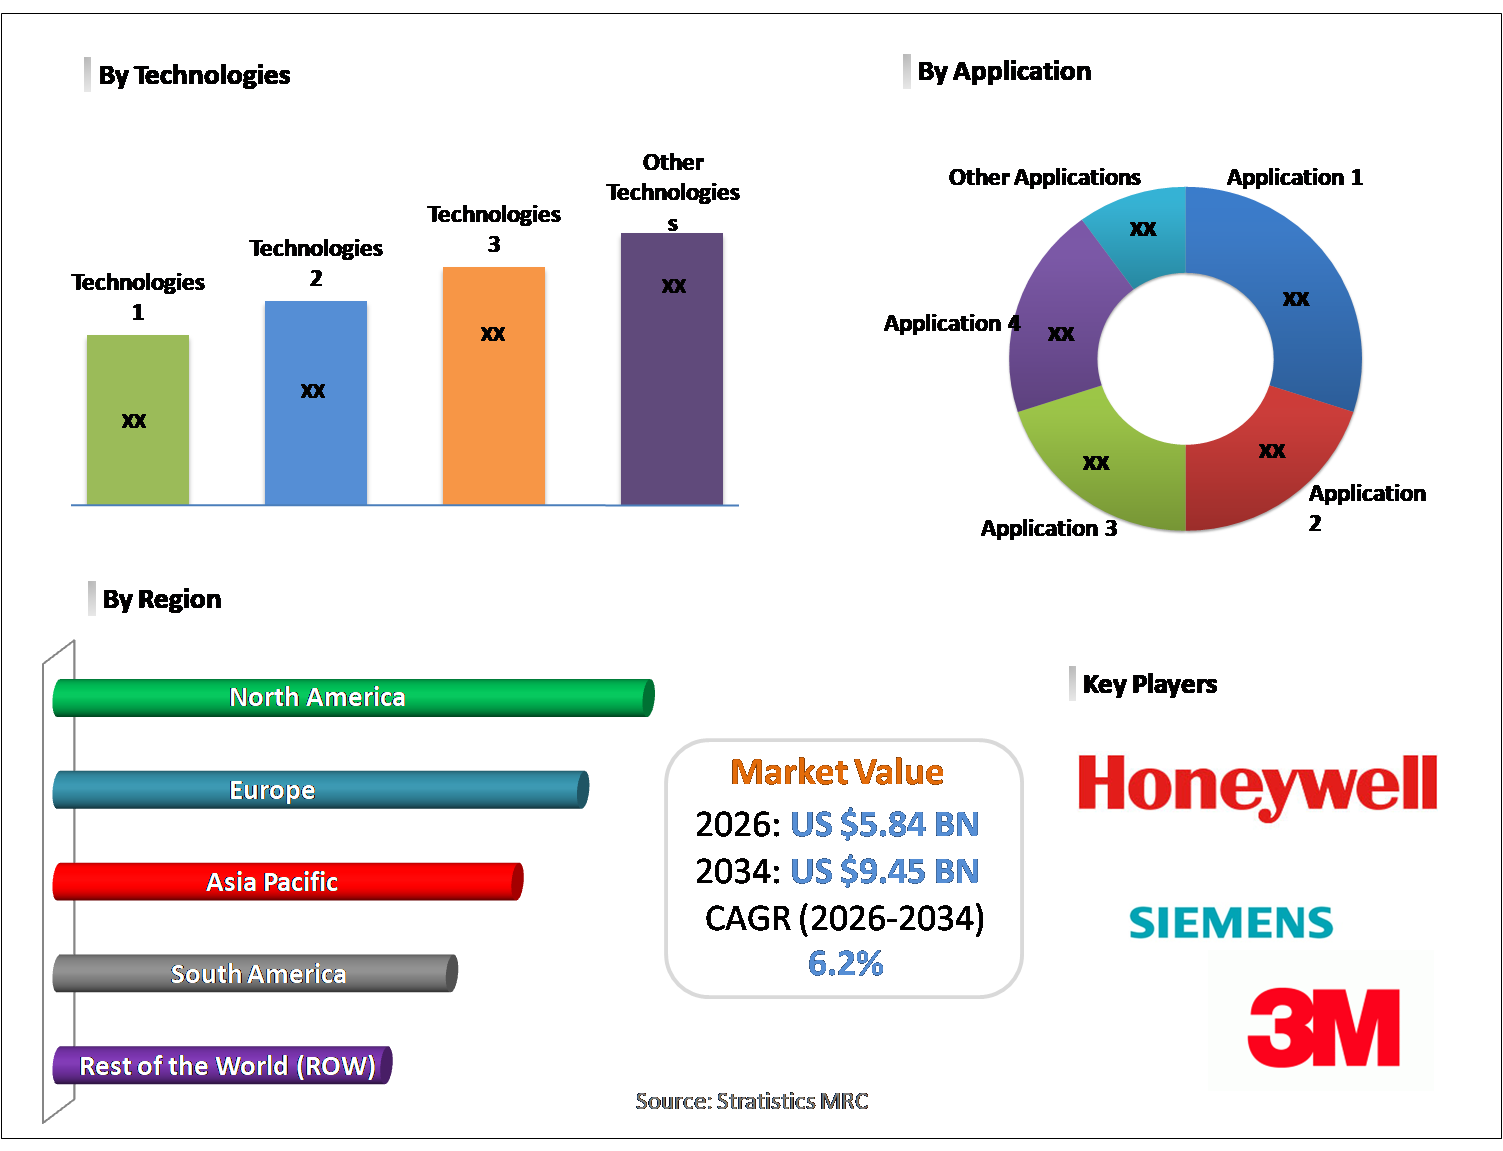
According to Stratistics MRC, the Global Localized Air Quality Monitoring Market is accounted for $5.84 billion in 2026 and is expected to reach $9.45 billion by 2034 growing at a CAGR of 6.2% during the forecast period. Localized Air Quality Monitoring refers to the systematic measurement and analysis of air pollutants at a granular, community or site-specific level, providing real-time insights into environmental conditions. Unlike traditional broad-scale monitoring, it leverages advanced sensors, IoT devices, and cloud-based analytics to capture data on particulate matter, gases, and other harmful substances with high spatial and temporal resolution. This localized approach enables precise identification of pollution sources, supports regulatory compliance, informs public health initiatives, and empowers cities, industries, and individuals to implement targeted mitigation strategies for cleaner, healthier environments.
Market Dynamics:
Driver:
Rising Health & Pollution Awareness
Growing public and governmental awareness of air pollution’s adverse effects on human health is driving the adoption of localized air quality monitoring solutions. Concerns over respiratory illnesses, cardiovascular diseases, and overall environmental quality are prompting communities and industries to invest in real-time monitoring systems. This heightened consciousness, coupled with increasing urbanization and industrial emissions, is encouraging proactive measures, making localized monitoring a crucial tool for safeguarding public health and promoting sustainable urban development worldwide.
Restraint:
High Costs of Equipment & Deployment
The widespread adoption of localized air quality monitoring is restrained by the substantial costs associated with advanced sensors, IoT devices, and comprehensive deployment infrastructure. Installation, calibration, and ongoing maintenance expenses can be prohibitive, especially for small municipalities and developing regions. These financial challenges may limit market penetration, slowing adoption rates despite growing awareness. Consequently, the high capital investment and operational costs remain significant barriers, particularly in price sensitive areas, impeding rapid scalability of monitoring networks.
Opportunity:
Technological Advancements
Advancements in sensor technology, IoT integration, AI-based analytics, and cloud computing presents a significant growth opportunity for market. Smart sensors offer higher accuracy, real-time reporting, and predictive insights, enabling stakeholders to respond effectively to pollution spikes. Integration with smart city platforms, automated alerts, and predictive maintenance systems enhances operational efficiency. These innovations not only expand market potential but also create avenues for new product development, data-driven decision-making, and improved public health outcomes globally.
Threat:
Lack of Standardization & Interoperability
The absence of uniform standards and interoperability protocols poses a critical threat to the market. Diverse sensor technologies and varying reporting formats across regions make data aggregation and comparative analysis challenging. Inconsistent calibration methods and fragmented regulatory requirements may compromise reliability and hinder cross-platform integration. Such disparities can reduce stakeholder confidence, limit scalability, and slow adoption, as cities and industries seek reliable, consistent, and actionable data for informed environmental decision making and compliance monitoring.
Covid-19 Impact:
The Covid-19 pandemic significantly influenced localized air quality monitoring trends. Lockdowns and restricted industrial activity temporarily improved air quality in urban areas, highlighting the value of real-time monitoring for assessing environmental changes. Simultaneously, remote work, telehealth adoption, and heightened public health concerns increased demand for continuous monitoring systems to safeguard populations. This period underscored the importance of precise, site specific air quality data in mitigating exposure risks and informing post-pandemic urban planning and industrial operations.
The software segment is expected to be the largest during the forecast period
The software segment is expected to account for the largest market share during the forecast period, due to growing need for data analytics, visualization, and predictive insights. Cloud-based platforms allow real-time monitoring, integration with IoT networks, and advanced reporting tools, making it easier for cities, industries, and healthcare providers to respond proactively. Software solutions enhance operational efficiency, reduce manual intervention, and support data-driven decision-making, positioning this segment as the primary revenue contributor throughout the forecast period.
The healthcare segment is expected to have the highest CAGR during the forecast period
Over the forecast period, the healthcare segment is predicted to witness the highest growth rate, due to increasing concern over pollution-related health risks. Hospitals, clinics, and public health agencies are adopting localized monitoring to protect vulnerable populations, track exposure, and implement preventive measures. Real time air quality data enables timely interventions, informs policy-making, and supports clinical research. As healthcare organizations prioritize environmental health, this segment’s rapid growth underscores the critical link between pollution monitoring and improved patient outcomes.
Region with largest share:
During the forecast period, the Europe region is expected to hold the largest market share, due to stringent environmental regulations, proactive government initiatives, and high public awareness of air pollution’s impact. Extensive urbanization and industrial activity create a demand for localized monitoring networks to ensure regulatory compliance and public safety. Strong investments in smart city projects and advanced environmental technologies further consolidate Europe’s dominance, positioning the region as a key market for air quality monitoring solutions across both public and private sectors.

Region with highest CAGR:
Over the forecast period, the Asia Pacific region is anticipated to exhibit the highest CAGR, owing to rapid industrialization, urban expansion, and rising pollution levels. Growing awareness of health risks and government initiatives to implement smart city frameworks drive investments in localized monitoring systems. Adoption of IoT-enabled devices, cloud analytics, and real-time reporting is accelerating, particularly in developing economies, making Asia Pacific a hotspot for innovative air quality solutions and a leading contributor to global market growth during the forecast period.

Key players in the market
Some of the key players in Localized Air Quality Monitoring Market include Thermo Fisher Scientific, Teledyne Technologies, Horiba Ltd., Siemens AG, Honeywell International Inc., Aeroqual Limited, TSI Incorporated, Vaisala Oyj, 3M Company, Emerson Electric Co., Testo SE & Co. KGaA, Ecotech Pty Ltd, Environnement S.A, Gasera Ltd. and Valarm.
Key Developments:
In February 2026, Siemens Healthineers and Mayo Clinic have expanded their long-standing strategic collaboration to accelerate innovation in medical imaging and digital health. The partnership focuses on advancing research, improving clinical workflows, and developing next-generation technologies to enhance patient care and diagnostic precision worldwide.
In January 2026, Siemens showcased new solutions at CES 2026 aimed at accelerating the industrial AI era, highlighting expanded collaboration with NVIDIA, advanced digital twin tools, and AI-driven automation technologies designed to boost manufacturing efficiency, productivity, and intelligent factory transformation.
Components Covered:
• Hardware
• Software
• Services
Pollutant Types Covered:
• Particulate Matter (PM2.5, PM10)
• Nitrogen Oxides (NOx)
• Sulfur Dioxide (SO₂)
• Carbon Monoxide (CO)
• Ozone (O₃)
• Volatile Organic Compounds (VOCs)
Deployment Types Covered:
• Indoor Monitoring
• Outdoor Monitoring
Technologies Covered:
• Electrochemical
• Optical/Infrared
• Laser-Based Detection
• Metal Oxide Semiconductor
• Other Technologies
Applications Covered:
• Residential
• Commercial
• Industrial
• Transportation & Logistics
• Healthcare
End Users Covered:
• Government Agencies
• Enterprises
• Research Institutions
• Residential Users
Regions Covered:
• North America
o United States
o Canada
o Mexico
• Europe
o United Kingdom
o Germany
o France
o Italy
o Spain
o Netherlands
o Belgium
o Sweden
o Switzerland
o Poland
o Rest of Europe
• Asia Pacific
o China
o Japan
o India
o South Korea
o Australia
o Indonesia
o Thailand
o Malaysia
o Singapore
o Vietnam
o Rest of Asia Pacific
• South America
o Brazil
o Argentina
o Colombia
o Chile
o Peru
o Rest of South America
• Rest of the World (RoW)
o Middle East
§ Saudi Arabia
§ United Arab Emirates
§ Qatar
§ Israel
§ Rest of Middle East
o Africa
§ South Africa
§ Egypt
§ Morocco
§ Rest of Africa
What our report offers:
- Market share assessments for the regional and country-level segments
- Strategic recommendations for the new entrants
- Covers Market data for the years 2023, 2024, 2025, 2026, 2027, 2028, 2030, 2032 and 2034
- Market Trends (Drivers, Constraints, Opportunities, Threats, Challenges, Investment Opportunities, and recommendations)
- Strategic recommendations in key business segments based on the market estimations
- Competitive landscaping mapping the key common trends
- Company profiling with detailed strategies, financials, and recent developments
- Supply chain trends mapping the latest technological advancements
Free Customization Offerings:
All the customers of this report will be entitled to receive one of the following free customization options:
• Company Profiling
o Comprehensive profiling of additional market players (up to 3)
o SWOT Analysis of key players (up to 3)
• Regional Segmentation
o Market estimations, Forecasts and CAGR of any prominent country as per the client's interest (Note: Depends on feasibility check)
• Competitive Benchmarking
o Benchmarking of key players based on product portfolio, geographical presence, and strategic alliances
Table of Contents
1 Executive Summary
1.1 Market Snapshot and Key Highlights
1.2 Growth Drivers, Challenges, and Opportunities
1.3 Competitive Landscape Overview
1.4 Strategic Insights and Recommendations
2 Research Framework
2.1 Study Objectives and Scope
2.2 Stakeholder Analysis
2.3 Research Assumptions and Limitations
2.4 Research Methodology
2.4.1 Data Collection (Primary and Secondary)
2.4.2 Data Modeling and Estimation Techniques
2.4.3 Data Validation and Triangulation
2.4.4 Analytical and Forecasting Approach
3 Market Dynamics and Trend Analysis
3.1 Market Definition and Structure
3.2 Key Market Drivers
3.3 Market Restraints and Challenges
3.4 Growth Opportunities and Investment Hotspots
3.5 Industry Threats and Risk Assessment
3.6 Technology and Innovation Landscape
3.7 Emerging and High-Growth Markets
3.8 Regulatory and Policy Environment
3.9 Impact of COVID-19 and Recovery Outlook
4 Competitive and Strategic Assessment
4.1 Porter's Five Forces Analysis
4.1.1 Supplier Bargaining Power
4.1.2 Buyer Bargaining Power
4.1.3 Threat of Substitutes
4.1.4 Threat of New Entrants
4.1.5 Competitive Rivalry
4.2 Market Share Analysis of Key Players
4.3 Product Benchmarking and Performance Comparison
5 Global Localized Air Quality Monitoring Market, By Component
5.1 Hardware
5.2 Software
5.3 Services
6 Global Localized Air Quality Monitoring Market, By Pollutant Type
6.1 Particulate Matter (PM2.5, PM10)
6.2 Nitrogen Oxides (NOx)
6.3 Sulfur Dioxide (SO₂)
6.4 Carbon Monoxide (CO)
6.5 Ozone (O₃)
6.6 Volatile Organic Compounds (VOCs)
7 Global Localized Air Quality Monitoring Market, By Deployment Type
7.1 Indoor Monitoring
7.2 Outdoor Monitoring
8 Global Localized Air Quality Monitoring Market, By Technology
8.1 Electrochemical
8.2 Optical/Infrared
8.3 Laser-Based Detection
8.4 Metal Oxide Semiconductor
8.5 Other Technologies
9 Global Localized Air Quality Monitoring Market, By Application
9.1 Residential
9.2 Commercial
9.3 Industrial
9.4 Transportation & Logistics
9.5 Healthcare
10 Global Localized Air Quality Monitoring Market, By End User
10.1 Government Agencies
10.2 Enterprises
10.3 Research Institutions
10.4 Residential Users
11 Global Localized Air Quality Monitoring Market, By Geography
11.1 North America
11.1.1 United States
11.1.2 Canada
11.1.3 Mexico
11.2 Europe
11.2.1 United Kingdom
11.2.2 Germany
11.2.3 France
11.2.4 Italy
11.2.5 Spain
11.2.6 Netherlands
11.2.7 Belgium
11.2.8 Sweden
11.2.9 Switzerland
11.2.10 Poland
11.2.11 Rest of Europe
11.3 Asia Pacific
11.3.1 China
11.3.2 Japan
11.3.3 India
11.3.4 South Korea
11.3.5 Australia
11.3.6 Indonesia
11.3.7 Thailand
11.3.8 Malaysia
11.3.9 Singapore
11.3.10 Vietnam
11.3.11 Rest of Asia Pacific
11.4 South America
11.4.1 Brazil
11.4.2 Argentina
11.4.3 Colombia
11.4.4 Chile
11.4.5 Peru
11.4.6 Rest of South America
11.5 Rest of the World (RoW)
11.5.1 Middle East
11.5.1.1 Saudi Arabia
11.5.1.2 United Arab Emirates
11.5.1.3 Qatar
11.5.1.4 Israel
11.5.1.5 Rest of Middle East
11.5.2 Africa
11.5.2.1 South Africa
11.5.2.2 Egypt
11.5.2.3 Morocco
11.5.2.4 Rest of Africa
12 Strategic Market Intelligence
12.1 Industry Value Network and Supply Chain Assessment
12.2 White-Space and Opportunity Mapping
12.3 Product Evolution and Market Life Cycle Analysis
12.4 Channel, Distributor, and Go-to-Market Assessment
13 Industry Developments and Strategic Initiatives
13.1 Mergers and Acquisitions
13.2 Partnerships, Alliances, and Joint Ventures
13.3 New Product Launches and Certifications
13.4 Capacity Expansion and Investments
13.5 Other Strategic Initiatives
14 Company Profiles
14.1 Thermo Fisher Scientific
14.2 Teledyne Technologies
14.3 Horiba Ltd.
14.4 Siemens AG
14.5 Honeywell International Inc.
14.6 Aeroqual Limited
14.7 TSI Incorporated
14.8 Vaisala Oyj
14.9 3M Company
14.10 Emerson Electric Co.
14.11 Testo SE & Co. KGaA
14.12 Ecotech Pty Ltd
14.13 Environnement S.A
14.14 Gasera Ltd.
14.15 Valarm
List of Tables
1 Global Localized Air Quality Monitoring Market Outlook, By Region (2023-2034) ($MN)
2 Global Localized Air Quality Monitoring Market Outlook, By Component (2023-2034) ($MN)
3 Global Localized Air Quality Monitoring Market Outlook, By Hardware (2023-2034) ($MN)
4 Global Localized Air Quality Monitoring Market Outlook, By Software (2023-2034) ($MN)
5 Global Localized Air Quality Monitoring Market Outlook, By Services (2023-2034) ($MN)
6 Global Localized Air Quality Monitoring Market Outlook, By Pollutant Type (2023-2034) ($MN)
7 Global Localized Air Quality Monitoring Market Outlook, By Particulate Matter (PM2.5, PM10) (2023-2034) ($MN)
8 Global Localized Air Quality Monitoring Market Outlook, By Nitrogen Oxides (NOx) (2023-2034) ($MN)
9 Global Localized Air Quality Monitoring Market Outlook, By Sulfur Dioxide (SO₂) (2023-2034) ($MN)
10 Global Localized Air Quality Monitoring Market Outlook, By Carbon Monoxide (CO) (2023-2034) ($MN)
11 Global Localized Air Quality Monitoring Market Outlook, By Ozone (O₃) (2023-2034) ($MN)
12 Global Localized Air Quality Monitoring Market Outlook, By Volatile Organic Compounds (VOCs) (2023-2034) ($MN)
13 Global Localized Air Quality Monitoring Market Outlook, By Deployment Type (2023-2034) ($MN)
14 Global Localized Air Quality Monitoring Market Outlook, By Indoor Monitoring (2023-2034) ($MN)
15 Global Localized Air Quality Monitoring Market Outlook, By Outdoor Monitoring (2023-2034) ($MN)
16 Global Localized Air Quality Monitoring Market Outlook, By Technology (2023-2034) ($MN)
17 Global Localized Air Quality Monitoring Market Outlook, By Electrochemical (2023-2034) ($MN)
18 Global Localized Air Quality Monitoring Market Outlook, By Optical/Infrared (2023-2034) ($MN)
19 Global Localized Air Quality Monitoring Market Outlook, By Laser-Based Detection (2023-2034) ($MN)
20 Global Localized Air Quality Monitoring Market Outlook, By Metal Oxide Semiconductor (2023-2034) ($MN)
21 Global Localized Air Quality Monitoring Market Outlook, By Other Technologies (2023-2034) ($MN)
22 Global Localized Air Quality Monitoring Market Outlook, By Application (2023-2034) ($MN)
23 Global Localized Air Quality Monitoring Market Outlook, By Residential (2023-2034) ($MN)
24 Global Localized Air Quality Monitoring Market Outlook, By Commercial (2023-2034) ($MN)
25 Global Localized Air Quality Monitoring Market Outlook, By Industrial (2023-2034) ($MN)
26 Global Localized Air Quality Monitoring Market Outlook, By Transportation & Logistics (2023-2034) ($MN)
27 Global Localized Air Quality Monitoring Market Outlook, By Healthcare (2023-2034) ($MN)
28 Global Localized Air Quality Monitoring Market Outlook, By End User (2023-2034) ($MN)
29 Global Localized Air Quality Monitoring Market Outlook, By Government Agencies (2023-2034) ($MN)
30 Global Localized Air Quality Monitoring Market Outlook, By Enterprises (2023-2034) ($MN)
31 Global Localized Air Quality Monitoring Market Outlook, By Research Institutions (2023-2034) ($MN)
32 Global Localized Air Quality Monitoring Market Outlook, By Residential Users (2023-2034) ($MN)
Note: Tables for North America, Europe, APAC, South America, and Rest of the World (RoW) Regions are also represented in the same manner as above.
List of Figures
RESEARCH METHODOLOGY

We at ‘Stratistics’ opt for an extensive research approach which involves data mining, data validation, and data analysis. The various research sources include in-house repository, secondary research, competitor’s sources, social media research, client internal data, and primary research.
Our team of analysts prefers the most reliable and authenticated data sources in order to perform the comprehensive literature search. With access to most of the authenticated data bases our team highly considers the best mix of information through various sources to obtain extensive and accurate analysis.
Each report takes an average time of a month and a team of 4 industry analysts. The time may vary depending on the scope and data availability of the desired market report. The various parameters used in the market assessment are standardized in order to enhance the data accuracy.
Data Mining
The data is collected from several authenticated, reliable, paid and unpaid sources and is filtered depending on the scope & objective of the research. Our reports repository acts as an added advantage in this procedure. Data gathering from the raw material suppliers, distributors and the manufacturers is performed on a regular basis, this helps in the comprehensive understanding of the products value chain. Apart from the above mentioned sources the data is also collected from the industry consultants to ensure the objective of the study is in the right direction.
Market trends such as technological advancements, regulatory affairs, market dynamics (Drivers, Restraints, Opportunities and Challenges) are obtained from scientific journals, market related national & international associations and organizations.
Data Analysis
From the data that is collected depending on the scope & objective of the research the data is subjected for the analysis. The critical steps that we follow for the data analysis include:
- Product Lifecycle Analysis
- Competitor analysis
- Risk analysis
- Porters Analysis
- PESTEL Analysis
- SWOT Analysis
The data engineering is performed by the core industry experts considering both the Marketing Mix Modeling and the Demand Forecasting. The marketing mix modeling makes use of multiple-regression techniques to predict the optimal mix of marketing variables. Regression factor is based on a number of variables and how they relate to an outcome such as sales or profits.
Data Validation
The data validation is performed by the exhaustive primary research from the expert interviews. This includes telephonic interviews, focus groups, face to face interviews, and questionnaires to validate our research from all aspects. The industry experts we approach come from the leading firms, involved in the supply chain ranging from the suppliers, distributors to the manufacturers and consumers so as to ensure an unbiased analysis.
We are in touch with more than 15,000 industry experts with the right mix of consultants, CEO's, presidents, vice presidents, managers, experts from both supply side and demand side, executives and so on.
The data validation involves the primary research from the industry experts belonging to:
- Leading Companies
- Suppliers & Distributors
- Manufacturers
- Consumers
- Industry/Strategic Consultants
Apart from the data validation the primary research also helps in performing the fill gap research, i.e. providing solutions for the unmet needs of the research which helps in enhancing the reports quality.
For more details about research methodology, kindly write to us at info@strategymrc.com
Frequently Asked Questions
In case of any queries regarding this report, you can contact the customer service by filing the “Inquiry Before Buy” form available on the right hand side. You may also contact us through email: info@strategymrc.com or phone: +1-301-202-5929
Yes, the samples are available for all the published reports. You can request them by filling the “Request Sample” option available in this page.
Yes, you can request a sample with your specific requirements. All the customized samples will be provided as per the requirement with the real data masked.
All our reports are available in Digital PDF format. In case if you require them in any other formats, such as PPT, Excel etc you can submit a request through “Inquiry Before Buy” form available on the right hand side. You may also contact us through email: info@strategymrc.com or phone: +1-301-202-5929
We offer a free 15% customization with every purchase. This requirement can be fulfilled for both pre and post sale. You may send your customization requirements through email at info@strategymrc.com or call us on +1-301-202-5929.
We have 3 different licensing options available in electronic format.
- Single User Licence: Allows one person, typically the buyer, to have access to the ordered product. The ordered product cannot be distributed to anyone else.
- 2-5 User Licence: Allows the ordered product to be shared among a maximum of 5 people within your organisation.
- Corporate License: Allows the product to be shared among all employees of your organisation regardless of their geographical location.
All our reports are typically be emailed to you as an attachment.
To order any available report you need to register on our website. The payment can be made either through CCAvenue or PayPal payments gateways which accept all international cards.
We extend our support to 6 months post sale. A post sale customization is also provided to cover your unmet needs in the report.
Request Customization
We offer complimentary customization of up to 15% with every purchase. To share your customization requirements, feel free to email us at info@strategymrc.com or call us on +1-301-202-5929. .
Please Note: Customization within the 15% threshold is entirely free of charge. If your request exceeds this limit, we will conduct a feasibility assessment. Following that, a detailed quote and timeline will be provided.
WHY CHOOSE US ?

Assured Quality
Best in class reports with high standard of research integrity

24X7 Research Support
Continuous support to ensure the best customer experience.

Free Customization
Adding more values to your product of interest.

Safe & Secure Access
Providing a secured environment for all online transactions.

Trusted by 600+ Brands
Serving the most reputed brands across the world.