
Low Speed Vehicle Market
Low Speed Vehicle Market Forecasts to 2028 - Global Analysis By Vehicle Type (Commercial Turf Utility Vehicle, Golf Cart and Other Vehicle Types), By Propulsion Type (Diesel, Electric, Gasoline, ICE and Other Propulsion Types), By Battery Type, By Voltage Type, By Category Type, By Power Output, By Application, By End User and By Geography

|
Years Covered |
2020-2028 |
|
Estimated Year Value (2022) |
US $8.09 BN |
|
Projected Year Value (2028) |
US $13.87 BN |
|
CAGR (2022 - 2028) |
9.4% |
|
Regions Covered |
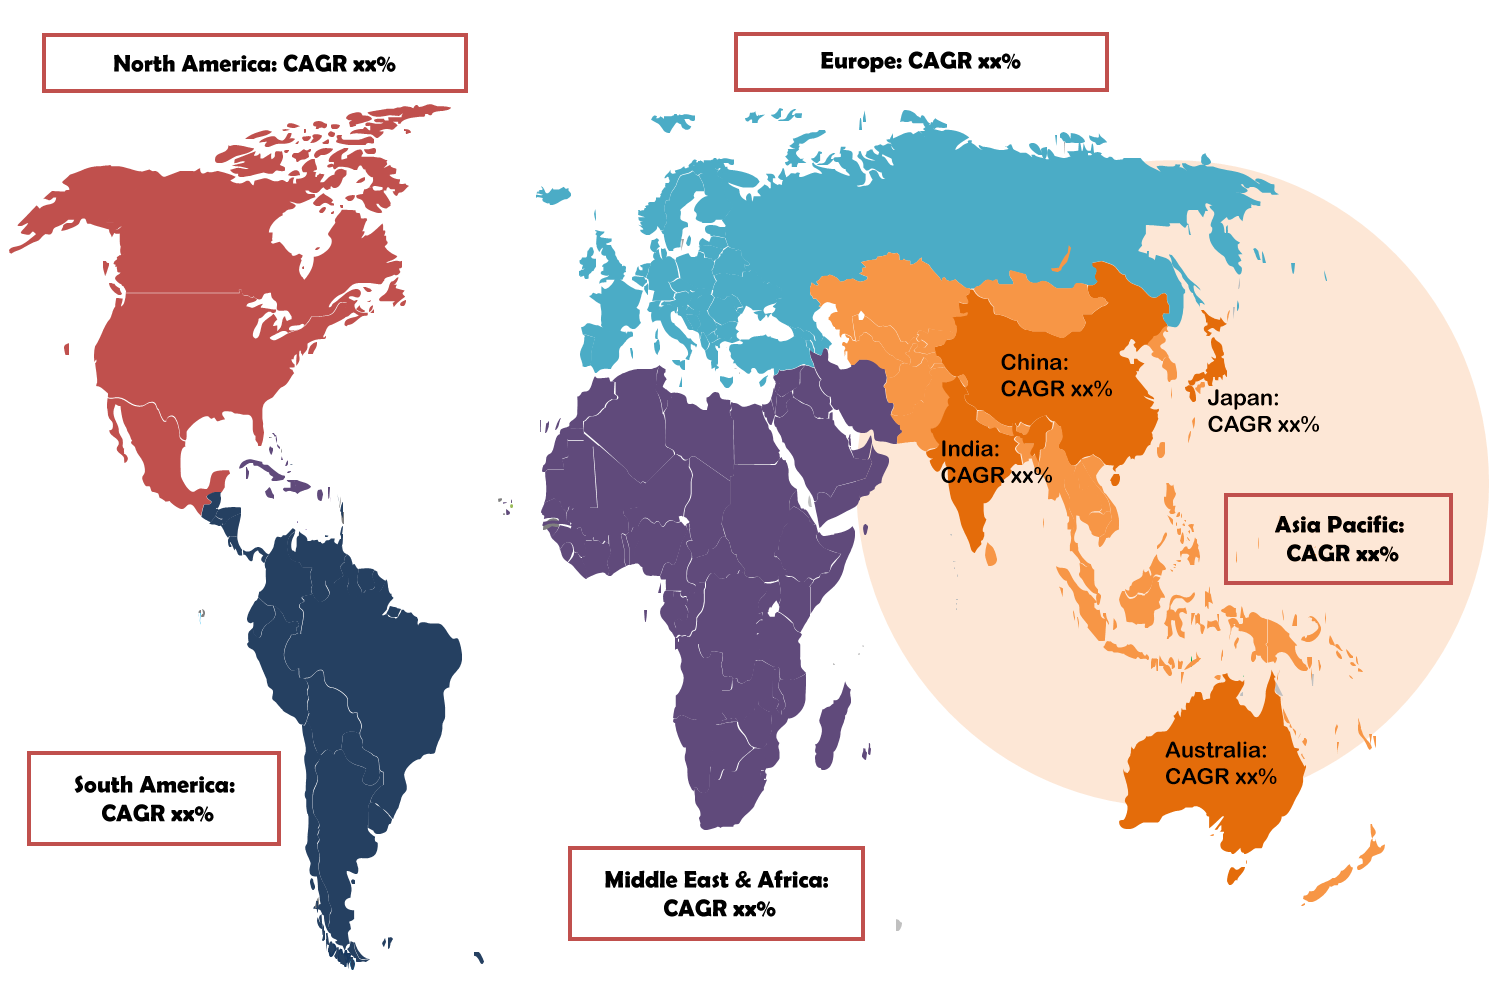
North America, Europe, Asia Pacific, South America, and Middle East & Africa |
|
Countries Covered |
US, Canada, Mexico, Germany, UK, Italy, France, Spain, Japan, China, India, Australia, New Zealand, South Korea, Rest of Asia Pacific, South America, Argentina, Brazil, Chile, Middle East & Africa, Saudi Arabia, UAE, Qatar, and South Africa |
|
Largest Market |
North America |
|
Highest Growing Market |
Asia Pacific |
According to Stratistics MRC, the Global Low Speed Vehicle Market is accounted for $8.09 billion in 2022 and is expected to reach $13.87 billion by 2028 growing at a CAGR of 9.4% during the forecast period. Low-speed vehicles are four-wheeled vehicles with a maximum speed of 40 km/h and a minimum speed of 32 km/h, which is adequate for driving on the road. Meter maids, hunting, yard work, industrial utilities, grounds maintenance, and campus security all require low-speed vehicles. The vehicles are small and light, and they can hold up to 6 people. They also get great mileage, which contributes to the market for vehicles experiencing growth. These products are quickly gaining popularity among drivers who want to produce a small carbon footprint.
According to the study by the Toronto and Region Conservation Authority, electric low speed vehicle consumes less energy to drive the cart compared to gas-powered carts.
Market Dynamics:
Driver:
Growing popularity for golf
There are 25.6 million players in the US who played the game on actual golf courses and 15.5 million others who engaged in off-course golf activities at Topgolf and Drive Shack as well as indoor golf simulators. In addition, 3 million new golfers joined in the past three years, as opposed to 2 million in the previous nine. Young adults (18–34 years old) made up the largest segment of golf's customer base, according to NGF, with 6.2 million participants. An increase in incentives and prizes is a significant growth element for golf course games. In the Asia Pacific, reimbursements for professional golf tournaments range from 30,000 to 0.2 million.
Restraint:
High cost associated with electric low speed vehicles
The majority of nations charge more to purchase electric cars than diesel or gasoline models. Because of this, it is difficult for the poorest households to quickly switch from older diesel and gasoline cars to electric vehicles. The vehicle's limited travel distance (up to 40 miles on a single charge), which limits the kinds of routes it is permitted to travel on, is another important limitation. Vehicle safety regulations are also lower than those for passenger cars. It is projected that the lack of charging stations, particularly in growing and underdeveloped areas, along with the low speed of the vehicle, which limits their use to specific streets, will impede growth throughout the forecast period.
Opportunity:
New product strategies by the key manufacturers
North American manufacturers frequently employ supply agreements, the creation of new products, and business expansions. Some of the leading manufacturers of low-speed vehicles, including Textron and Polaris, have implemented similar tactics to grow their companies. Additionally, organizations will acquire a technical advantage through attempts to improve these goods' performances, and expansion aids in the development of a more effective business plan. Additionally, major automakers are constantly concentrating on developing cheap and easy-to-drive vehicles. During the forecast period, these factors are anticipated to further accelerate market growth.
Threat:
Lack of safety standards and equipment
For conventional automobiles in the US, safety regulations are monitored by the National Highway Traffic Safety Administration (NHTSA). Under Section 571.500 Standard No. 500, NHTSA has established requirements for LSVs. The LSV must comply with this standard by having the following features installed: rearview mirrors, windshields, seat belts, parking brakes, headlamps, stop lamps, turn signal lamps, reflex reflectors, and vehicle identification numbers. An LSV cannot be certified for street legality operations if it does not meet this requirement. Many OEMs offer specialized LSVs that can't fully adhere to the regulations and aren't approved for use on public streets.
Covid-19 Impact:
The COVID-19 pandemic is having an impact not only on health and medical issues but also on economic conditions. Every industry was severely impacted by the lockdown procedures, and the majority of enterprises suffered losses. As businesses are on the verge of entering a recession, layoffs, terminations of employment, and other issues are growing in the global market, and the pandemic situation has left customers with significantly lower financial incomes. The automobile industry took a significant hit in the first two quarters of 2020 due to the closure of all showrooms, the supply chain, the manufacturing facilities, and various ancillary offices, warehouses, and transportation facilities.
The commercial turf utility vehicle segment is expected to be the largest during the forecast period
Commercial Turf Utility Vehicle segment is commanded to have largest market share during the projection period, because these vehicles have little usage in industrial sectors and are largely utilized for transportation in hotels and resorts, they can be employed in commercial transportation. These automobiles are tough, adaptable, and available in 4X4 mode. They also comply with some nations' street regulations. These characteristics enable these vehicles to carry huge products inside industrial buildings or warehouses in addition to moving people over highways.
The airports segment is expected to have the highest CAGR during the forecast period
Airports segment is anticipated to witness profitable growth throughout the forecasted period due to a growth in global passenger travel. ACI Europe stated that in 2022, airport passenger traffic in Europe will increase by 98%. Numerous new airports will be operated simultaneously with the completion of about 225 new airport projects, 70% of which will be located in Asia-Pacific and will cost an estimated $150 billion USD. As a result, when there are more passengers traveling through the airport, there will be a greater demand for LSVs to transport passengers from one location to another.
Region with largest share:
Due to the abundance of golf courses, North America is predicted to hold the largest portion of the global market over the estimated period. OEMs intend to expand their output in tandem with the quickening pace of technical development in manufacturing plants in developing nations like the U.S., Canada, and Mexico. Additionally, the region's market expansion is anticipated to be aided by the existence of well-known automotive low-speed vehicle manufacturing enterprises.
Region with highest CAGR:
Asia Pacific region is projected to hold the lucrative growth throughout the extrapolated period. China and Japan currently hold the primary market positions, mostly as a result of increased demand brought on by the expansion of golf courses, industrial facilities, and tourism. Demand has recently surged in other nations like Thailand, South Korea, and India. However, another expanding factor in Asia is the affection of golf, where 5,000 courses are predicted to be built by 2021 and numerous new clubs are anticipated. In recent years, there has also been a substantial increase in warehouses, IT hubs, and product production.
Key players in the market
Some of the key players in Low Speed Vehicle market include American Landmaster, Bradshaw Electric Vehicles, Club Car, Deere & Company, Ingersoll-Rand plc, Kubota corp, Motor Electric Vehicles, Polaris Industries Inc, Suzhou Eagle Electric Vehicle Manufacturing Co., Ltd, Taylor-Dunn, Textron Inc, The Toro Company, Tomberlin Automotive Group, Yamaha Golf-Car Company.
Key Developments:
In Jan 2023, E-Z- GO redesigned its RXV golf cars with several new features such as easy-to-load tee and golf ball holders, and plenty of space for mobile devices, cups, range finders and personal items. OEMs are now optimizing LSVs with better facilities and features to provide an overall better user experience.
In June 2022, Club Car acquired Garia a Denmark based street legal electric low speed vehicle manufacturer. This acquisition will enable Club car to increase its electric LSVs manufacturing and establish itself as a Major OEM of the LSV market.
In January 2022, Yamaha launched the Drive2 Powertrain AC Lithium. The new Lithium-ion-powered golf car is with Independent Rear Suspension (IRS). Yamaha is known for offering the strongest product line of golf and utility cars in the world, and the addition of the Drive2 PowerTech with the IRS model offers customers the same comfort, reliability, and performance.
In January 2022, The Toro Company launched Workman UTX. The commercial-grade, 4-wheel drive vehicle uses a proprietary ground speed governing system. Workman UTX's ground speed and RPM are not directly connected, allowing the manager to limit the speed of the machine without gutting the power.
In December 2021, The R&A has named The Toro Company as a Founding Partner and Official Golf Course Maintenance Partner for its planned community golf facility in Glasgow, Scotland. This partnership would pave the path for the sales of gold cars in the region.
Vehicle Types Covered:
• Commercial Turf Utility Vehicle
• Golf Cart
• Personal Mobility Vehicle
• Public Transport
• Personal Carrier
• Off-Road Vehicle
• Utility Vehicle
• Heavy Duty Vehicle
• Passenger Vehicle
• Other Vehicle Types
Propulsion Types Covered:
• Diesel
• Electric
• Gasoline
• ICE
• Other Propulsion Types
Battery Types Covered:
• Lead Acid
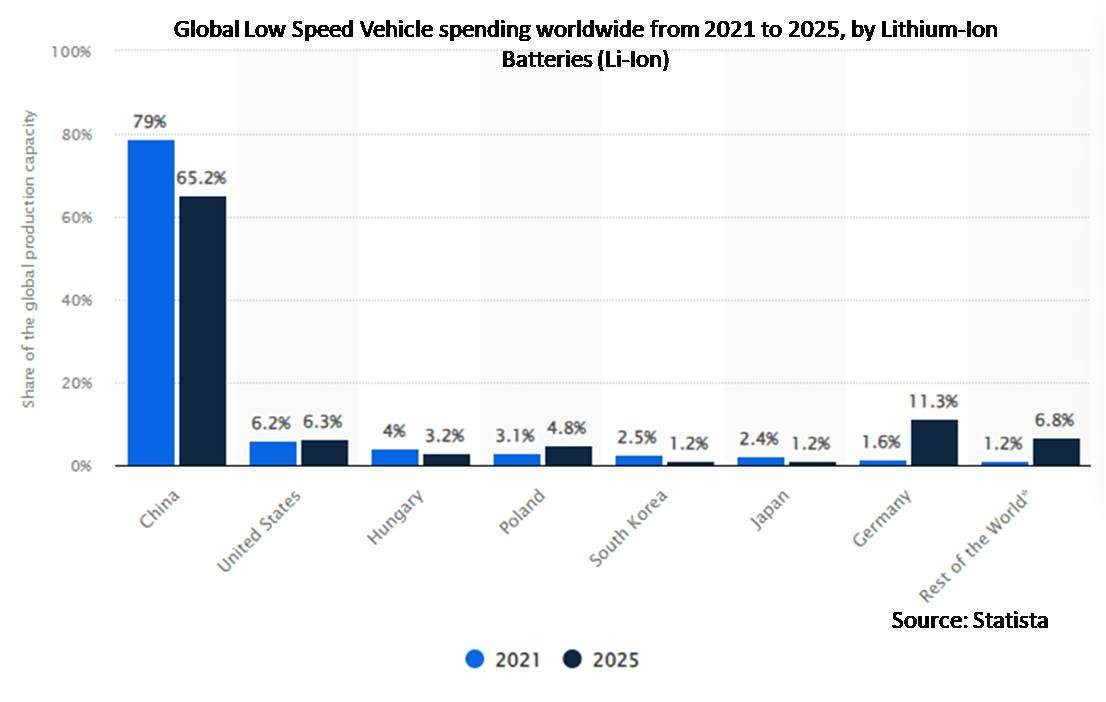
• Lithium-Ion Batteries (Li-Ion)
• Other Battery Types
Voltage Types Covered:
• <60V
• >60V
Category Types Covered:
• L6
• L7
Power Outputs Covered:
• <8 KW
• 8–15 KW
• >15 KW
Applications Covered:
• Airports
• Golf Courses
• Hotels & Resorts
• Industrial Facilities
• Other Applications
End Users Covered:
• Residential & Commercial Premises
• Tourist Destinations
• Other End Users
Regions Covered:
• North America
o US
o Canada
o Mexico
• Europe
o Germany
o UK
o Italy
o France
o Spain
o Rest of Europe
• Asia Pacific
o Japan
o China
o India
o Australia
o New Zealand
o South Korea
o Rest of Asia Pacific
• South America
o Argentina
o Brazil
o Chile
o Rest of South America
• Middle East & Africa
o Saudi Arabia
o UAE
o Qatar
o South Africa
o Rest of Middle East & Africa
What our report offers:
- Market share assessments for the regional and country-level segments
- Strategic recommendations for the new entrants
- Covers Market data for the years 2020, 2021, 2022, 2025, and 2028
- Market Trends (Drivers, Constraints, Opportunities, Threats, Challenges, Investment Opportunities, and recommendations)
- Strategic recommendations in key business segments based on the market estimations
- Competitive landscaping mapping the key common trends
- Company profiling with detailed strategies, financials, and recent developments
- Supply chain trends mapping the latest technological advancements
Free Customization Offerings:
All the customers of this report will be entitled to receive one of the following free customization options:
• Company Profiling
o Comprehensive profiling of additional market players (up to 3)
o SWOT Analysis of key players (up to 3)
• Regional Segmentation
o Market estimations, Forecasts and CAGR of any prominent country as per the client's interest (Note: Depends on feasibility check)
• Competitive Benchmarking
Benchmarking of key players based on product portfolio, geographical presence, and strategic alliances
Table of Contents
1 Executive Summary
2 Preface
2.1 Abstract
2.2 Stake Holders
2.3 Research Scope
2.4 Research Methodology
2.4.1 Data Mining
2.4.2 Data Analysis
2.4.3 Data Validation
2.4.4 Research Approach
2.5 Research Sources
2.5.1 Primary Research Sources
2.5.2 Secondary Research Sources
2.5.3 Assumptions
3 Market Trend Analysis
3.1 Introduction
3.2 Drivers
3.3 Restraints
3.4 Opportunities
3.5 Threats
3.6 Application Analysis
3.7 End User Analysis
3.8 Emerging Markets
3.9 Impact of Covid-19
4 Porters Five Force Analysis
4.1 Bargaining power of suppliers
4.2 Bargaining power of buyers
4.3 Threat of substitutes
4.4 Threat of new entrants
4.5 Competitive rivalry
5 Global Low Speed Vehicle Market, By Vehicle Type
5.1 Introduction
5.2 Commercial Turf Utility Vehicle
5.3 Golf Cart
5.4 Personal Mobility Vehicle
5.5 Public Transport
5.6 Personal Carrier
5.7 Off-Road Vehicle
5.8 Utility Vehicle
5.8.1 Industrial Utility Vehicle
5.9 Heavy Duty Vehicle
5.10 Passenger Vehicle
5.11 Other Vehicle Types
6 Global Low Speed Vehicle Market, By Propulsion Type
6.1 Introduction
6.2 Diesel
6.3 Electric
6.4 Gasoline
6.5 ICE
6.6 Other Propulsion Types
7 Global Low Speed Vehicle Market, By Battery Type
7.1 Introduction
7.2 Lead Acid
7.3 Lithium-Ion Batteries (Li-Ion)
7.4 Other Battery Types
8 Global Low Speed Vehicle Market, By Voltage Type
8.1 Introduction
8.2 <60V
8.3 >60V
9 Global Low Speed Vehicle Market, By Category Type
9.1 Introduction
9.2 L6
9.3 L7
10 Global Low Speed Vehicle Market, By Power Output
10.1 Introduction
10.2 <8 KW
10.3 8–15 KW
10.4 >15 KW
11 Global Low Speed Vehicle Market, By Application
11.1 Introduction
11.2 Airports
11.3 Golf Courses
11.4 Hotels & Resorts
11.5 Industrial Facilities
11.6 Other Applications
12 Global Low Speed Vehicle Market, By End User
12.1 Introduction
12.2 Residential & Commercial Premises
12.3 Tourist Destinations
12.4 Other End Users
13 Global Low Speed Vehicle Market, By Geography
13.1 Introduction
13.2 North America
13.2.1 US
13.2.2 Canada
13.2.3 Mexico
13.3 Europe
13.3.1 Germany
13.3.2 UK
13.3.3 Italy
13.3.4 France
13.3.5 Spain
13.3.6 Rest of Europe
13.4 Asia Pacific
13.4.1 Japan
13.4.2 China
13.4.3 India
13.4.4 Australia
13.4.5 New Zealand
13.4.6 South Korea
13.4.7 Rest of Asia Pacific
13.5 South America
13.5.1 Argentina
13.5.2 Brazil
13.5.3 Chile
13.5.4 Rest of South America
13.6 Middle East & Africa
13.6.1 Saudi Arabia
13.6.2 UAE
13.6.3 Qatar
13.6.4 South Africa
13.6.5 Rest of Middle East & Africa
14 Key Developments
14.1 Agreements, Partnerships, Collaborations and Joint Ventures
14.2 Acquisitions & Mergers
14.3 New Product Launch
14.4 Expansions
14.5 Other Key Strategies
15 Company Profiling
15.1 American Landmaster
15.2 Bradshaw Electric Vehicles
15.3 Club Car
15.4 Deere & Company
15.5 Ingersoll-Rand plc
15.6 Kubota corp
15.7 Motor Electric Vehicles
15.8 Polaris Industries Inc
15.9 Suzhou Eagle Electric Vehicle Manufacturing Co., Ltd
15.10 Taylor-Dunn
15.11 Textron Inc
15.12 The Toro Company
15.13 Tomberlin Automotive Group
15.14 Yamaha Golf-Car Company
15.15 Yamaha Motor Co., Ltd
List of Tables
1 Global Low Speed Vehicle Market Outlook, By Region (2020-2028) ($MN)
2 Global Low Speed Vehicle Market Outlook, By Vehicle Type (2020-2028) ($MN)
3 Global Low Speed Vehicle Market Outlook, By Commercial Turf Utility Vehicle (2020-2028) ($MN)
4 Global Low Speed Vehicle Market Outlook, By Golf Cart (2020-2028) ($MN)
5 Global Low Speed Vehicle Market Outlook, By Personal Mobility Vehicle (2020-2028) ($MN)
6 Global Low Speed Vehicle Market Outlook, By Public Transport (2020-2028) ($MN)
7 Global Low Speed Vehicle Market Outlook, By Personal Carrier (2020-2028) ($MN)
8 Global Low Speed Vehicle Market Outlook, By Off-Road Vehicle (2020-2028) ($MN)
9 Global Low Speed Vehicle Market Outlook, By Utility Vehicle (2020-2028) ($MN)
10 Global Low Speed Vehicle Market Outlook, By Industrial Utility Vehicle (2020-2028) ($MN)
11 Global Low Speed Vehicle Market Outlook, By Heavy Duty Vehicle (2020-2028) ($MN)
12 Global Low Speed Vehicle Market Outlook, By Passenger Vehicle (2020-2028) ($MN)
13 Global Low Speed Vehicle Market Outlook, By Other Vehicle Types (2020-2028) ($MN)
14 Global Low Speed Vehicle Market Outlook, By Propulsion Type (2020-2028) ($MN)
15 Global Low Speed Vehicle Market Outlook, By Diesel (2020-2028) ($MN)
16 Global Low Speed Vehicle Market Outlook, By Electric (2020-2028) ($MN)
17 Global Low Speed Vehicle Market Outlook, By Gasoline (2020-2028) ($MN)
18 Global Low Speed Vehicle Market Outlook, By ICE (2020-2028) ($MN)
19 Global Low Speed Vehicle Market Outlook, By Other Propulsion Types (2020-2028) ($MN)
20 Global Low Speed Vehicle Market Outlook, By Battery Type (2020-2028) ($MN)
21 Global Low Speed Vehicle Market Outlook, By Lead Acid (2020-2028) ($MN)
22 Global Low Speed Vehicle Market Outlook, By Lithium-Ion Batteries (Li-Ion) (2020-2028) ($MN)
23 Global Low Speed Vehicle Market Outlook, By Other Battery Types (2020-2028) ($MN)
24 Global Low Speed Vehicle Market Outlook, By Voltage Type (2020-2028) ($MN)
25 Global Low Speed Vehicle Market Outlook, By <60V (2020-2028) ($MN)
26 Global Low Speed Vehicle Market Outlook, By >60V (2020-2028) ($MN)
27 Global Low Speed Vehicle Market Outlook, By Category Type (2020-2028) ($MN)
28 Global Low Speed Vehicle Market Outlook, By L6 (2020-2028) ($MN)
29 Global Low Speed Vehicle Market Outlook, By L7 (2020-2028) ($MN)
30 Global Low Speed Vehicle Market Outlook, By Power Output (2020-2028) ($MN)
31 Global Low Speed Vehicle Market Outlook, By <8 KW (2020-2028) ($MN)
32 Global Low Speed Vehicle Market Outlook, By 8–15 KW (2020-2028) ($MN)
33 Global Low Speed Vehicle Market Outlook, By >15 KW (2020-2028) ($MN)
34 Global Low Speed Vehicle Market Outlook, By Application (2020-2028) ($MN)
35 Global Low Speed Vehicle Market Outlook, By Airports (2020-2028) ($MN)
36 Global Low Speed Vehicle Market Outlook, By Golf Courses (2020-2028) ($MN)
37 Global Low Speed Vehicle Market Outlook, By Hotels & Resorts (2020-2028) ($MN)
38 Global Low Speed Vehicle Market Outlook, By Industrial Facilities (2020-2028) ($MN)
39 Global Low Speed Vehicle Market Outlook, By Other Applications (2020-2028) ($MN)
40 Global Low Speed Vehicle Market Outlook, By End User (2020-2028) ($MN)
41 Global Low Speed Vehicle Market Outlook, By Residential & Commercial Premises (2020-2028) ($MN)
42 Global Low Speed Vehicle Market Outlook, By Tourist Destinations (2020-2028) ($MN)
43 Global Low Speed Vehicle Market Outlook, By Other End Users (2020-2028) ($MN)
Note: Tables for North America, Europe, Asia Pacific, South America and Middle East & Africa Regions are also represented in the same manner as above.
List of Figures
RESEARCH METHODOLOGY

We at ‘Stratistics’ opt for an extensive research approach which involves data mining, data validation, and data analysis. The various research sources include in-house repository, secondary research, competitor’s sources, social media research, client internal data, and primary research.
Our team of analysts prefers the most reliable and authenticated data sources in order to perform the comprehensive literature search. With access to most of the authenticated data bases our team highly considers the best mix of information through various sources to obtain extensive and accurate analysis.
Each report takes an average time of a month and a team of 4 industry analysts. The time may vary depending on the scope and data availability of the desired market report. The various parameters used in the market assessment are standardized in order to enhance the data accuracy.
Data Mining
The data is collected from several authenticated, reliable, paid and unpaid sources and is filtered depending on the scope & objective of the research. Our reports repository acts as an added advantage in this procedure. Data gathering from the raw material suppliers, distributors and the manufacturers is performed on a regular basis, this helps in the comprehensive understanding of the products value chain. Apart from the above mentioned sources the data is also collected from the industry consultants to ensure the objective of the study is in the right direction.
Market trends such as technological advancements, regulatory affairs, market dynamics (Drivers, Restraints, Opportunities and Challenges) are obtained from scientific journals, market related national & international associations and organizations.
Data Analysis
From the data that is collected depending on the scope & objective of the research the data is subjected for the analysis. The critical steps that we follow for the data analysis include:
- Product Lifecycle Analysis
- Competitor analysis
- Risk analysis
- Porters Analysis
- PESTEL Analysis
- SWOT Analysis
The data engineering is performed by the core industry experts considering both the Marketing Mix Modeling and the Demand Forecasting. The marketing mix modeling makes use of multiple-regression techniques to predict the optimal mix of marketing variables. Regression factor is based on a number of variables and how they relate to an outcome such as sales or profits.
Data Validation
The data validation is performed by the exhaustive primary research from the expert interviews. This includes telephonic interviews, focus groups, face to face interviews, and questionnaires to validate our research from all aspects. The industry experts we approach come from the leading firms, involved in the supply chain ranging from the suppliers, distributors to the manufacturers and consumers so as to ensure an unbiased analysis.
We are in touch with more than 15,000 industry experts with the right mix of consultants, CEO's, presidents, vice presidents, managers, experts from both supply side and demand side, executives and so on.
The data validation involves the primary research from the industry experts belonging to:
- Leading Companies
- Suppliers & Distributors
- Manufacturers
- Consumers
- Industry/Strategic Consultants
Apart from the data validation the primary research also helps in performing the fill gap research, i.e. providing solutions for the unmet needs of the research which helps in enhancing the reports quality.
For more details about research methodology, kindly write to us at info@strategymrc.com
Frequently Asked Questions
In case of any queries regarding this report, you can contact the customer service by filing the “Inquiry Before Buy” form available on the right hand side. You may also contact us through email: info@strategymrc.com or phone: +1-301-202-5929
Yes, the samples are available for all the published reports. You can request them by filling the “Request Sample” option available in this page.
Yes, you can request a sample with your specific requirements. All the customized samples will be provided as per the requirement with the real data masked.
All our reports are available in Digital PDF format. In case if you require them in any other formats, such as PPT, Excel etc you can submit a request through “Inquiry Before Buy” form available on the right hand side. You may also contact us through email: info@strategymrc.com or phone: +1-301-202-5929
We offer a free 15% customization with every purchase. This requirement can be fulfilled for both pre and post sale. You may send your customization requirements through email at info@strategymrc.com or call us on +1-301-202-5929.
We have 3 different licensing options available in electronic format.
- Single User Licence: Allows one person, typically the buyer, to have access to the ordered product. The ordered product cannot be distributed to anyone else.
- 2-5 User Licence: Allows the ordered product to be shared among a maximum of 5 people within your organisation.
- Corporate License: Allows the product to be shared among all employees of your organisation regardless of their geographical location.
All our reports are typically be emailed to you as an attachment.
To order any available report you need to register on our website. The payment can be made either through CCAvenue or PayPal payments gateways which accept all international cards.
We extend our support to 6 months post sale. A post sale customization is also provided to cover your unmet needs in the report.
Request Customization
We offer complimentary customization of up to 15% with every purchase. To share your customization requirements, feel free to email us at info@strategymrc.com or call us on +1-301-202-5929. .
Please Note: Customization within the 15% threshold is entirely free of charge. If your request exceeds this limit, we will conduct a feasibility assessment. Following that, a detailed quote and timeline will be provided.
WHY CHOOSE US ?

Assured Quality
Best in class reports with high standard of research integrity

24X7 Research Support
Continuous support to ensure the best customer experience.

Free Customization
Adding more values to your product of interest.

Safe & Secure Access
Providing a secured environment for all online transactions.

Trusted by 600+ Brands
Serving the most reputed brands across the world.