
Mutual Fund Assets Market
Mutual Fund Assets Market Forecasts to 2032 - Global Analysis By Fund Type (Equity Funds, Debt Funds, Hybrid Funds, Money Market Funds and Fund of Funds (FoFs)), Investor Type, Asset Class, Distribution Channel and By Geography

|
Years Covered |
2024-2032 |
|
Estimated Year Value (2025) |
US $689.5 BN |
|
Projected Year Value (2032) |
US $976.8 BN |
|
CAGR (2025-2032) |
13.2% |
|
Regions Covered |
North America, Europe, Asia Pacific, South America, and Middle East & Africa |
|
Countries Covered |
US, Canada, Mexico, Germany, UK, Italy, France, Spain, Japan, China, India, Australia, New Zealand, South Korea, Rest of Asia Pacific, South America, Argentina, Brazil, Chile, Middle East & Africa, Saudi Arabia, UAE, Qatar, and South Africa |
|
Largest Market |
Asia Pacific |
|
Highest Growing Market |
North America |
According to Stratistics MRC, the Global Mutual Fund Assets Market is accounted for $689.5 billion in 2025 and is expected to reach $976.8 billion by 2032 growing at a CAGR of 13.2% during the forecast period. Mutual fund assets refer to the total market value of all the financial securities and cash held within a mutual fund. These assets are pooled from multiple investors who contribute money to the fund with the goal of achieving diversified investment exposure. The fund is managed by professional fund managers who allocate the assets across various instruments such as stocks, bonds, and money market securities based on the fund’s investment objective. The value of mutual fund assets fluctuates based on market performance and investor activity, including new investments or redemptions. It serves as a key indicator of a fund’s size and popularity.
Market Dynamics:
Driver:
Rising Financial Awareness
Rising financial awareness is absolutely driving the Mutual Fund Assets market by encouraging more individuals to invest in diverse financial instruments for long-term wealth creation. Increased literacy about systematic investment plans (SIPs), risk-adjusted returns, and tax benefits has expanded retail participation. Educational campaigns by regulatory bodies and asset management companies are also boosting investor confidence. As more people understand the advantages of mutual funds over traditional savings, the industry is witnessing higher inflows, thereby propelling the overall growth of mutual fund assets.
Restraint:
Market Volatility
Market volatility negatively impacts the Mutual Fund Assets Market by creating uncertainty and reducing investor confidence. Frequent fluctuations in asset values can lead to panic selling and withdrawal of funds, especially from equity-oriented schemes. This hampers the overall growth of assets under management (AUM). Additionally, volatile markets make portfolio management challenging, forcing fund managers to adopt conservative strategies, which may limit potential returns and reduce the attractiveness of mutual fund investments.
Opportunity:
Digital Investment Platforms
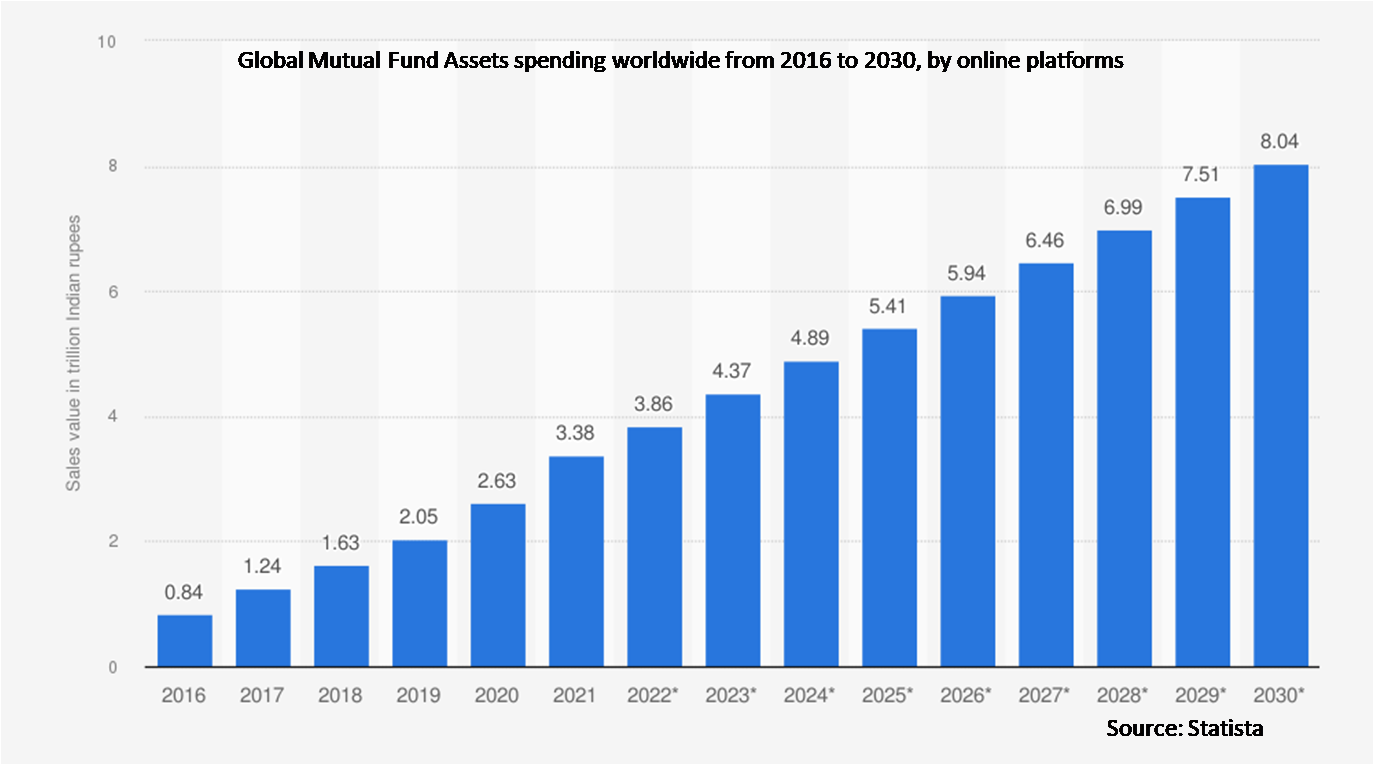
Digital investing platforms are greatly enhancing the Mutual Fund Assets Market by providing seamless, user-friendly, and easily accessible investment options. Through automation, real-time tracking, and minimal entry hurdles, these platforms streamline the investment process and draw in a wider range of users, including first-time investors and tech-savvy millennials. They increase investor convenience and confidence with features like goal-based investing, paperless KYC, and robo-advisory. Digital platforms are therefore encouraging greater involvement and asset inflows, which is fueling the mutual fund industry's overall expansion.
Threat:
Regulatory Challenges
Regulatory issues cause uncertainty and operational constraints for asset managers, which have a detrimental effect on the mutual fund assets market. Market expansion and product innovation might be slowed by complicated compliance requirements, frequent policy changes, and approval delays. In addition to raising administrative expenses, these difficulties restrict the entry of new competitors, which lessens competition. All things considered, regulatory obstacles may deter investors and impede the growth of mutual fund assets around the world.
Covid-19 Impact
The Covid-19 pandemic initially disrupted the Mutual Fund Assets Market due to heightened market volatility, liquidity challenges, and investor panic. However, it later spurred increased retail participation, digital adoption, and awareness of systematic investment plans (SIPs). Central bank interventions and fiscal stimulus restored investor confidence, leading to asset growth. The shift toward long-term financial planning and online investment platforms ultimately contributed to the market's recovery and sustained momentum post-pandemic.
The hybrid funds segment is expected to be the largest during the forecast period
The hybrid funds segment is expected to account for the largest market share during the forecast period because both conservative and growth-oriented investors find this diversified approach appealing, which boosts investor confidence and increases market participation. Retail investors looking for stability with modest risk are drawn to hybrid funds because of their positive returns and improved financial awareness. The general growth and diversification of mutual fund assets across a range of investor demographics is being greatly aided by their rising popularity.
The commodities segment is expected to have the highest CAGR during the forecast period
Over the forecast period, the commodities segment is predicted to witness the highest growth rate as rising commodity prices, driven by global demand and supply dynamics, have made commodity-focused mutual funds more attractive, prompting increased inflows. This segment enhances portfolio stability during market volatility, drawing retail and institutional interest alike. Additionally, regulatory support and growing investor awareness about alternative asset classes are boosting participation in commodity funds, thereby driving growth in overall mutual fund assets.
Region with largest share:
During the forecast period, the Asia Pacific region is expected to hold the largest market share due to increasing financial literacy, rising middle-class wealth, and expanding digital investment platforms. Governments across the region are promoting financial inclusion and investment awareness, encouraging retail participation. Additionally, favorable regulatory reforms and the growing presence of domestic and global asset management firms are fueling market expansion. The shift from traditional savings to market-based investments is also enhancing the appeal of mutual funds, boosting asset inflows and overall market development.
Region with highest CAGR:
Over the forecast period, the North America region is anticipated to exhibit the highest CAGR, owing to favorable regulatory frameworks, and strong economic fundamentals. Rising awareness about diversified investment portfolios and long-term wealth creation is encouraging both retail and institutional investors to channel funds into mutual assets. The proliferation of digital investment platforms and systematic investment plans (SIPs) further supports accessibility and engagement. Additionally, a surge in retirement planning and 401(k) contributions is fueling consistent demand across various mutual fund categories in the region.

Key players in the market
Some of the key players profiled in the Mutual Fund Assets Market include BlackRock, Vanguard Group, Fidelity Investments, State Street Global Advisors, JPMorgan Chase, Capital Group, Amundi, Goldman Sachs, UBS, Invesco, Franklin Templeton, Legal & General, Northern Trust Corporation, Prudential Financial, T. Rowe Price, SBI Mutual Fund, ICICI Prudential Mutual Fund, HDFC Mutual Fund and Nippon Life India Asset Management Ltd.
Key Developments:
In April 2025, India?Post has signed a Memorandum of Understanding with SBI?Funds Management Ltd. to simplify the mutual fund investment journey by bringing KYC verification directly to people’s homes. Under this partnership, India?Post’s vast network—spanning approximately 164,000 post offices—will have trained personnel collect KYC documents from investors, ensuring secure, accurate, and privacy-compliant handling.
In February 2025, Paytm’s fintech arm, Paytm Services Pvt. Ltd., teamed up with SBI Mutual Fund to introduce JanNivesh ?250 SIP, a micro-SIP option that allows users to begin systematic investments with just ?250, available through platforms like Paytm, SBI YONO, Groww, and Zerodha.
Fund Types Covered:
• Equity Funds
• Debt Funds
• Hybrid Funds
• Money Market Funds
• Index Funds
• Exchange-Traded Funds (ETFs)
• Fund of Funds (FoFs)
Investor Types Covered:
• Retail Investors
• Institutional Investors
Asset Classes Covered:
• Domestic Equity
• International Equity
• Government Bonds
• Corporate Bonds
• Commodities
• Real Estate
• Other Asset Classes
Distribution Channels Covered:
• Direct Sales
• Financial Advisors
• Banks
• Online Platforms
• Brokers/Dealers
• Other Distribution Channels
Regions Covered:
• North America
o US
o Canada
o Mexico
• Europe
o Germany
o UK
o Italy
o France
o Spain
o Rest of Europe
• Asia Pacific
o Japan
o China
o India
o Australia
o New Zealand
o South Korea
o Rest of Asia Pacific
• South America
o Argentina
o Brazil
o Chile
o Rest of South America
• Middle East & Africa
o Saudi Arabia
o UAE
o Qatar
o South Africa
o Rest of Middle East & Africa
What our report offers:
- Market share assessments for the regional and country-level segments
- Strategic recommendations for the new entrants
- Covers Market data for the years 2022, 2023, 2024, 2026, and 2030
- Market Trends (Drivers, Constraints, Opportunities, Threats, Challenges, Investment Opportunities, and recommendations)
- Strategic recommendations in key business segments based on the market estimations
- Competitive landscaping mapping the key common trends
- Company profiling with detailed strategies, financials, and recent developments
- Supply chain trends mapping the latest technological advancements
Free Customization Offerings:
All the customers of this report will be entitled to receive one of the following free customization options:
• Company Profiling
o Comprehensive profiling of additional market players (up to 3)
o SWOT Analysis of key players (up to 3)
• Regional Segmentation
o Market estimations, Forecasts and CAGR of any prominent country as per the client's interest (Note: Depends on feasibility check)
• Competitive Benchmarking
o Benchmarking of key players based on product portfolio, geographical presence, and strategic alliances
Table of Contents
1 Executive Summary
2 Preface
2.1 Abstract
2.2 Stake Holders
2.3 Research Scope
2.4 Research Methodology
2.4.1 Data Mining
2.4.2 Data Analysis
2.4.3 Data Validation
2.4.4 Research Approach
2.5 Research Sources
2.5.1 Primary Research Sources
2.5.2 Secondary Research Sources
2.5.3 Assumptions
3 Market Trend Analysis
3.1 Introduction
3.2 Drivers
3.3 Restraints
3.4 Opportunities
3.5 Threats
3.6 Emerging Markets
3.7 Impact of Covid-19
4 Porters Five Force Analysis
4.1 Bargaining power of suppliers
4.2 Bargaining power of buyers
4.3 Threat of substitutes
4.4 Threat of new entrants
4.5 Competitive rivalry
5 Global Mutual Fund Assets Market, By Fund Type
5.1 Introduction
5.2 Equity Funds
5.3 Debt Funds
5.4 Hybrid Funds
5.5 Money Market Funds
5.6 Index Funds
5.7 Exchange-Traded Funds (ETFs)
5.8 Fund of Funds (FoFs)
6 Global Mutual Fund Assets Market, By Investor Type
6.1 Introduction
6.2 Retail Investors
6.3 Institutional Investors
7 Global Mutual Fund Assets Market, By Asset Class
7.1 Introduction
7.2 Domestic Equity
7.3 International Equity
7.4 Government Bonds
7.5 Corporate Bonds
7.6 Commodities
7.7 Real Estate
7.8 Other Asset Classes
8 Global Mutual Fund Assets Market, By Distribution Channel
8.1 Introduction
8.2 Direct Sales
8.3 Financial Advisors
8.4 Banks
8.5 Online Platforms
8.6 Brokers/Dealers
8.7 Other Distribution Channels
9 Global Mutual Fund Assets Market, By Geography
9.1 Introduction
9.2 North America
9.2.1 US
9.2.2 Canada
9.2.3 Mexico
9.3 Europe
9.3.1 Germany
9.3.2 UK
9.3.3 Italy
9.3.4 France
9.3.5 Spain
9.3.6 Rest of Europe
9.4 Asia Pacific
9.4.1 Japan
9.4.2 China
9.4.3 India
9.4.4 Australia
9.4.5 New Zealand
9.4.6 South Korea
9.4.7 Rest of Asia Pacific
9.5 South America
9.5.1 Argentina
9.5.2 Brazil
9.5.3 Chile
9.5.4 Rest of South America
9.6 Middle East & Africa
9.6.1 Saudi Arabia
9.6.2 UAE
9.6.3 Qatar
9.6.4 South Africa
9.6.5 Rest of Middle East & Africa
10 Key Developments
10.1 Agreements, Partnerships, Collaborations and Joint Ventures
10.2 Acquisitions & Mergers
10.3 New Product Launch
10.4 Expansions
10.5 Other Key Strategies
11 Company Profiling
11.1 BlackRock
11.2 Vanguard Group
11.3 Fidelity Investments
11.4 State Street Global Advisors
11.5 JPMorgan Chase
11.6 Capital Group
11.7 Amundi
11.8 Goldman Sachs
11.9 UBS
11.10 Invesco
11.11 Franklin Templeton
11.12 Legal & General
11.13 Northern Trust Corporation
11.14 Prudential Financial
11.15 T. Rowe Price
11.16 SBI Mutual Fund
11.17 ICICI Prudential Mutual Fund
11.18 HDFC Mutual Fund
11.19 Nippon Life India Asset Management Ltd.
List of Tables
1 Global Mutual Fund Assets Market Outlook, By Region (2024-2032) ($MN)
2 Global Mutual Fund Assets Market Outlook, By Fund Type (2024-2032) ($MN)
3 Global Mutual Fund Assets Market Outlook, By Equity Funds (2024-2032) ($MN)
4 Global Mutual Fund Assets Market Outlook, By Debt Funds (2024-2032) ($MN)
5 Global Mutual Fund Assets Market Outlook, By Hybrid Funds (2024-2032) ($MN)
6 Global Mutual Fund Assets Market Outlook, By Money Market Funds (2024-2032) ($MN)
7 Global Mutual Fund Assets Market Outlook, By Index Funds (2024-2032) ($MN)
8 Global Mutual Fund Assets Market Outlook, By Exchange-Traded Funds (ETFs) (2024-2032) ($MN)
9 Global Mutual Fund Assets Market Outlook, By Fund of Funds (FoFs) (2024-2032) ($MN)
10 Global Mutual Fund Assets Market Outlook, By Investor Type (2024-2032) ($MN)
11 Global Mutual Fund Assets Market Outlook, By Retail Investors (2024-2032) ($MN)
12 Global Mutual Fund Assets Market Outlook, By Institutional Investors (2024-2032) ($MN)
13 Global Mutual Fund Assets Market Outlook, By Asset Class (2024-2032) ($MN)
14 Global Mutual Fund Assets Market Outlook, By Domestic Equity (2024-2032) ($MN)
15 Global Mutual Fund Assets Market Outlook, By International Equity (2024-2032) ($MN)
16 Global Mutual Fund Assets Market Outlook, By Government Bonds (2024-2032) ($MN)
17 Global Mutual Fund Assets Market Outlook, By Corporate Bonds (2024-2032) ($MN)
18 Global Mutual Fund Assets Market Outlook, By Commodities (2024-2032) ($MN)
19 Global Mutual Fund Assets Market Outlook, By Real Estate (2024-2032) ($MN)
20 Global Mutual Fund Assets Market Outlook, By Other Asset Classes (2024-2032) ($MN)
21 Global Mutual Fund Assets Market Outlook, By Distribution Channel (2024-2032) ($MN)
22 Global Mutual Fund Assets Market Outlook, By Direct Sales (2024-2032) ($MN)
23 Global Mutual Fund Assets Market Outlook, By Financial Advisors (2024-2032) ($MN)
24 Global Mutual Fund Assets Market Outlook, By Banks (2024-2032) ($MN)
25 Global Mutual Fund Assets Market Outlook, By Online Platforms (2024-2032) ($MN)
26 Global Mutual Fund Assets Market Outlook, By Brokers/Dealers (2024-2032) ($MN)
27 Global Mutual Fund Assets Market Outlook, By Other Distribution Channels (2024-2032) ($MN)
Note: Tables for North America, Europe, APAC, South America, and Middle East & Africa Regions are also represented in the same manner as above.
List of Figures
RESEARCH METHODOLOGY

We at ‘Stratistics’ opt for an extensive research approach which involves data mining, data validation, and data analysis. The various research sources include in-house repository, secondary research, competitor’s sources, social media research, client internal data, and primary research.
Our team of analysts prefers the most reliable and authenticated data sources in order to perform the comprehensive literature search. With access to most of the authenticated data bases our team highly considers the best mix of information through various sources to obtain extensive and accurate analysis.
Each report takes an average time of a month and a team of 4 industry analysts. The time may vary depending on the scope and data availability of the desired market report. The various parameters used in the market assessment are standardized in order to enhance the data accuracy.
Data Mining
The data is collected from several authenticated, reliable, paid and unpaid sources and is filtered depending on the scope & objective of the research. Our reports repository acts as an added advantage in this procedure. Data gathering from the raw material suppliers, distributors and the manufacturers is performed on a regular basis, this helps in the comprehensive understanding of the products value chain. Apart from the above mentioned sources the data is also collected from the industry consultants to ensure the objective of the study is in the right direction.
Market trends such as technological advancements, regulatory affairs, market dynamics (Drivers, Restraints, Opportunities and Challenges) are obtained from scientific journals, market related national & international associations and organizations.
Data Analysis
From the data that is collected depending on the scope & objective of the research the data is subjected for the analysis. The critical steps that we follow for the data analysis include:
- Product Lifecycle Analysis
- Competitor analysis
- Risk analysis
- Porters Analysis
- PESTEL Analysis
- SWOT Analysis
The data engineering is performed by the core industry experts considering both the Marketing Mix Modeling and the Demand Forecasting. The marketing mix modeling makes use of multiple-regression techniques to predict the optimal mix of marketing variables. Regression factor is based on a number of variables and how they relate to an outcome such as sales or profits.
Data Validation
The data validation is performed by the exhaustive primary research from the expert interviews. This includes telephonic interviews, focus groups, face to face interviews, and questionnaires to validate our research from all aspects. The industry experts we approach come from the leading firms, involved in the supply chain ranging from the suppliers, distributors to the manufacturers and consumers so as to ensure an unbiased analysis.
We are in touch with more than 15,000 industry experts with the right mix of consultants, CEO's, presidents, vice presidents, managers, experts from both supply side and demand side, executives and so on.
The data validation involves the primary research from the industry experts belonging to:
- Leading Companies
- Suppliers & Distributors
- Manufacturers
- Consumers
- Industry/Strategic Consultants
Apart from the data validation the primary research also helps in performing the fill gap research, i.e. providing solutions for the unmet needs of the research which helps in enhancing the reports quality.
For more details about research methodology, kindly write to us at info@strategymrc.com
Frequently Asked Questions
In case of any queries regarding this report, you can contact the customer service by filing the “Inquiry Before Buy” form available on the right hand side. You may also contact us through email: info@strategymrc.com or phone: +1-301-202-5929
Yes, the samples are available for all the published reports. You can request them by filling the “Request Sample” option available in this page.
Yes, you can request a sample with your specific requirements. All the customized samples will be provided as per the requirement with the real data masked.
All our reports are available in Digital PDF format. In case if you require them in any other formats, such as PPT, Excel etc you can submit a request through “Inquiry Before Buy” form available on the right hand side. You may also contact us through email: info@strategymrc.com or phone: +1-301-202-5929
We offer a free 15% customization with every purchase. This requirement can be fulfilled for both pre and post sale. You may send your customization requirements through email at info@strategymrc.com or call us on +1-301-202-5929.
We have 3 different licensing options available in electronic format.
- Single User Licence: Allows one person, typically the buyer, to have access to the ordered product. The ordered product cannot be distributed to anyone else.
- 2-5 User Licence: Allows the ordered product to be shared among a maximum of 5 people within your organisation.
- Corporate License: Allows the product to be shared among all employees of your organisation regardless of their geographical location.
All our reports are typically be emailed to you as an attachment.
To order any available report you need to register on our website. The payment can be made either through CCAvenue or PayPal payments gateways which accept all international cards.
We extend our support to 6 months post sale. A post sale customization is also provided to cover your unmet needs in the report.
Request Customization
We offer complimentary customization of up to 15% with every purchase. To share your customization requirements, feel free to email us at info@strategymrc.com or call us on +1-301-202-5929. .
Please Note: Customization within the 15% threshold is entirely free of charge. If your request exceeds this limit, we will conduct a feasibility assessment. Following that, a detailed quote and timeline will be provided.
WHY CHOOSE US ?

Assured Quality
Best in class reports with high standard of research integrity

24X7 Research Support
Continuous support to ensure the best customer experience.

Free Customization
Adding more values to your product of interest.

Safe & Secure Access
Providing a secured environment for all online transactions.

Trusted by 600+ Brands
Serving the most reputed brands across the world.