
Nata De Coco Market
Nata De Coco Market Forecasts to 2030 - Global Analysis By Product Type (Jelly Drink, Juice Drink, Pudding, Jelly and Other Product Types), Packaging (Bottle, Box, Cup, Can, Sachet and Other Packagings), Distribution Channel, End User and By Geography

|
Years Covered |
2021-2030 |
|
Estimated Year Value (2023) |
US $836.93 MN |
|
Projected Year Value (2030) |
US $1,217.46 MN |
|
CAGR (2023 - 2030) |
5.5% |
|
Regions Covered |
North America, Europe, Asia Pacific, South America, and Middle East & Africa |
|
Countries Covered |
US, Canada, Mexico, Germany, UK, Italy, France, Spain, Japan, China, India, Australia, New Zealand, South Korea, Rest of Asia Pacific, South America, Argentina, Brazil, Chile, Middle East & Africa, Saudi Arabia, UAE, Qatar, and South Africa |
|
Largest Market |
Asia Pacific |
|
Highest Growing Market |
North America |
According to Stratistics MRC, the Global Nata De Coco Market is accounted for $836.93 million in 2023 and is expected to reach $1,217.46 million by 2030 growing at a CAGR of 5.5% during the forecast period. Nata de Coco is a chewy, translucent jelly-like product. It is made through the fermentation of coconut water with the help of Acetobacter xylinum bacteria, resulting in the formation of a cellulose structure. It has a unique texture and is often used in a variety of culinary applications. Due to its neutral taste and ability to absorb flavours, Nata de Coco is commonly used in desserts, beverages, salads, and snacks. It has gained popularity globally, particularly in Asian cuisines, and is appreciated for its versatility and association with healthier food choices.
According to India Brand Equity Foundation (IBEF), The e-commerce industry in India has changed how business is conducted there and opened up a variety of market niches, including business-to-business, consumer-to-business, direct-to-consumer, and consumer-to-consumer.
Market Dynamics:
Driver:
Global culinary trends
The rise of globalised food culture and the exploration of international cuisines have heightened demand for unique ingredients. Nata De Coco, with its origins in Asian culinary traditions, meets this demand by offering a distinct and tropical element to a variety of dishes. Furthermore, its ability to enhance both sweet and savoury dishes aligns with the evolving preferences of consumers seeking novel and adventurous gastronomic experiences, contributing to the continued growth of the Nata de Coco market worldwide.
Restraint:
Cost concerns
The production process, including coconut-derived raw materials and specific technologies, may contribute to elevated production costs. This factor can potentially lead to higher retail prices, impacting the competitiveness of Nata De Coco products compared to alternative dessert ingredients. Balancing the quality and affordability of Nata De Coco becomes crucial for market acceptance, as consumers may be sensitive to price fluctuations. As a result, it will impede market growth.
Opportunity:
Innovation in product development
Innovation in product development involves exploring creative and diverse applications of Nata De Coco to meet evolving consumer preferences. Manufacturers can introduce flavour variants, pre-packaged snacks, or incorporate Nata De Coco into novel food and beverage formulations. Experimentation with textures, combinations, and culinary techniques allows for the creation of unique and enticing products that appeal to a broader audience. Furthermore, collaborations with chefs and culinary experts can bring fresh perspectives, leading to the development of innovative recipes. Therefore, these innovations are accelerating market growth.
Threat:
Limited marketing and awareness
Limited marketing and awareness pose a threat to the Nata De Coco market, as potential consumers may remain unaware of the product's existence or its versatile applications. Inadequate promotional efforts hinder market penetration, impacting consumer education about the benefits and usage of Nata de Coco. Insufficient visibility in the marketplace may lead to slower adoption rates, limiting the product's recognition and acceptance.
Covid-19 Impact
The pandemic disrupted supply chains, impacting raw material availability and distribution. Lockdowns and restrictions affected production and market demand, leading to temporary closures of businesses. Shifts in consumer behaviour towards essential goods also affected the market. However, as restrictions eased, the market demonstrated resilience with an increased focus on health-conscious choices, potentially driving demand for Nata De Coco due to its natural and versatile characteristics.
The jelly segment is expected to be the largest during the forecast period
The jelly segment is estimated to hold the largest share. Nata De Coco jelly has gained popularity as a dessert ingredient due to its ability to absorb and carry various flavours, making it a versatile addition to a wide range of culinary applications. It is commonly used in desserts like fruit salads, ice creams, puddings, and bubble teas. The versatility of Nata De Coco jelly makes it an appealing ingredient for both traditional and innovative recipes, contributing to its distinct presence in the broader Nata De Coco market.
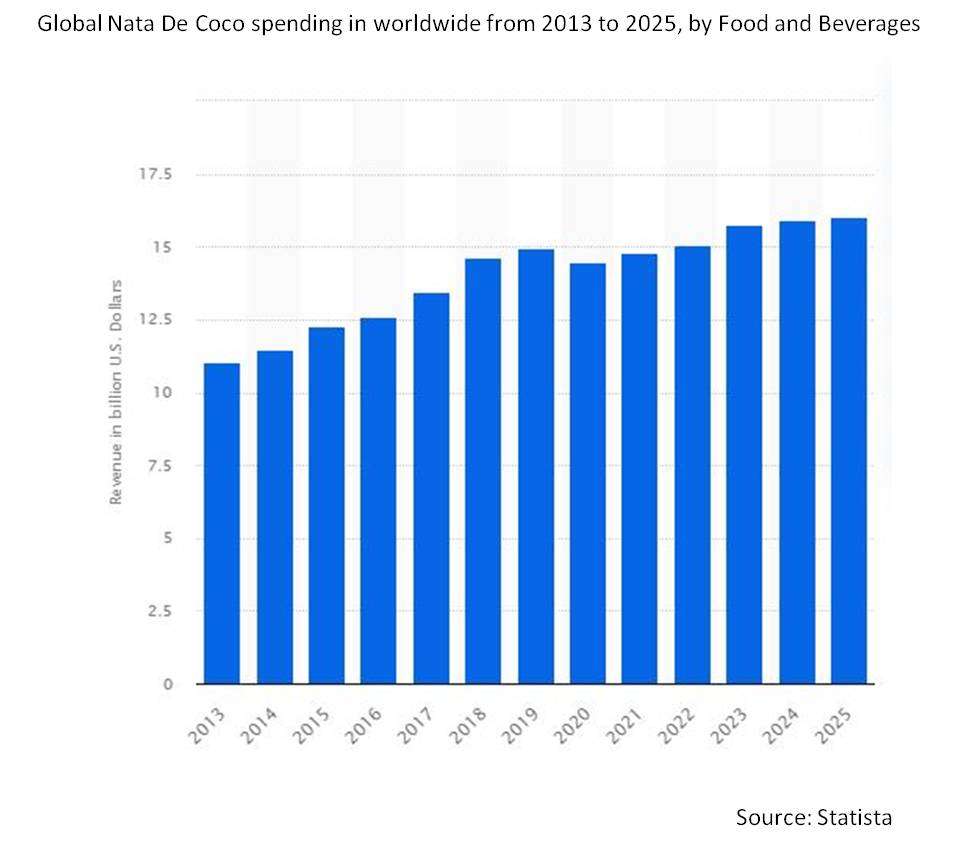
The food and beverages segment is expected to have the highest CAGR during the forecast period
The food and beverages segment is anticipated to have lucrative growth during the forecast period. It encompasses a wide array of finished products and applications that incorporate Nata De Coco as a key ingredient. Nata De Coco is commonly used in the production of desserts such as fruit salads, puddings, ice creams, and gelatin-based sweets. It is often featured in various beverages, including bubble teas, smoothies, and fruit-flavoured drinks. As a result, Nata De Coco contributes to the overall growth and diversification of the broader food and beverage market.
Region with largest share:
Asia Pacific commanded the largest market share during the extrapolated period. Nata de Coco, a popular gelatinous dessert ingredient derived from coconut water fermentation, enjoys widespread popularity in countries like Indonesia, the Philippines, Thailand, and Vietnam. Increasing consumer awareness of healthier food choices, coupled with a rising preference for natural and organic products, has fuelled the market's expansion. Additionally, the region's rich coconut cultivation and processing capabilities contribute to the robust supply chain.
Region with highest CAGR:
North America is expected to witness profitable growth over the projection period. Increasing globalisation and multicultural influences have spurred its presence in North America. The market is driven by a growing demand for unique and exotic food experiences, with consumers seeking innovative ingredients. Health-conscious trends and a preference for natural products contribute to the rising popularity of Nata De Coco. As a result, North America presents opportunities for market expansion, as diverse palates and a willingness to explore new culinary trends contribute to the product's acceptance.

Key players in the market
Some of the key players in the Nata De Coco Market include Happy Alliance (M) Sdn Bhd, Hainan Yeguo Foods, Schmecken Agro Food Products, Shireli Manufacturing, Siva Foods, HTK Foods, Mogu Mogu Manila, Nata De Coco Manufacturing Sdn Bhd, F&N Magnolia, Choke Mahachai Beverage Co., Ltd., The Prachuab Fruit Canning Co., Ltd. and Jeram Coconut Sdn. Bhd.
Key Developments:
In April 2021, Cass Materials, a start-up based in Australia, developed a new edible scaffold that cellular agriculture food scientists can use to make cultured proteins. The company's biodegradable scaffolding, made from nata de coco, can provide a set for animal cells to grow in and is an excellent substitute for the gelatin-centered fibers that many lab-grown meat makers still utilize.
In October 2020, HTK and Flooid Announce Partnership. This partnership will deliver more options for personalised customer experiences across retail touchpoints
Product Types Covered:
• Jelly Drink
• Juice Drink
• Pudding
• Jelly
• Other Product Types
Packagings Covered:
• Bottle
• Box
• Cup
• Can
• Sachet
• Other Packagings
Distribution Channels Covered:
• Hypermarket
• Supermarket
• E-commerce
• Convenience Stores
End Users Covered:
• Food and Beverages
• Pharmaceutical
• Cosmetics
• Other End Users
Regions Covered:
• North America
o US
o Canada
o Mexico
• Europe
o Germany
o UK
o Italy
o France
o Spain
o Rest of Europe
• Asia Pacific
o Japan
o China
o India
o Australia
o New Zealand
o South Korea
o Rest of Asia Pacific
• South America
o Argentina
o Brazil
o Chile
o Rest of South America
• Middle East & Africa
o Saudi Arabia
o UAE
o Qatar
o South Africa
o Rest of Middle East & Africa
What our report offers:
- Market share assessments for the regional and country-level segments
- Strategic recommendations for the new entrants
- Covers Market data for the years 2021, 2022, 2023, 2026, and 2030
- Market Trends (Drivers, Constraints, Opportunities, Threats, Challenges, Investment Opportunities, and recommendations)
- Strategic recommendations in key business segments based on the market estimations
- Competitive landscaping mapping the key common trends
- Company profiling with detailed strategies, financials, and recent developments
- Supply chain trends mapping the latest technological advancements
Free Customization Offerings:
All the customers of this report will be entitled to receive one of the following free customization options:
• Company Profiling
o Comprehensive profiling of additional market players (up to 3)
o SWOT Analysis of key players (up to 3)
• Regional Segmentation
o Market estimations, Forecasts and CAGR of any prominent country as per the client's interest (Note: Depends on feasibility check)
• Competitive Benchmarking
Benchmarking of key players based on product portfolio, geographical presence, and strategic alliances
Table of Contents
1 Executive Summary
2 Preface
2.1 Abstract
2.2 Stake Holders
2.3 Research Scope
2.4 Research Methodology
2.4.1 Data Mining
2.4.2 Data Analysis
2.4.3 Data Validation
2.4.4 Research Approach
2.5 Research Sources
2.5.1 Primary Research Sources
2.5.2 Secondary Research Sources
2.5.3 Assumptions
3 Market Trend Analysis
3.1 Introduction
3.2 Drivers
3.3 Restraints
3.4 Opportunities
3.5 Threats
3.6 Product Analysis
3.7 End User Analysis
3.8 Emerging Markets
3.9 Impact of Covid-19
4 Porters Five Force Analysis
4.1 Bargaining power of suppliers
4.2 Bargaining power of buyers
4.3 Threat of substitutes
4.4 Threat of new entrants
4.5 Competitive rivalry
5 Global Nata De Coco Market, By Product Type
5.1 Introduction
5.2 Jelly Drink
5.3 Juice Drink
5.4 Pudding
5.5 Jelly
5.6 Other Product Types
6 Global Nata De Coco Market, By Packaging
6.1 Introduction
6.2 Bottle
6.3 Box
6.4 Cup
6.5 Can
6.6 Sachet
6.7 Other Packagings
7 Global Nata De Coco Market, By Distribution Channel
7.1 Introduction
7.2 Hypermarket
7.3 Supermarket
7.4 E-commerce
7.5 Convenience Stores
8 Global Nata De Coco Market, By End User
8.1 Introduction
8.2 Food and Beverages
8.3 Pharmaceutical
8.4 Cosmetics
8.5 Other End Users
9 Global Nata De Coco Market, By Geography
9.1 Introduction
9.2 North America
9.2.1 US
9.2.2 Canada
9.2.3 Mexico
9.3 Europe
9.3.1 Germany
9.3.2 UK
9.3.3 Italy
9.3.4 France
9.3.5 Spain
9.3.6 Rest of Europe
9.4 Asia Pacific
9.4.1 Japan
9.4.2 China
9.4.3 India
9.4.4 Australia
9.4.5 New Zealand
9.4.6 South Korea
9.4.7 Rest of Asia Pacific
9.5 South America
9.5.1 Argentina
9.5.2 Brazil
9.5.3 Chile
9.5.4 Rest of South America
9.6 Middle East & Africa
9.6.1 Saudi Arabia
9.6.2 UAE
9.6.3 Qatar
9.6.4 South Africa
9.6.5 Rest of Middle East & Africa
10 Key Developments
10.1 Agreements, Partnerships, Collaborations and Joint Ventures
10.2 Acquisitions & Mergers
10.3 New Product Launch
10.4 Expansions
10.5 Other Key Strategies
11 Company Profiling
11.1 Happy Alliance (M) Sdn Bhd
11.2 Hainan Yeguo Foods
11.3 Schmecken Agro Food Products
11.4 Shireli Manufacturing
11.5 Siva Foods
11.6 HTK Foods
11.7 Mogu Mogu Manila
11.8 Nata De Coco Manufacturing Sdn Bhd
11.9 F&N Magnolia
11.10 Choke Mahachai Beverage Co., Ltd.
11.11 The Prachuab Fruit Canning Co., Ltd.
11.12 Jeram Coconut Sdn. Bhd.
List of Tables
1 Global Nata De Coco Market Outlook, By Region (2021-2030) ($MN)
2 Global Nata De Coco Market Outlook, By Product Type (2021-2030) ($MN)
3 Global Nata De Coco Market Outlook, By Jelly Drink (2021-2030) ($MN)
4 Global Nata De Coco Market Outlook, By Juice Drink (2021-2030) ($MN)
5 Global Nata De Coco Market Outlook, By Pudding (2021-2030) ($MN)
6 Global Nata De Coco Market Outlook, By Jelly (2021-2030) ($MN)
7 Global Nata De Coco Market Outlook, By Other Product Types (2021-2030) ($MN)
8 Global Nata De Coco Market Outlook, By Packaging (2021-2030) ($MN)
9 Global Nata De Coco Market Outlook, By Bottle (2021-2030) ($MN)
10 Global Nata De Coco Market Outlook, By Box (2021-2030) ($MN)
11 Global Nata De Coco Market Outlook, By Cup (2021-2030) ($MN)
12 Global Nata De Coco Market Outlook, By Can (2021-2030) ($MN)
13 Global Nata De Coco Market Outlook, By Sachet (2021-2030) ($MN)
14 Global Nata De Coco Market Outlook, By Other Packagings (2021-2030) ($MN)
15 Global Nata De Coco Market Outlook, By Distribution Channel (2021-2030) ($MN)
16 Global Nata De Coco Market Outlook, By Hypermarket (2021-2030) ($MN)
17 Global Nata De Coco Market Outlook, By Supermarket (2021-2030) ($MN)
18 Global Nata De Coco Market Outlook, By E-commerce (2021-2030) ($MN)
19 Global Nata De Coco Market Outlook, By Convenience Stores (2021-2030) ($MN)
20 Global Nata De Coco Market Outlook, By End User (2021-2030) ($MN)
21 Global Nata De Coco Market Outlook, By Food and Beverages (2021-2030) ($MN)
22 Global Nata De Coco Market Outlook, By Pharmaceutical (2021-2030) ($MN)
23 Global Nata De Coco Market Outlook, By Cosmetics (2021-2030) ($MN)
24 Global Nata De Coco Market Outlook, By Other End Users (2021-2030) ($MN)
25 North America Nata De Coco Market Outlook, By Country (2021-2030) ($MN)
26 North America Nata De Coco Market Outlook, By Product Type (2021-2030) ($MN)
27 North America Nata De Coco Market Outlook, By Jelly Drink (2021-2030) ($MN)
28 North America Nata De Coco Market Outlook, By Juice Drink (2021-2030) ($MN)
29 North America Nata De Coco Market Outlook, By Pudding (2021-2030) ($MN)
30 North America Nata De Coco Market Outlook, By Jelly (2021-2030) ($MN)
31 North America Nata De Coco Market Outlook, By Other Product Types (2021-2030) ($MN)
32 North America Nata De Coco Market Outlook, By Packaging (2021-2030) ($MN)
33 North America Nata De Coco Market Outlook, By Bottle (2021-2030) ($MN)
34 North America Nata De Coco Market Outlook, By Box (2021-2030) ($MN)
35 North America Nata De Coco Market Outlook, By Cup (2021-2030) ($MN)
36 North America Nata De Coco Market Outlook, By Can (2021-2030) ($MN)
37 North America Nata De Coco Market Outlook, By Sachet (2021-2030) ($MN)
38 North America Nata De Coco Market Outlook, By Other Packagings (2021-2030) ($MN)
39 North America Nata De Coco Market Outlook, By Distribution Channel (2021-2030) ($MN)
40 North America Nata De Coco Market Outlook, By Hypermarket (2021-2030) ($MN)
41 North America Nata De Coco Market Outlook, By Supermarket (2021-2030) ($MN)
42 North America Nata De Coco Market Outlook, By E-commerce (2021-2030) ($MN)
43 North America Nata De Coco Market Outlook, By Convenience Stores (2021-2030) ($MN)
44 North America Nata De Coco Market Outlook, By End User (2021-2030) ($MN)
45 North America Nata De Coco Market Outlook, By Food and Beverages (2021-2030) ($MN)
46 North America Nata De Coco Market Outlook, By Pharmaceutical (2021-2030) ($MN)
47 North America Nata De Coco Market Outlook, By Cosmetics (2021-2030) ($MN)
48 North America Nata De Coco Market Outlook, By Other End Users (2021-2030) ($MN)
49 Europe Nata De Coco Market Outlook, By Country (2021-2030) ($MN)
50 Europe Nata De Coco Market Outlook, By Product Type (2021-2030) ($MN)
51 Europe Nata De Coco Market Outlook, By Jelly Drink (2021-2030) ($MN)
52 Europe Nata De Coco Market Outlook, By Juice Drink (2021-2030) ($MN)
53 Europe Nata De Coco Market Outlook, By Pudding (2021-2030) ($MN)
54 Europe Nata De Coco Market Outlook, By Jelly (2021-2030) ($MN)
55 Europe Nata De Coco Market Outlook, By Other Product Types (2021-2030) ($MN)
56 Europe Nata De Coco Market Outlook, By Packaging (2021-2030) ($MN)
57 Europe Nata De Coco Market Outlook, By Bottle (2021-2030) ($MN)
58 Europe Nata De Coco Market Outlook, By Box (2021-2030) ($MN)
59 Europe Nata De Coco Market Outlook, By Cup (2021-2030) ($MN)
60 Europe Nata De Coco Market Outlook, By Can (2021-2030) ($MN)
61 Europe Nata De Coco Market Outlook, By Sachet (2021-2030) ($MN)
62 Europe Nata De Coco Market Outlook, By Other Packagings (2021-2030) ($MN)
63 Europe Nata De Coco Market Outlook, By Distribution Channel (2021-2030) ($MN)
64 Europe Nata De Coco Market Outlook, By Hypermarket (2021-2030) ($MN)
65 Europe Nata De Coco Market Outlook, By Supermarket (2021-2030) ($MN)
66 Europe Nata De Coco Market Outlook, By E-commerce (2021-2030) ($MN)
67 Europe Nata De Coco Market Outlook, By Convenience Stores (2021-2030) ($MN)
68 Europe Nata De Coco Market Outlook, By End User (2021-2030) ($MN)
69 Europe Nata De Coco Market Outlook, By Food and Beverages (2021-2030) ($MN)
70 Europe Nata De Coco Market Outlook, By Pharmaceutical (2021-2030) ($MN)
71 Europe Nata De Coco Market Outlook, By Cosmetics (2021-2030) ($MN)
72 Europe Nata De Coco Market Outlook, By Other End Users (2021-2030) ($MN)
73 Asia Pacific Nata De Coco Market Outlook, By Country (2021-2030) ($MN)
74 Asia Pacific Nata De Coco Market Outlook, By Product Type (2021-2030) ($MN)
75 Asia Pacific Nata De Coco Market Outlook, By Jelly Drink (2021-2030) ($MN)
76 Asia Pacific Nata De Coco Market Outlook, By Juice Drink (2021-2030) ($MN)
77 Asia Pacific Nata De Coco Market Outlook, By Pudding (2021-2030) ($MN)
78 Asia Pacific Nata De Coco Market Outlook, By Jelly (2021-2030) ($MN)
79 Asia Pacific Nata De Coco Market Outlook, By Other Product Types (2021-2030) ($MN)
80 Asia Pacific Nata De Coco Market Outlook, By Packaging (2021-2030) ($MN)
81 Asia Pacific Nata De Coco Market Outlook, By Bottle (2021-2030) ($MN)
82 Asia Pacific Nata De Coco Market Outlook, By Box (2021-2030) ($MN)
83 Asia Pacific Nata De Coco Market Outlook, By Cup (2021-2030) ($MN)
84 Asia Pacific Nata De Coco Market Outlook, By Can (2021-2030) ($MN)
85 Asia Pacific Nata De Coco Market Outlook, By Sachet (2021-2030) ($MN)
86 Asia Pacific Nata De Coco Market Outlook, By Other Packagings (2021-2030) ($MN)
87 Asia Pacific Nata De Coco Market Outlook, By Distribution Channel (2021-2030) ($MN)
88 Asia Pacific Nata De Coco Market Outlook, By Hypermarket (2021-2030) ($MN)
89 Asia Pacific Nata De Coco Market Outlook, By Supermarket (2021-2030) ($MN)
90 Asia Pacific Nata De Coco Market Outlook, By E-commerce (2021-2030) ($MN)
91 Asia Pacific Nata De Coco Market Outlook, By Convenience Stores (2021-2030) ($MN)
92 Asia Pacific Nata De Coco Market Outlook, By End User (2021-2030) ($MN)
93 Asia Pacific Nata De Coco Market Outlook, By Food and Beverages (2021-2030) ($MN)
94 Asia Pacific Nata De Coco Market Outlook, By Pharmaceutical (2021-2030) ($MN)
95 Asia Pacific Nata De Coco Market Outlook, By Cosmetics (2021-2030) ($MN)
96 Asia Pacific Nata De Coco Market Outlook, By Other End Users (2021-2030) ($MN)
97 South America Nata De Coco Market Outlook, By Country (2021-2030) ($MN)
98 South America Nata De Coco Market Outlook, By Product Type (2021-2030) ($MN)
99 South America Nata De Coco Market Outlook, By Jelly Drink (2021-2030) ($MN)
100 South America Nata De Coco Market Outlook, By Juice Drink (2021-2030) ($MN)
101 South America Nata De Coco Market Outlook, By Pudding (2021-2030) ($MN)
102 South America Nata De Coco Market Outlook, By Jelly (2021-2030) ($MN)
103 South America Nata De Coco Market Outlook, By Other Product Types (2021-2030) ($MN)
104 South America Nata De Coco Market Outlook, By Packaging (2021-2030) ($MN)
105 South America Nata De Coco Market Outlook, By Bottle (2021-2030) ($MN)
106 South America Nata De Coco Market Outlook, By Box (2021-2030) ($MN)
107 South America Nata De Coco Market Outlook, By Cup (2021-2030) ($MN)
108 South America Nata De Coco Market Outlook, By Can (2021-2030) ($MN)
109 South America Nata De Coco Market Outlook, By Sachet (2021-2030) ($MN)
110 South America Nata De Coco Market Outlook, By Other Packagings (2021-2030) ($MN)
111 South America Nata De Coco Market Outlook, By Distribution Channel (2021-2030) ($MN)
112 South America Nata De Coco Market Outlook, By Hypermarket (2021-2030) ($MN)
113 South America Nata De Coco Market Outlook, By Supermarket (2021-2030) ($MN)
114 South America Nata De Coco Market Outlook, By E-commerce (2021-2030) ($MN)
115 South America Nata De Coco Market Outlook, By Convenience Stores (2021-2030) ($MN)
116 South America Nata De Coco Market Outlook, By End User (2021-2030) ($MN)
117 South America Nata De Coco Market Outlook, By Food and Beverages (2021-2030) ($MN)
118 South America Nata De Coco Market Outlook, By Pharmaceutical (2021-2030) ($MN)
119 South America Nata De Coco Market Outlook, By Cosmetics (2021-2030) ($MN)
120 South America Nata De Coco Market Outlook, By Other End Users (2021-2030) ($MN)
121 Middle East & Africa Nata De Coco Market Outlook, By Country (2021-2030) ($MN)
122 Middle East & Africa Nata De Coco Market Outlook, By Product Type (2021-2030) ($MN)
123 Middle East & Africa Nata De Coco Market Outlook, By Jelly Drink (2021-2030) ($MN)
124 Middle East & Africa Nata De Coco Market Outlook, By Juice Drink (2021-2030) ($MN)
125 Middle East & Africa Nata De Coco Market Outlook, By Pudding (2021-2030) ($MN)
126 Middle East & Africa Nata De Coco Market Outlook, By Jelly (2021-2030) ($MN)
127 Middle East & Africa Nata De Coco Market Outlook, By Other Product Types (2021-2030) ($MN)
128 Middle East & Africa Nata De Coco Market Outlook, By Packaging (2021-2030) ($MN)
129 Middle East & Africa Nata De Coco Market Outlook, By Bottle (2021-2030) ($MN)
130 Middle East & Africa Nata De Coco Market Outlook, By Box (2021-2030) ($MN)
131 Middle East & Africa Nata De Coco Market Outlook, By Cup (2021-2030) ($MN)
132 Middle East & Africa Nata De Coco Market Outlook, By Can (2021-2030) ($MN)
133 Middle East & Africa Nata De Coco Market Outlook, By Sachet (2021-2030) ($MN)
134 Middle East & Africa Nata De Coco Market Outlook, By Other Packagings (2021-2030) ($MN)
135 Middle East & Africa Nata De Coco Market Outlook, By Distribution Channel (2021-2030) ($MN)
136 Middle East & Africa Nata De Coco Market Outlook, By Hypermarket (2021-2030) ($MN)
137 Middle East & Africa Nata De Coco Market Outlook, By Supermarket (2021-2030) ($MN)
138 Middle East & Africa Nata De Coco Market Outlook, By E-commerce (2021-2030) ($MN)
139 Middle East & Africa Nata De Coco Market Outlook, By Convenience Stores (2021-2030) ($MN)
140 Middle East & Africa Nata De Coco Market Outlook, By End User (2021-2030) ($MN)
141 Middle East & Africa Nata De Coco Market Outlook, By Food and Beverages (2021-2030) ($MN)
142 Middle East & Africa Nata De Coco Market Outlook, By Pharmaceutical (2021-2030) ($MN)
143 Middle East & Africa Nata De Coco Market Outlook, By Cosmetics (2021-2030) ($MN)
144 Middle East & Africa Nata De Coco Market Outlook, By Other End Users (2021-2030) ($MN)
List of Figures
RESEARCH METHODOLOGY

We at ‘Stratistics’ opt for an extensive research approach which involves data mining, data validation, and data analysis. The various research sources include in-house repository, secondary research, competitor’s sources, social media research, client internal data, and primary research.
Our team of analysts prefers the most reliable and authenticated data sources in order to perform the comprehensive literature search. With access to most of the authenticated data bases our team highly considers the best mix of information through various sources to obtain extensive and accurate analysis.
Each report takes an average time of a month and a team of 4 industry analysts. The time may vary depending on the scope and data availability of the desired market report. The various parameters used in the market assessment are standardized in order to enhance the data accuracy.
Data Mining
The data is collected from several authenticated, reliable, paid and unpaid sources and is filtered depending on the scope & objective of the research. Our reports repository acts as an added advantage in this procedure. Data gathering from the raw material suppliers, distributors and the manufacturers is performed on a regular basis, this helps in the comprehensive understanding of the products value chain. Apart from the above mentioned sources the data is also collected from the industry consultants to ensure the objective of the study is in the right direction.
Market trends such as technological advancements, regulatory affairs, market dynamics (Drivers, Restraints, Opportunities and Challenges) are obtained from scientific journals, market related national & international associations and organizations.
Data Analysis
From the data that is collected depending on the scope & objective of the research the data is subjected for the analysis. The critical steps that we follow for the data analysis include:
- Product Lifecycle Analysis
- Competitor analysis
- Risk analysis
- Porters Analysis
- PESTEL Analysis
- SWOT Analysis
The data engineering is performed by the core industry experts considering both the Marketing Mix Modeling and the Demand Forecasting. The marketing mix modeling makes use of multiple-regression techniques to predict the optimal mix of marketing variables. Regression factor is based on a number of variables and how they relate to an outcome such as sales or profits.
Data Validation
The data validation is performed by the exhaustive primary research from the expert interviews. This includes telephonic interviews, focus groups, face to face interviews, and questionnaires to validate our research from all aspects. The industry experts we approach come from the leading firms, involved in the supply chain ranging from the suppliers, distributors to the manufacturers and consumers so as to ensure an unbiased analysis.
We are in touch with more than 15,000 industry experts with the right mix of consultants, CEO's, presidents, vice presidents, managers, experts from both supply side and demand side, executives and so on.
The data validation involves the primary research from the industry experts belonging to:
- Leading Companies
- Suppliers & Distributors
- Manufacturers
- Consumers
- Industry/Strategic Consultants
Apart from the data validation the primary research also helps in performing the fill gap research, i.e. providing solutions for the unmet needs of the research which helps in enhancing the reports quality.
For more details about research methodology, kindly write to us at info@strategymrc.com
Frequently Asked Questions
In case of any queries regarding this report, you can contact the customer service by filing the “Inquiry Before Buy” form available on the right hand side. You may also contact us through email: info@strategymrc.com or phone: +1-301-202-5929
Yes, the samples are available for all the published reports. You can request them by filling the “Request Sample” option available in this page.
Yes, you can request a sample with your specific requirements. All the customized samples will be provided as per the requirement with the real data masked.
All our reports are available in Digital PDF format. In case if you require them in any other formats, such as PPT, Excel etc you can submit a request through “Inquiry Before Buy” form available on the right hand side. You may also contact us through email: info@strategymrc.com or phone: +1-301-202-5929
We offer a free 15% customization with every purchase. This requirement can be fulfilled for both pre and post sale. You may send your customization requirements through email at info@strategymrc.com or call us on +1-301-202-5929.
We have 3 different licensing options available in electronic format.
- Single User Licence: Allows one person, typically the buyer, to have access to the ordered product. The ordered product cannot be distributed to anyone else.
- 2-5 User Licence: Allows the ordered product to be shared among a maximum of 5 people within your organisation.
- Corporate License: Allows the product to be shared among all employees of your organisation regardless of their geographical location.
All our reports are typically be emailed to you as an attachment.
To order any available report you need to register on our website. The payment can be made either through CCAvenue or PayPal payments gateways which accept all international cards.
We extend our support to 6 months post sale. A post sale customization is also provided to cover your unmet needs in the report.
Request Customization
We offer complimentary customization of up to 15% with every purchase. To share your customization requirements, feel free to email us at info@strategymrc.com or call us on +1-301-202-5929. .
Please Note: Customization within the 15% threshold is entirely free of charge. If your request exceeds this limit, we will conduct a feasibility assessment. Following that, a detailed quote and timeline will be provided.
WHY CHOOSE US ?

Assured Quality
Best in class reports with high standard of research integrity

24X7 Research Support
Continuous support to ensure the best customer experience.

Free Customization
Adding more values to your product of interest.

Safe & Secure Access
Providing a secured environment for all online transactions.

Trusted by 600+ Brands
Serving the most reputed brands across the world.