
Natural Vitamin E Market
Natural Vitamin-E Market Forecasts to 2028 - Global Analysis By Type (Tocopherols and Tocotrienols), Product Type (Naturally-sourced Vitamin E and Synthetically-sourced Vitamin E), Form (Powder, Dry probiotic, Liquid probiotic and Liquids), Function, Application, End user and By Geography

|
Years Covered |
2020-2028 |
|
Estimated Year Value (2022) |
US $865.32 MN |
|
Projected Year Value (2028) |
US $1,435.34 MN |
|
CAGR (2022 - 2028) |
8.8% |
|
Regions Covered |
North America, Europe, Asia Pacific, South America, and Middle East & Africa |
|
Countries Covered |
US, Canada, Mexico, Germany, UK, Italy, France, Spain, Japan, China, India, Australia, New Zealand, South Korea, Rest of Asia Pacific, South America, Argentina, Brazil, Chile, Middle East & Africa, Saudi Arabia, UAE, Qatar, and South Africa |
|
Largest Market |
North America |
|
Highest Growing Market |
Asia-Pacific |
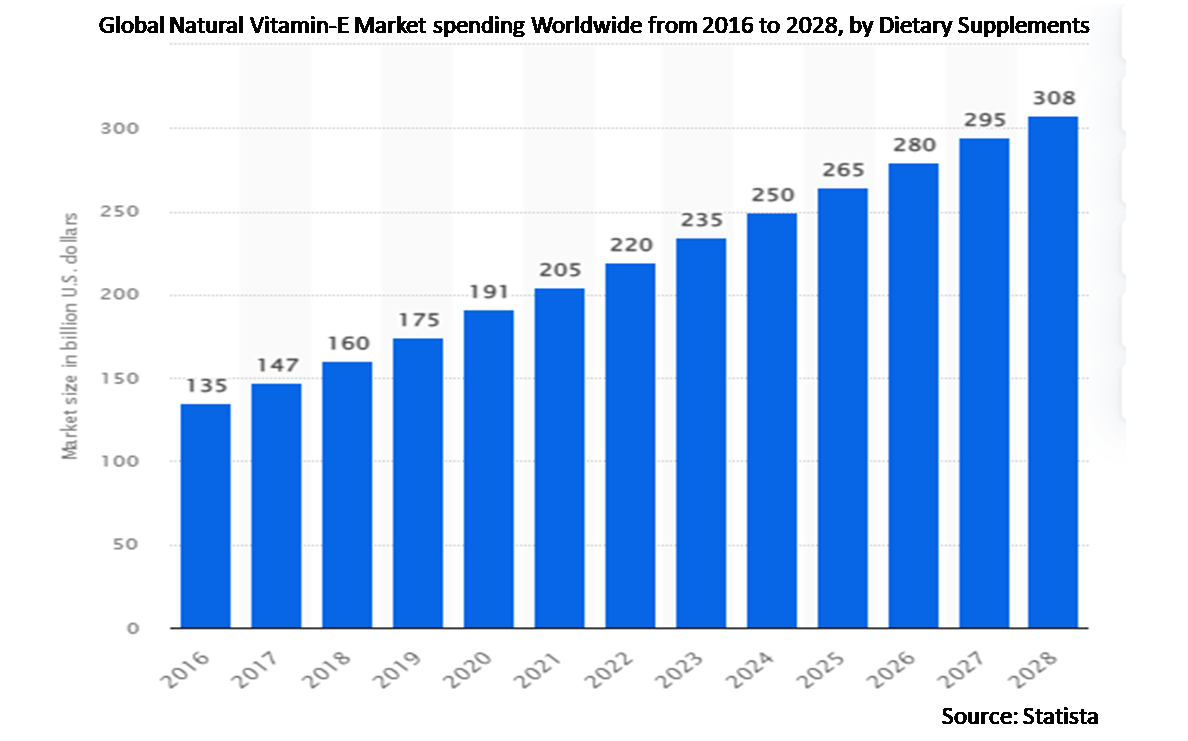
According to Stratistics MRC, the Global Natural Vitamin-E Market is accounted for $865.32 million in 2022 and is expected to reach $1,435.34 million by 2028 growing at a CAGR of 8.8% during the forecast period. Vitamin E is a fat-soluble antioxidant that protects the cell membrane from reactive oxygen species. It can be found in various foods, including vegetable oil, fruits and vegetables, meat, cereal, poultry eggs, and wheat germ oil. Vitamin E insufficiency is common in persons with genetic disorders or premature newborns. Vitamin E-rich foods include olive, canola, almonds, margarine, and peanuts. Meats, leafy greens, dairy, and fortified cereals are other good sources of natural vitamin E.
According to Food and Agriculture Organization, Mexico, the largest milk producer in Central America, continues to invest in producing better-quality animal feed with incorporated nutrients to maintain productivity, thereby driving the demand for natural Vitamin E ingredients.
Market Dynamics:
Driver:
Increasing demand for vitamin E
The increased demand for vitamin supplements is likely to cause a significant increase in the global market for natural vitamin E during the forecast period. A substantial body of clinical research backs up the importance of vitamins for overall health and their advantages for the human body, especially the bones. Sales of natural vitamin E-based goods, including pharmaceutical-grade injections, oral supplements, food fortification, and dietary supplements, will be boosted by this factor, which will accelerate market growth over the course of the forecast period.
Restraint:
Fluctuating Raw Material Costs and Rising Production Costs
Vitamin E inhibits platelet aggregation, which reduces blood clotting. If you take blood thinners, such as Coumadin (warfarin) or Plavix (clopidogrel), consult your doctor before taking vitamin E, especially if you have poor vitamin K consumption. Furthermore, avoid taking vitamin E at least two weeks before surgery to prevent excessive bleeding. Excessive usage of vitamin E has several side effects which may challenge the market’s growth as it causes blood thinning and deadly hemorrhage. The supply chain disruption caused to several political and natural causes has further affected product availability, which may be a significant barrier to market growth over the forecast period.
Opportunity:
Increasing Prevalence of Chronic Diseases
One of the key factors driving market expansion is the increasing prevalence of chronic disorders. The increased prevalence of chronic diseases such as diabetes, obesity, cholesterol-related osteoarthritis, and cardiovascular diseases (CVDs) is expected to raise the need for vitamin E supplements over the projected period. People with macular degeneration, Crohn's disease, and cystic fibrosis need to take vitamin E medication to prevent problems with breathing, digestion, weight loss, gastrointestinal infections, and trouble absorbing nutrients. Due to its powerful antioxidant properties, which support the immune system's vigor and help prevent blood clots, the body needs it. Additionally, the anti-inflammatory system protects cells from free radicals. This has inspired experts to dig deeper into vitamin E's therapeutic potential.
Threat:
Fluctuating Raw Material Costs and Rising Production Costs
Vitamin E usage in excess can thin the blood and result in fatal haemorrhages. Market expansion is being hampered by supply chain instability, fluctuating raw material prices, and growing production costs. There are a number of side effects that are related to pill dose. Bleeding, fatigue, headaches, and nausea are possible side effects. In e-cigarettes and other vamping products, vitamin E acetate can be discovered. This vitamin has been linked to lung harm. The demand for vitamin E products is being constrained by these factors.
Covid-19 Impact:
During the projection period, COVID-19's increased prevalence is anticipated to have an effect on market expansion. The healthcare sector has been directly and significantly impacted by the COVID-19 situation. The majority of pharmaceutical and nutraceutical companies recorded a minor loss in the first few quarters as a result of the rapid impact on the supply chain and limits placed on manufacturing and supply operations during the early phases of the coronavirus outbreak. The demand for nutraceuticals, such as natural vitamin E, has surged as a result of COVID-19, and some important players have enjoyed favourable sales development as a result.
The Tocopherols segment is expected to be the largest during the forecast period
The Tocopherols segment is projected to witness the largest share as compared to other segments over the forecast period. Highly fractionated D-alpha-tocopherols or its esters are the most common forms of vitamin E found in nature. Out of the eight chemical types known to exist, alpha-tocopherol is recognized to satisfy human nutritional needs. Due to the availability of tocopherols in most diets as opposed to tocotrienols, tocotrienols are a less prevalent type of vitamin-E. So, more tocopherols are used in the design and development of dietary supplements. Additionally, the use of tocopherols in cosmetic goods has grown. Since tocopherols are a good source of vitamin E and protect the skin from numerous harmful effects, notably from sun radiation, the cosmetics industry uses them frequently in its products.
The Dietary Supplements segment is expected to have the highest CAGR during the forecast period
The market saw dietary supplements as the top application sector. Most micronutrients can be found in isolated and purified concentrations on the international market. One of the most popular vitamin E product formats is pills and tablets, which are isolated and purified concentrations. The market for nutraceuticals is gradually changing in favour of fortified meals as a means of achieving maximal nutrient penetration among the general population. Therefore, fortified foods are practical, affordable, accessible, and safe platforms for the inclusion of micronutrients like vitamin E, which is a crucial factor fostering the expansion of the global market.
Region with largest share:
The world market for naturally occurring vitamin E is anticipated to be dominated by North America in the upcoming forecast period. Increasing patterns of medical spending, aging, increased technology, better healthcare facilities, and an increase in the number of insured people are all present in North American countries, including the United States. These elements enable the application of vitamin E in a range of end-user industries. Functional foods that offer extra advantages for health and wellness have also greatly expanded the market. An increase in the older population, rising health care expenditures, changes in lifestyle, and the development of new foods have all contributed to market expansion. This made it possible for producers of functional foods to identify components that offered enhanced advantages and could potentially satisfy rising demand.
Region with highest CAGR:
During the forecast period, Asia-Pacific is anticipated to have the fastest growth rate. Consumer awareness of the health advantages of various vitamin kinds is causing the vitamin market in Asia-Pacific nations to shift quickly. In the Asia-Pacific region, China produces the most vitamin E. In recent years, the nation has also grown its domestic market, mostly as a result of the expanding pharmaceutical and dietary supplement industries nationwide. Additionally, just 9% of Indian customers are aware of the health advantages of vitamin E, despite an increase in understanding of the significance of various vitamins in nations like India. While the majority of people use vitamin E to treat common illnesses, widespread ignorance prevents vitamin E from reaching its full potential.

Key players in the market:
Some of the key players in Natural Vitamin-E Market include Adama Agricultural Solutions Ltd., Archer Daniels Midland Company, BASF SE, Bayer AG, Beijing Gingko Group, Davos Life Science, DLF Seeds A/S, DSM, DuPont., Eisai Co., Ltd., FenchemBiotek, Hangzhou Gosun Biotech Co. Ltd, Koninklijke DSM N.V., KWS SAAT SE & Co. KGaA, Land O'Lakes, Inc., Merck KGaA, Monsanto Company, Orah Nutrichem, Orochem Technologies Inc., Parchem fine & specialty chemicals, Prinova Group LLC, Rijk Zwaan Zaadteelt en Zaadhandel B.V., RIKEN VITAMIN Co., Ltd., Sakata Seed America., Southwest Synthetic Pharmaceuticals Corp Ltd., Syngenta Crop Protection AG, TAKII & CO.,LTD., The Bountiful Company, Vance Group, VILMORIN & CIE, Wilmar International Limited and Zhejiang Worldbestve Biotechnology Co., Ltd.
Key Developments:
In December 2021, Kensing announced cooperation with Azelis to improve and expand the distribution of vegetable oils, vitamins, and personal care goods throughout Europe, the Middle East, and Africa. In the B2B market, Azelis has a significant distribution network in these locations.
In June 2021, One Rock Capital acquired the specialty chemical facility and other business segments from BASF in Kankakee, Illinois, United States. The firm aims to upgrade the facility and manufacture vegetable oils, natural vitamin E, and other specialty chemicals in the plant.
In June 2021, Prinova developed an e-commerce website to improve ingredient procurement in the United States. Food-grade vitamins and amino acids are available on the internet. The company seeks to supply B2B vitamin distribution solutions worldwide.
In Dec 2019, Koninklijke DSM NV announced a joint venture with Nenter & Co Inc., which includes all of the latter’s products and related assets for vitamin E.
Types Covered:
• Tocopherols
• Tocotrienols
Product Types Covered:
• Naturally-sourced Vitamin E
• Synthetically-sourced Vitamin E
Forms Covered:
• Powder
• Dry probiotic
• Liquid probiotic
• Liquids
Functions Covered:
• Preventive Healthcare
• Therapeutics
Applications Covered:
• Dietary Supplements
• Food and Beverages
• Pet Food and Animal Feed
• Cosmetics
• Other Applications
End users Covered:
• Human Probiotics
• Animal Probiotics
Regions Covered:
• North America
o US
o Canada
o Mexico
• Europe
o Germany
o UK
o Italy
o France
o Spain
o Rest of Europe
• Asia Pacific
o Japan
o China
o India
o Australia
o New Zealand
o South Korea
o Rest of Asia Pacific
• South America
o Argentina
o Brazil
o Chile
o Rest of South America
• Middle East & Africa
o Saudi Arabia
o UAE
o Qatar
o South Africa
o Rest of Middle East & Africa
What our report offers:
- Market share assessments for the regional and country-level segments
- Strategic recommendations for the new entrants
- Covers Market data for the years 2020, 2021, 2022, 2025, and 2028
- Market Trends (Drivers, Constraints, Opportunities, Threats, Challenges, Investment Opportunities, and recommendations)
- Strategic recommendations in key business segments based on the market estimations
- Competitive landscaping mapping the key common trends
- Company profiling with detailed strategies, financials, and recent developments
- Supply chain trends mapping the latest technological advancements
Free Customization Offerings:
All the customers of this report will be entitled to receive one of the following free customization options:
• Company Profiling
o Comprehensive profiling of additional market players (up to 3)
o SWOT Analysis of key players (up to 3)
• Regional Segmentation
o Market estimations, Forecasts and CAGR of any prominent country as per the client's interest (Note: Depends on feasibility check)
• Competitive Benchmarking
Benchmarking of key players based on product portfolio, geographical presence, and strategic alliances
Table of Contents
1 Executive Summary
2 Preface
2.1 Abstract
2.2 Stake Holders
2.3 Research Scope
2.4 Research Methodology
2.4.1 Data Mining
2.4.2 Data Analysis
2.4.3 Data Validation
2.4.4 Research Approach
2.5 Research Sources
2.5.1 Primary Research Sources
2.5.2 Secondary Research Sources
2.5.3 Assumptions
3 Market Trend Analysis
3.1 Introduction
3.2 Drivers
3.3 Restraints
3.4 Opportunities
3.5 Threats
3.6 Product Analysis
3.7 Application Analysis
3.8 End User Analysis
3.9 Emerging Markets
3.10 Impact of Covid-19
4 Porters Five Force Analysis
4.1 Bargaining power of suppliers
4.2 Bargaining power of buyers
4.3 Threat of substitutes
4.4 Threat of new entrants
4.5 Competitive rivalry
5 Global Natural vitamin-E Market, By Type
5.1 Introduction
5.2 Tocopherols
5.3 Tocotrienols
6 Global Natural vitamin-E Market, By Product Type
6.1 Introduction
6.2 Naturally-sourced Vitamin E
6.3 Synthetically-sourced Vitamin E
7 Global Natural vitamin-E Market, By Form
7.1 Introduction
7.2 Powder
7.3 Dry probiotic
7.4 Liquid probiotic
7.5 Liquids
8 Global Natural vitamin-E Market, By Function
8.1 Introduction
8.2 Preventive Healthcare
8.3 Therapeutics
9 Global Natural vitamin-E Market, By Application
9.1 Introduction
9.2 Dietary Supplements
9.3 Food and Beverages
9.4 Pet Food and Animal Feed
9.5 Cosmetics
9.6 Other Applications
10 Global Natural vitamin-E Market, By End User
10.1 Introduction
10.2 Human Probiotics
10.3 Animal Probiotics
11 Global Natural vitamin-E Market, By Geography
11.1 Introduction
11.2 North America
11.2.1 US
11.2.2 Canada
11.2.3 Mexico
11.3 Europe
11.3.1 Germany
11.3.2 UK
11.3.3 Italy
11.3.4 France
11.3.5 Spain
11.3.6 Rest of Europe
11.4 Asia Pacific
11.4.1 Japan
11.4.2 China
11.4.3 India
11.4.4 Australia
11.4.5 New Zealand
11.4.6 South Korea
11.4.7 Rest of Asia Pacific
11.5 South America
11.5.1 Argentina
11.5.2 Brazil
11.5.3 Chile
11.5.4 Rest of South America
11.6 Middle East & Africa
11.6.1 Saudi Arabia
11.6.2 UAE
11.6.3 Qatar
11.6.4 South Africa
11.6.5 Rest of Middle East & Africa
12 Key Developments
12.1 Agreements, Partnerships, Collaborations and Joint Ventures
12.2 Acquisitions & Mergers
12.3 New Product Launch
12.4 Expansions
12.5 Other Key Strategies
13 Company Profiling
13.1 Adama Agricultural Solutions Ltd.
13.2 Archer Daniels Midland Company
13.3 BASF SE
13.4 Bayer AG
13.5 Beijing Gingko Group
13.6 Davos Life Science
13.7 DLF Seeds A/S
13.8 DSM
13.9 DuPont.
13.10 Eisai Co., Ltd.
13.11 FenchemBiotek
13.12 Hangzhou Gosun Biotech Co. Ltd
13.13 Koninklijke DSM N.V.
13.14 KWS SAAT SE & Co. KGaA
13.15 Land O'Lakes, Inc.
13.16 Merck KGaA
13.17 Monsanto Company
13.18 Orah Nutrichem
13.19 Orochem Technologies Inc.
13.20 Parchem fine & specialty chemicals
13.21 Prinova Group LLC
13.22 Rijk Zwaan Zaadteelt en Zaadhandel B.V.
13.23 RIKEN VITAMIN Co., Ltd.
13.24 Sakata Seed America.
13.25 Southwest Synthetic Pharmaceuticals Corp Ltd.
13.26 Syngenta Crop Protection AG
13.27 TAKII & CO.,LTD.
13.28 The Bountiful Company
13.29 Vance Group
13.30 VILMORIN & CIE
13.31 Wilmar International Limited
13.32 Zhejiang Worldbestve Biotechnology Co., Ltd.
List of Tables
1 Global Natural vitamin-E Market Outlook, By Region (2020-2028) ($MN)
2 Global Natural vitamin-E Market Outlook, By Type (2020-2028) ($MN)
3 Global Natural vitamin-E Market Outlook, By Tocopherols (2020-2028) ($MN)
4 Global Natural vitamin-E Market Outlook, By Tocotrienols (2020-2028) ($MN)
5 Global Natural vitamin-E Market Outlook, By Product Type (2020-2028) ($MN)
6 Global Natural vitamin-E Market Outlook, By Naturally-sourced Vitamin E (2020-2028) ($MN)
7 Global Natural vitamin-E Market Outlook, By Synthetically-sourced Vitamin E (2020-2028) ($MN)
8 Global Natural vitamin-E Market Outlook, By Form (2020-2028) ($MN)
9 Global Natural vitamin-E Market Outlook, By Powder (2020-2028) ($MN)
10 Global Natural vitamin-E Market Outlook, By Dry probiotic (2020-2028) ($MN)
11 Global Natural vitamin-E Market Outlook, By Liquid probiotic (2020-2028) ($MN)
12 Global Natural vitamin-E Market Outlook, By Liquids (2020-2028) ($MN)
13 Global Natural vitamin-E Market Outlook, By Function (2020-2028) ($MN)
14 Global Natural vitamin-E Market Outlook, By Preventive Healthcare (2020-2028) ($MN)
15 Global Natural vitamin-E Market Outlook, By Therapeutics (2020-2028) ($MN)
16 Global Natural vitamin-E Market Outlook, By Application (2020-2028) ($MN)
17 Global Natural vitamin-E Market Outlook, By Dietary Supplements (2020-2028) ($MN)
18 Global Natural vitamin-E Market Outlook, By Food and Beverages (2020-2028) ($MN)
19 Global Natural vitamin-E Market Outlook, By Pet Food and Animal Feed (2020-2028) ($MN)
20 Global Natural vitamin-E Market Outlook, By Cosmetics (2020-2028) ($MN)
21 Global Natural vitamin-E Market Outlook, By Other Applications (2020-2028) ($MN)
22 Global Natural vitamin-E Market Outlook, By End User (2020-2028) ($MN)
23 Global Natural vitamin-E Market Outlook, By Human Probiotics (2020-2028) ($MN)
24 Global Natural vitamin-E Market Outlook, By Animal Probiotics (2020-2028) ($MN)
25 North America Natural vitamin-E Market Outlook, By Country (2020-2028) ($MN)
26 North America Natural vitamin-E Market Outlook, By Type (2020-2028) ($MN)
27 North America Natural vitamin-E Market Outlook, By Tocopherols (2020-2028) ($MN)
28 North America Natural vitamin-E Market Outlook, By Tocotrienols (2020-2028) ($MN)
29 North America Natural vitamin-E Market Outlook, By Product Type (2020-2028) ($MN)
30 North America Natural vitamin-E Market Outlook, By Naturally-sourced Vitamin E (2020-2028) ($MN)
31 North America Natural vitamin-E Market Outlook, By Synthetically-sourced Vitamin E (2020-2028) ($MN)
32 North America Natural vitamin-E Market Outlook, By Form (2020-2028) ($MN)
33 North America Natural vitamin-E Market Outlook, By Powder (2020-2028) ($MN)
34 North America Natural vitamin-E Market Outlook, By Dry probiotic (2020-2028) ($MN)
35 North America Natural vitamin-E Market Outlook, By Liquid probiotic (2020-2028) ($MN)
36 North America Natural vitamin-E Market Outlook, By Liquids (2020-2028) ($MN)
37 North America Natural vitamin-E Market Outlook, By Function (2020-2028) ($MN)
38 North America Natural vitamin-E Market Outlook, By Preventive Healthcare (2020-2028) ($MN)
39 North America Natural vitamin-E Market Outlook, By Therapeutics (2020-2028) ($MN)
40 North America Natural vitamin-E Market Outlook, By Application (2020-2028) ($MN)
41 North America Natural vitamin-E Market Outlook, By Dietary Supplements (2020-2028) ($MN)
42 North America Natural vitamin-E Market Outlook, By Food and Beverages (2020-2028) ($MN)
43 North America Natural vitamin-E Market Outlook, By Pet Food and Animal Feed (2020-2028) ($MN)
44 North America Natural vitamin-E Market Outlook, By Cosmetics (2020-2028) ($MN)
45 North America Natural vitamin-E Market Outlook, By Other Applications (2020-2028) ($MN)
46 North America Natural vitamin-E Market Outlook, By End User (2020-2028) ($MN)
47 North America Natural vitamin-E Market Outlook, By Human Probiotics (2020-2028) ($MN)
48 North America Natural vitamin-E Market Outlook, By Animal Probiotics (2020-2028) ($MN)
49 Europe Natural vitamin-E Market Outlook, By Country (2020-2028) ($MN)
50 Europe Natural vitamin-E Market Outlook, By Type (2020-2028) ($MN)
51 Europe Natural vitamin-E Market Outlook, By Tocopherols (2020-2028) ($MN)
52 Europe Natural vitamin-E Market Outlook, By Tocotrienols (2020-2028) ($MN)
53 Europe Natural vitamin-E Market Outlook, By Product Type (2020-2028) ($MN)
54 Europe Natural vitamin-E Market Outlook, By Naturally-sourced Vitamin E (2020-2028) ($MN)
55 Europe Natural vitamin-E Market Outlook, By Synthetically-sourced Vitamin E (2020-2028) ($MN)
56 Europe Natural vitamin-E Market Outlook, By Form (2020-2028) ($MN)
57 Europe Natural vitamin-E Market Outlook, By Powder (2020-2028) ($MN)
58 Europe Natural vitamin-E Market Outlook, By Dry probiotic (2020-2028) ($MN)
59 Europe Natural vitamin-E Market Outlook, By Liquid probiotic (2020-2028) ($MN)
60 Europe Natural vitamin-E Market Outlook, By Liquids (2020-2028) ($MN)
61 Europe Natural vitamin-E Market Outlook, By Function (2020-2028) ($MN)
62 Europe Natural vitamin-E Market Outlook, By Preventive Healthcare (2020-2028) ($MN)
63 Europe Natural vitamin-E Market Outlook, By Therapeutics (2020-2028) ($MN)
64 Europe Natural vitamin-E Market Outlook, By Application (2020-2028) ($MN)
65 Europe Natural vitamin-E Market Outlook, By Dietary Supplements (2020-2028) ($MN)
66 Europe Natural vitamin-E Market Outlook, By Food and Beverages (2020-2028) ($MN)
67 Europe Natural vitamin-E Market Outlook, By Pet Food and Animal Feed (2020-2028) ($MN)
68 Europe Natural vitamin-E Market Outlook, By Cosmetics (2020-2028) ($MN)
69 Europe Natural vitamin-E Market Outlook, By Other Applications (2020-2028) ($MN)
70 Europe Natural vitamin-E Market Outlook, By End User (2020-2028) ($MN)
71 Europe Natural vitamin-E Market Outlook, By Human Probiotics (2020-2028) ($MN)
72 Europe Natural vitamin-E Market Outlook, By Animal Probiotics (2020-2028) ($MN)
73 Asia Pacific Natural vitamin-E Market Outlook, By Country (2020-2028) ($MN)
74 Asia Pacific Natural vitamin-E Market Outlook, By Type (2020-2028) ($MN)
75 Asia Pacific Natural vitamin-E Market Outlook, By Tocopherols (2020-2028) ($MN)
76 Asia Pacific Natural vitamin-E Market Outlook, By Tocotrienols (2020-2028) ($MN)
77 Asia Pacific Natural vitamin-E Market Outlook, By Product Type (2020-2028) ($MN)
78 Asia Pacific Natural vitamin-E Market Outlook, By Naturally-sourced Vitamin E (2020-2028) ($MN)
79 Asia Pacific Natural vitamin-E Market Outlook, By Synthetically-sourced Vitamin E (2020-2028) ($MN)
80 Asia Pacific Natural vitamin-E Market Outlook, By Form (2020-2028) ($MN)
81 Asia Pacific Natural vitamin-E Market Outlook, By Powder (2020-2028) ($MN)
82 Asia Pacific Natural vitamin-E Market Outlook, By Dry probiotic (2020-2028) ($MN)
83 Asia Pacific Natural vitamin-E Market Outlook, By Liquid probiotic (2020-2028) ($MN)
84 Asia Pacific Natural vitamin-E Market Outlook, By Liquids (2020-2028) ($MN)
85 Asia Pacific Natural vitamin-E Market Outlook, By Function (2020-2028) ($MN)
86 Asia Pacific Natural vitamin-E Market Outlook, By Preventive Healthcare (2020-2028) ($MN)
87 Asia Pacific Natural vitamin-E Market Outlook, By Therapeutics (2020-2028) ($MN)
88 Asia Pacific Natural vitamin-E Market Outlook, By Application (2020-2028) ($MN)
89 Asia Pacific Natural vitamin-E Market Outlook, By Dietary Supplements (2020-2028) ($MN)
90 Asia Pacific Natural vitamin-E Market Outlook, By Food and Beverages (2020-2028) ($MN)
91 Asia Pacific Natural vitamin-E Market Outlook, By Pet Food and Animal Feed (2020-2028) ($MN)
92 Asia Pacific Natural vitamin-E Market Outlook, By Cosmetics (2020-2028) ($MN)
93 Asia Pacific Natural vitamin-E Market Outlook, By Other Applications (2020-2028) ($MN)
94 Asia Pacific Natural vitamin-E Market Outlook, By End User (2020-2028) ($MN)
95 Asia Pacific Natural vitamin-E Market Outlook, By Human Probiotics (2020-2028) ($MN)
96 Asia Pacific Natural vitamin-E Market Outlook, By Animal Probiotics (2020-2028) ($MN)
97 South America Natural vitamin-E Market Outlook, By Country (2020-2028) ($MN)
98 South America Natural vitamin-E Market Outlook, By Type (2020-2028) ($MN)
99 South America Natural vitamin-E Market Outlook, By Tocopherols (2020-2028) ($MN)
100 South America Natural vitamin-E Market Outlook, By Tocotrienols (2020-2028) ($MN)
101 South America Natural vitamin-E Market Outlook, By Product Type (2020-2028) ($MN)
102 South America Natural vitamin-E Market Outlook, By Naturally-sourced Vitamin E (2020-2028) ($MN)
103 South America Natural vitamin-E Market Outlook, By Synthetically-sourced Vitamin E (2020-2028) ($MN)
104 South America Natural vitamin-E Market Outlook, By Form (2020-2028) ($MN)
105 South America Natural vitamin-E Market Outlook, By Powder (2020-2028) ($MN)
106 South America Natural vitamin-E Market Outlook, By Dry probiotic (2020-2028) ($MN)
107 South America Natural vitamin-E Market Outlook, By Liquid probiotic (2020-2028) ($MN)
108 South America Natural vitamin-E Market Outlook, By Liquids (2020-2028) ($MN)
109 South America Natural vitamin-E Market Outlook, By Function (2020-2028) ($MN)
110 South America Natural vitamin-E Market Outlook, By Preventive Healthcare (2020-2028) ($MN)
111 South America Natural vitamin-E Market Outlook, By Therapeutics (2020-2028) ($MN)
112 South America Natural vitamin-E Market Outlook, By Application (2020-2028) ($MN)
113 South America Natural vitamin-E Market Outlook, By Dietary Supplements (2020-2028) ($MN)
114 South America Natural vitamin-E Market Outlook, By Food and Beverages (2020-2028) ($MN)
115 South America Natural vitamin-E Market Outlook, By Pet Food and Animal Feed (2020-2028) ($MN)
116 South America Natural vitamin-E Market Outlook, By Cosmetics (2020-2028) ($MN)
117 South America Natural vitamin-E Market Outlook, By Other Applications (2020-2028) ($MN)
118 South America Natural vitamin-E Market Outlook, By End User (2020-2028) ($MN)
119 South America Natural vitamin-E Market Outlook, By Human Probiotics (2020-2028) ($MN)
120 South America Natural vitamin-E Market Outlook, By Animal Probiotics (2020-2028) ($MN)
121 Middle East & Africa Natural vitamin-E Market Outlook, By Country (2020-2028) ($MN)
122 Middle East & Africa Natural vitamin-E Market Outlook, By Type (2020-2028) ($MN)
123 Middle East & Africa Natural vitamin-E Market Outlook, By Tocopherols (2020-2028) ($MN)
124 Middle East & Africa Natural vitamin-E Market Outlook, By Tocotrienols (2020-2028) ($MN)
125 Middle East & Africa Natural vitamin-E Market Outlook, By Product Type (2020-2028) ($MN)
126 Middle East & Africa Natural vitamin-E Market Outlook, By Naturally-sourced Vitamin E (2020-2028) ($MN)
127 Middle East & Africa Natural vitamin-E Market Outlook, By Synthetically-sourced Vitamin E (2020-2028) ($MN)
128 Middle East & Africa Natural vitamin-E Market Outlook, By Form (2020-2028) ($MN)
129 Middle East & Africa Natural vitamin-E Market Outlook, By Powder (2020-2028) ($MN)
130 Middle East & Africa Natural vitamin-E Market Outlook, By Dry probiotic (2020-2028) ($MN)
131 Middle East & Africa Natural vitamin-E Market Outlook, By Liquid probiotic (2020-2028) ($MN)
132 Middle East & Africa Natural vitamin-E Market Outlook, By Liquids (2020-2028) ($MN)
133 Middle East & Africa Natural vitamin-E Market Outlook, By Function (2020-2028) ($MN)
134 Middle East & Africa Natural vitamin-E Market Outlook, By Preventive Healthcare (2020-2028) ($MN)
135 Middle East & Africa Natural vitamin-E Market Outlook, By Therapeutics (2020-2028) ($MN)
136 Middle East & Africa Natural vitamin-E Market Outlook, By Application (2020-2028) ($MN)
137 Middle East & Africa Natural vitamin-E Market Outlook, By Dietary Supplements (2020-2028) ($MN)
138 Middle East & Africa Natural vitamin-E Market Outlook, By Food and Beverages (2020-2028) ($MN)
139 Middle East & Africa Natural vitamin-E Market Outlook, By Pet Food and Animal Feed (2020-2028) ($MN)
140 Middle East & Africa Natural vitamin-E Market Outlook, By Cosmetics (2020-2028) ($MN)
141 Middle East & Africa Natural vitamin-E Market Outlook, By Other Applications (2020-2028) ($MN)
142 Middle East & Africa Natural vitamin-E Market Outlook, By End User (2020-2028) ($MN)
143 Middle East & Africa Natural vitamin-E Market Outlook, By Human Probiotics (2020-2028) ($MN)
144 Middle East & Africa Natural vitamin-E Market Outlook, By Animal Probiotics (2020-2028) ($MN)
List of Figures
RESEARCH METHODOLOGY

We at ‘Stratistics’ opt for an extensive research approach which involves data mining, data validation, and data analysis. The various research sources include in-house repository, secondary research, competitor’s sources, social media research, client internal data, and primary research.
Our team of analysts prefers the most reliable and authenticated data sources in order to perform the comprehensive literature search. With access to most of the authenticated data bases our team highly considers the best mix of information through various sources to obtain extensive and accurate analysis.
Each report takes an average time of a month and a team of 4 industry analysts. The time may vary depending on the scope and data availability of the desired market report. The various parameters used in the market assessment are standardized in order to enhance the data accuracy.
Data Mining
The data is collected from several authenticated, reliable, paid and unpaid sources and is filtered depending on the scope & objective of the research. Our reports repository acts as an added advantage in this procedure. Data gathering from the raw material suppliers, distributors and the manufacturers is performed on a regular basis, this helps in the comprehensive understanding of the products value chain. Apart from the above mentioned sources the data is also collected from the industry consultants to ensure the objective of the study is in the right direction.
Market trends such as technological advancements, regulatory affairs, market dynamics (Drivers, Restraints, Opportunities and Challenges) are obtained from scientific journals, market related national & international associations and organizations.
Data Analysis
From the data that is collected depending on the scope & objective of the research the data is subjected for the analysis. The critical steps that we follow for the data analysis include:
- Product Lifecycle Analysis
- Competitor analysis
- Risk analysis
- Porters Analysis
- PESTEL Analysis
- SWOT Analysis
The data engineering is performed by the core industry experts considering both the Marketing Mix Modeling and the Demand Forecasting. The marketing mix modeling makes use of multiple-regression techniques to predict the optimal mix of marketing variables. Regression factor is based on a number of variables and how they relate to an outcome such as sales or profits.
Data Validation
The data validation is performed by the exhaustive primary research from the expert interviews. This includes telephonic interviews, focus groups, face to face interviews, and questionnaires to validate our research from all aspects. The industry experts we approach come from the leading firms, involved in the supply chain ranging from the suppliers, distributors to the manufacturers and consumers so as to ensure an unbiased analysis.
We are in touch with more than 15,000 industry experts with the right mix of consultants, CEO's, presidents, vice presidents, managers, experts from both supply side and demand side, executives and so on.
The data validation involves the primary research from the industry experts belonging to:
- Leading Companies
- Suppliers & Distributors
- Manufacturers
- Consumers
- Industry/Strategic Consultants
Apart from the data validation the primary research also helps in performing the fill gap research, i.e. providing solutions for the unmet needs of the research which helps in enhancing the reports quality.
For more details about research methodology, kindly write to us at info@strategymrc.com
Frequently Asked Questions
In case of any queries regarding this report, you can contact the customer service by filing the “Inquiry Before Buy” form available on the right hand side. You may also contact us through email: info@strategymrc.com or phone: +1-301-202-5929
Yes, the samples are available for all the published reports. You can request them by filling the “Request Sample” option available in this page.
Yes, you can request a sample with your specific requirements. All the customized samples will be provided as per the requirement with the real data masked.
All our reports are available in Digital PDF format. In case if you require them in any other formats, such as PPT, Excel etc you can submit a request through “Inquiry Before Buy” form available on the right hand side. You may also contact us through email: info@strategymrc.com or phone: +1-301-202-5929
We offer a free 15% customization with every purchase. This requirement can be fulfilled for both pre and post sale. You may send your customization requirements through email at info@strategymrc.com or call us on +1-301-202-5929.
We have 3 different licensing options available in electronic format.
- Single User Licence: Allows one person, typically the buyer, to have access to the ordered product. The ordered product cannot be distributed to anyone else.
- 2-5 User Licence: Allows the ordered product to be shared among a maximum of 5 people within your organisation.
- Corporate License: Allows the product to be shared among all employees of your organisation regardless of their geographical location.
All our reports are typically be emailed to you as an attachment.
To order any available report you need to register on our website. The payment can be made either through CCAvenue or PayPal payments gateways which accept all international cards.
We extend our support to 6 months post sale. A post sale customization is also provided to cover your unmet needs in the report.
Request Customization
We offer complimentary customization of up to 15% with every purchase. To share your customization requirements, feel free to email us at info@strategymrc.com or call us on +1-301-202-5929. .
Please Note: Customization within the 15% threshold is entirely free of charge. If your request exceeds this limit, we will conduct a feasibility assessment. Following that, a detailed quote and timeline will be provided.
WHY CHOOSE US ?

Assured Quality
Best in class reports with high standard of research integrity

24X7 Research Support
Continuous support to ensure the best customer experience.

Free Customization
Adding more values to your product of interest.

Safe & Secure Access
Providing a secured environment for all online transactions.

Trusted by 600+ Brands
Serving the most reputed brands across the world.