
Neighborhood Energy Cooperatives Market
Neighborhood Energy Cooperatives Market Forecasts to 2034 - Global Analysis By Energy Source (Solar Energy, Wind Energy, Biomass Energy, Hydro Energy and Other Renewable Sources), Cooperative Type, Ownership Model, Application and By Geography

|
Years Covered |
2023-2034 |
|
Estimated Year Value (2026) |
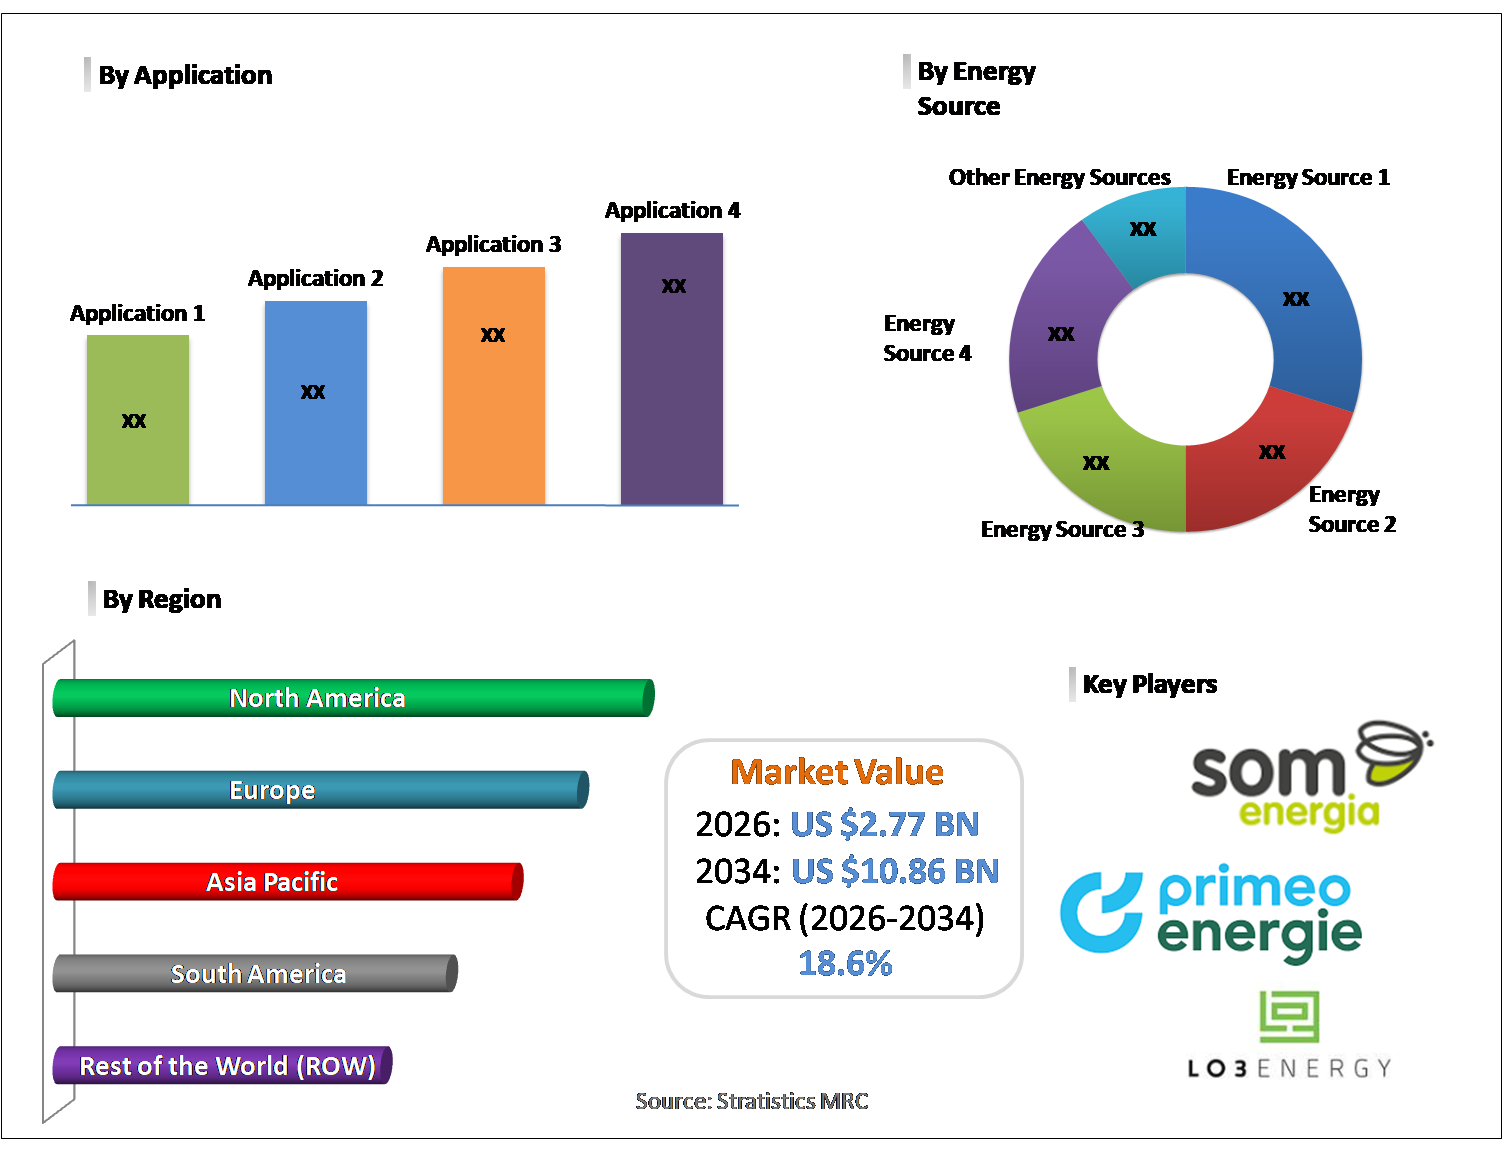
US $2.77 BN |
|
Projected Year Value (2034) |
US $10.86 BN |
|
CAGR (2026-2034) |
18.6% |
|
Regions Covered |
North America, Europe, Asia Pacific, South America, and Rest of the World (RoW) |
|
Countries Covered |
United States, Canada, Mexico, United Kingdom, Germany, France, Italy, Spain, Netherlands, Belgium, Sweden, Switzerland, Poland, Rest of Europe, China, Japan, India, South Korea, Australia, Indonesia, Thailand, Malaysia, Singapore, Vietnam, Rest of Asia Pacific, Brazil, Argentina, Colombia, Chile, Peru, Rest of South America, Saudi Arabia, United Arab Emirates, Qatar, Israel, Rest of Middle East, South Africa, Egypt, Morocco, and Rest of Africa. |
|
Largest Market |
Europe |
|
Highest Growing Market |
Asia Pacific |
According to Stratistics MRC, the Global Neighborhood Energy Cooperatives Market is accounted for $2.77 billion in 2026 and is expected to reach $10.86 billion by 2034 growing at a CAGR of 18.6% during the forecast period. Neighborhood Energy Cooperatives are community owned and democratically governed organizations that develop, manage, and distribute energy primarily from renewable sources at the local level. Formed by residents, businesses, or municipalities, these cooperatives enable members to collectively invest in and benefit from decentralized energy generation such as solar, wind, or microgrids. They promote energy independence, cost transparency, and local economic participation while supporting sustainability goals. By combining shared ownership with modern energy management technologies, neighborhood energy cooperatives enhance grid resilience and contribute to the broader transition toward distributed, low carbon energy systems.
Market Dynamics:
Driver:
Growing Shift toward Decentralized and Renewable Energy
The growing shift toward decentralized and renewable energy is a primary driver of the market. Communities and policymakers are increasingly prioritizing locally generated clean power to enhance energy resilience and reduce dependence on centralized utilities. Rising climate commitments and public awareness of sustainability are encouraging cooperative ownership models that support distributed solar, wind, and microgrid projects. This structural transition in energy systems is strengthening the role of neighborhood cooperatives as practical vehicles for achieving low carbon and community centric energy objectives.
Restraint:
Limited Access to Finance and High Upfront Investment
Limited access to finance and high upfront investment requirements remain significant barriers to the expansion of neighborhood energy cooperatives. Establishing community-scale renewable infrastructure involves substantial capital for equipment, grid integration, and project development. Many cooperatives, particularly in emerging markets, face challenges in securing long-term funding or favorable lending terms. The absence of strong financial backing can delay project timelines and restrict scalability. These funding constraints continue to limit broader participation.
Opportunity:
Supportive Policies and Energy Transition Goals
Supportive government policies and ambitious energy transition goals present strong opportunities for the market. Many countries are introducing frameworks that encourage citizen energy participation, distributed generation, and community ownership of renewable assets. Incentives such as feed-in tariffs and grants improve project viability and attract local investors. As governments intensify decarbonization efforts and promote energy democracy, cooperative models are gaining institutional backing. This favorable policy landscape is expected to accelerate new cooperative formations and long term market expansion.
Threat:
Regulatory and Administrative Complexity
Regulatory and administrative complexity poses a notable threat to neighborhood energy cooperatives. Navigating licensing requirements, grid interconnection rules, and evolving energy regulations can be burdensome for community led organizations with limited technical expertise. In many regions, legacy regulatory frameworks still favor centralized utilities, creating procedural delays and compliance costs for cooperative projects. Uncertainty around policy consistency and approval timelines may discourage new entrants. Without streamlined regulatory pathways, these complexities could slow market penetration.
Covid-19 Impact:
The COVID-19 pandemic had a mixed impact on the Neighborhood Energy Cooperatives market. Initial disruptions in supply chains, project financing, and community mobilization delayed several cooperative energy projects. However, the crisis also heightened awareness of local energy resilience and self-sufficiency, strengthening long-term interest in decentralized energy models. Governments incorporated green recovery measures that indirectly benefited community energy initiatives. As economic activity normalized, positioning the market for sustained post-pandemic growth supported by resilience-focused energy planning.
The hybrid cooperatives segment is expected to be the largest during the forecast period
The hybrid cooperatives segment is expected to account for the largest market share during the forecast period, due to its ability to combine multiple energy sources and ownership structures within a single community framework. Hybrid models improve reliability by integrating solar, wind, storage, and grid connectivity, making them attractive for diverse neighborhoods. They also offer greater financial flexibility and risk diversification compared to single-source cooperatives. This operational versatility and improved energy security are driving widespread adoption of hybrid cooperative structures globally.
The wind energy segment is expected to have the highest CAGR during the forecast period
Over the forecast period, the wind energy segment is predicted to witness the highest growth rate, due to increasing deployment of community-scale wind projects and improving turbine economics. Wind cooperatives offer strong generation capacity and attractive long-term returns in suitable geographic locations. Advances in small and mid scale wind technologies are making projects more accessible to local communities. Additionally, supportive renewable policies and rising demand for clean baseload alternatives are accelerating investment in cooperative wind energy initiatives across both developed and emerging markets.
Region with largest share:
During the forecast period, the Europe region is expected to hold the largest market share, due to its mature cooperative movement, strong renewable energy policies, and widespread public participation in community energy projects. The region benefits from supportive regulatory frameworks, established grid infrastructure, and a high concentration of citizen energy communities. Countries such as Germany, Denmark, and the Netherlands have long traditions of cooperative ownership. This institutional maturity and policy backing position Europe as the dominant regional market for neighborhood energy cooperatives.
Region with highest CAGR:
Over the forecast period, the Asia Pacific region is anticipated to exhibit the highest CAGR, owing to rapid urbanization, rising electricity demand, and increasing government focus on decentralized renewable energy. Countries such as India, China, Japan, and Australia are promoting community energy models to improve energy access and sustainability. Expanding rural electrification programs and growing awareness of local energy resilience further support market growth. As digital energy management and distributed generation adoption accelerate, Asia Pacific is poised to become the fastest-growing regional market.

Key players in the market
Some of the key players in Neighborhood Energy Cooperatives Market include Power Ledger, LO3 Energy, Brooklyn Microgrid, Sonnen, Piclo, Electron, WePower, Enercoop, Energy4All, Baywind Energy Co‑operative, Brighton Energy Co‑operative, Primeo Energie, Som Energia, Touchstone Energy, and Next Kraftwerke.
Key Developments:
In November 2025, Entech and Primeo Energie have partnered to develop over 100 MW of battery energy storage projects by 2029 across France and broader European markets. The collaboration aims to accelerate grid flexibility, support renewable integration, and strengthen large-scale energy storage deployment in the region.
In June 2021, Eureden and Primeo Energie have signed a renewable electricity power purchase agreement (PPA) in France, enabling the supply of green power generated from two hydroelectric plants. The agreement supports Eureden’s decarbonization strategy while strengthening Primeo Energie’s role in delivering traceable, long-term renewable energy solutions to industrial consumers.
Energy Sources Covered:
• Solar Energy
• Wind Energy
• Biomass Energy
• Hydro Energy
• Other Renewable Sources
Cooperative Types Covered:
• Generation Cooperatives
• Distribution Cooperatives
• Hybrid Cooperatives
Ownership Models Covered:
• Member-Owned
• Community-Owned
• Public-Private Partnerships
Applications Covered:
• Residential
• Commercial
• Industrial
• Municipal/Institutional
Regions Covered:
• North America
o United States
o Canada
o Mexico
• Europe
o United Kingdom
o Germany
o France
o Italy
o Spain
o Netherlands
o Belgium
o Sweden
o Switzerland
o Poland
o Rest of Europe
• Asia Pacific
o China
o Japan
o India
o South Korea
o Australia
o Indonesia
o Thailand
o Malaysia
o Singapore
o Vietnam
o Rest of Asia Pacific
• South America
o Brazil
o Argentina
o Colombia
o Chile
o Peru
o Rest of South America
• Rest of the World (RoW)
o Middle East
§ Saudi Arabia
§ United Arab Emirates
§ Qatar
§ Israel
§ Rest of Middle East
o Africa
§ South Africa
§ Egypt
§ Morocco
§ Rest of Africa
What our report offers:
- Market share assessments for the regional and country-level segments
- Strategic recommendations for the new entrants
- Covers Market data for the years 2023, 2024, 2025, 2026, 2027, 2028, 2030, 2032 and 2034
- Market Trends (Drivers, Constraints, Opportunities, Threats, Challenges, Investment Opportunities, and recommendations)
- Strategic recommendations in key business segments based on the market estimations
- Competitive landscaping mapping the key common trends
- Company profiling with detailed strategies, financials, and recent developments
- Supply chain trends mapping the latest technological advancements
Free Customization Offerings:
All the customers of this report will be entitled to receive one of the following free customization options:
• Company Profiling
o Comprehensive profiling of additional market players (up to 3)
o SWOT Analysis of key players (up to 3)
• Regional Segmentation
o Market estimations, Forecasts and CAGR of any prominent country as per the client's interest (Note: Depends on feasibility check)
• Competitive Benchmarking
o Benchmarking of key players based on product portfolio, geographical presence, and strategic alliances
Table of Contents
1 Executive Summary
1.1 Market Snapshot and Key Highlights
1.2 Growth Drivers, Challenges, and Opportunities
1.3 Competitive Landscape Overview
1.4 Strategic Insights and Recommendations
2 Research Framework
2.1 Study Objectives and Scope
2.2 Stakeholder Analysis
2.3 Research Assumptions and Limitations
2.4 Research Methodology
2.4.1 Data Collection (Primary and Secondary)
2.4.2 Data Modeling and Estimation Techniques
2.4.3 Data Validation and Triangulation
2.4.4 Analytical and Forecasting Approach
3 Market Dynamics and Trend Analysis
3.1 Market Definition and Structure
3.2 Key Market Drivers
3.3 Market Restraints and Challenges
3.4 Growth Opportunities and Investment Hotspots
3.5 Industry Threats and Risk Assessment
3.6 Technology and Innovation Landscape
3.7 Emerging and High-Growth Markets
3.8 Regulatory and Policy Environment
3.9 Impact of COVID-19 and Recovery Outlook
4 Competitive and Strategic Assessment
4.1 Porter's Five Forces Analysis
4.1.1 Supplier Bargaining Power
4.1.2 Buyer Bargaining Power
4.1.3 Threat of Substitutes
4.1.4 Threat of New Entrants
4.1.5 Competitive Rivalry
4.2 Market Share Analysis of Key Players
4.3 Product Benchmarking and Performance Comparison
5 Global Neighborhood Energy Cooperatives Market, By Energy Source
5.1 Solar Energy
5.2 Wind Energy
5.3 Biomass Energy
5.4 Hydro Energy
5.5 Other Renewable Sources
6 Global Neighborhood Energy Cooperatives Market, By Cooperative Type
6.1 Generation Cooperatives
6.2 Distribution Cooperatives
6.3 Hybrid Cooperatives
7 Global Neighborhood Energy Cooperatives Market, By Ownership Model
7.1 Member-Owned
7.2 Community-Owned
7.3 Public-Private Partnerships
8 Global Neighborhood Energy Cooperatives Market, By Application
8.1 Residential
8.2 Commercial
8.3 Industrial
8.4 Municipal/Institutional
9 Global Neighborhood Energy Cooperatives Market, By Geography
9.1 North America
9.1.1 United States
9.1.2 Canada
9.1.3 Mexico
9.2 Europe
9.2.1 United Kingdom
9.2.2 Germany
9.2.3 France
9.2.4 Italy
9.2.5 Spain
9.2.6 Netherlands
9.2.7 Belgium
9.2.8 Sweden
9.2.9 Switzerland
9.2.10 Poland
9.2.11 Rest of Europe
9.3 Asia Pacific
9.3.1 China
9.3.2 Japan
9.3.3 India
9.3.4 South Korea
9.3.5 Australia
9.3.6 Indonesia
9.3.7 Thailand
9.3.8 Malaysia
9.3.9 Singapore
9.3.10 Vietnam
9.3.11 Rest of Asia Pacific
9.4 South America
9.4.1 Brazil
9.4.2 Argentina
9.4.3 Colombia
9.4.4 Chile
9.4.5 Peru
9.4.6 Rest of South America
9.5 Rest of the World (RoW)
9.5.1 Middle East
9.5.1.1 Saudi Arabia
9.5.1.2 United Arab Emirates
9.5.1.3 Qatar
9.5.1.4 Israel
9.5.1.5 Rest of Middle East
9.5.2 Africa
9.5.2.1 South Africa
9.5.2.2 Egypt
9.5.2.3 Morocco
9.5.2.4 Rest of Africa
10 Strategic Market Intelligence
10.1 Industry Value Network and Supply Chain Assessment
10.2 White-Space and Opportunity Mapping
10.3 Product Evolution and Market Life Cycle Analysis
10.4 Channel, Distributor, and Go-to-Market Assessment
11 Industry Developments and Strategic Initiatives
11.1 Mergers and Acquisitions
11.2 Partnerships, Alliances, and Joint Ventures
11.3 New Product Launches and Certifications
11.4 Capacity Expansion and Investments
11.5 Other Strategic Initiatives
12 Company Profiles
12.1 Power Ledger
12.2 LO3 Energy
12.3 Brooklyn Microgrid
12.4 Sonnen
12.5 Piclo
12.6 Electron
12.7 WePower
12.8 Enercoop
12.9 Energy4All
12.10 Baywind Energy Co operative
12.11 Brighton Energy Co operative
12.12 Primeo Energie
12.13 Som Energia
12.14 Touchstone Energy
12.15 Next Kraftwerke
List of Tables
1 Global Neighborhood Energy Cooperatives Market Outlook, By Region (2023-2034) ($MN)
2 Global Neighborhood Energy Cooperatives Market Outlook, By Energy Source (2023-2034) ($MN)
3 Global Neighborhood Energy Cooperatives Market Outlook, By Solar Energy (2023-2034) ($MN)
4 Global Neighborhood Energy Cooperatives Market Outlook, By Wind Energy (2023-2034) ($MN)
5 Global Neighborhood Energy Cooperatives Market Outlook, By Biomass Energy (2023-2034) ($MN)
6 Global Neighborhood Energy Cooperatives Market Outlook, By Hydro Energy (2023-2034) ($MN)
7 Global Neighborhood Energy Cooperatives Market Outlook, By Other Renewable Sources (2023-2034) ($MN)
8 Global Neighborhood Energy Cooperatives Market Outlook, By Cooperative Type (2023-2034) ($MN)
9 Global Neighborhood Energy Cooperatives Market Outlook, By Generation Cooperatives (2023-2034) ($MN)
10 Global Neighborhood Energy Cooperatives Market Outlook, By Distribution Cooperatives (2023-2034) ($MN)
11 Global Neighborhood Energy Cooperatives Market Outlook, By Hybrid Cooperatives (2023-2034) ($MN)
12 Global Neighborhood Energy Cooperatives Market Outlook, By Ownership Model (2023-2034) ($MN)
13 Global Neighborhood Energy Cooperatives Market Outlook, By Member-Owned (2023-2034) ($MN)
14 Global Neighborhood Energy Cooperatives Market Outlook, By Community-Owned (2023-2034) ($MN)
15 Global Neighborhood Energy Cooperatives Market Outlook, By Public-Private Partnerships (2023-2034) ($MN)
16 Global Neighborhood Energy Cooperatives Market Outlook, By Application (2023-2034) ($MN)
17 Global Neighborhood Energy Cooperatives Market Outlook, By Residential (2023-2034) ($MN)
18 Global Neighborhood Energy Cooperatives Market Outlook, By Commercial (2023-2034) ($MN)
19 Global Neighborhood Energy Cooperatives Market Outlook, By Industrial (2023-2034) ($MN)
20 Global Neighborhood Energy Cooperatives Market Outlook, By Municipal/Institutional (2023-2034) ($MN)
Note: Tables for North America, Europe, APAC, South America, and Rest of the World (RoW) Regions are also represented in the same manner as above.
List of Figures
RESEARCH METHODOLOGY

We at ‘Stratistics’ opt for an extensive research approach which involves data mining, data validation, and data analysis. The various research sources include in-house repository, secondary research, competitor’s sources, social media research, client internal data, and primary research.
Our team of analysts prefers the most reliable and authenticated data sources in order to perform the comprehensive literature search. With access to most of the authenticated data bases our team highly considers the best mix of information through various sources to obtain extensive and accurate analysis.
Each report takes an average time of a month and a team of 4 industry analysts. The time may vary depending on the scope and data availability of the desired market report. The various parameters used in the market assessment are standardized in order to enhance the data accuracy.
Data Mining
The data is collected from several authenticated, reliable, paid and unpaid sources and is filtered depending on the scope & objective of the research. Our reports repository acts as an added advantage in this procedure. Data gathering from the raw material suppliers, distributors and the manufacturers is performed on a regular basis, this helps in the comprehensive understanding of the products value chain. Apart from the above mentioned sources the data is also collected from the industry consultants to ensure the objective of the study is in the right direction.
Market trends such as technological advancements, regulatory affairs, market dynamics (Drivers, Restraints, Opportunities and Challenges) are obtained from scientific journals, market related national & international associations and organizations.
Data Analysis
From the data that is collected depending on the scope & objective of the research the data is subjected for the analysis. The critical steps that we follow for the data analysis include:
- Product Lifecycle Analysis
- Competitor analysis
- Risk analysis
- Porters Analysis
- PESTEL Analysis
- SWOT Analysis
The data engineering is performed by the core industry experts considering both the Marketing Mix Modeling and the Demand Forecasting. The marketing mix modeling makes use of multiple-regression techniques to predict the optimal mix of marketing variables. Regression factor is based on a number of variables and how they relate to an outcome such as sales or profits.
Data Validation
The data validation is performed by the exhaustive primary research from the expert interviews. This includes telephonic interviews, focus groups, face to face interviews, and questionnaires to validate our research from all aspects. The industry experts we approach come from the leading firms, involved in the supply chain ranging from the suppliers, distributors to the manufacturers and consumers so as to ensure an unbiased analysis.
We are in touch with more than 15,000 industry experts with the right mix of consultants, CEO's, presidents, vice presidents, managers, experts from both supply side and demand side, executives and so on.
The data validation involves the primary research from the industry experts belonging to:
- Leading Companies
- Suppliers & Distributors
- Manufacturers
- Consumers
- Industry/Strategic Consultants
Apart from the data validation the primary research also helps in performing the fill gap research, i.e. providing solutions for the unmet needs of the research which helps in enhancing the reports quality.
For more details about research methodology, kindly write to us at info@strategymrc.com
Frequently Asked Questions
In case of any queries regarding this report, you can contact the customer service by filing the “Inquiry Before Buy” form available on the right hand side. You may also contact us through email: info@strategymrc.com or phone: +1-301-202-5929
Yes, the samples are available for all the published reports. You can request them by filling the “Request Sample” option available in this page.
Yes, you can request a sample with your specific requirements. All the customized samples will be provided as per the requirement with the real data masked.
All our reports are available in Digital PDF format. In case if you require them in any other formats, such as PPT, Excel etc you can submit a request through “Inquiry Before Buy” form available on the right hand side. You may also contact us through email: info@strategymrc.com or phone: +1-301-202-5929
We offer a free 15% customization with every purchase. This requirement can be fulfilled for both pre and post sale. You may send your customization requirements through email at info@strategymrc.com or call us on +1-301-202-5929.
We have 3 different licensing options available in electronic format.
- Single User Licence: Allows one person, typically the buyer, to have access to the ordered product. The ordered product cannot be distributed to anyone else.
- 2-5 User Licence: Allows the ordered product to be shared among a maximum of 5 people within your organisation.
- Corporate License: Allows the product to be shared among all employees of your organisation regardless of their geographical location.
All our reports are typically be emailed to you as an attachment.
To order any available report you need to register on our website. The payment can be made either through CCAvenue or PayPal payments gateways which accept all international cards.
We extend our support to 6 months post sale. A post sale customization is also provided to cover your unmet needs in the report.
Request Customization
We offer complimentary customization of up to 15% with every purchase. To share your customization requirements, feel free to email us at info@strategymrc.com or call us on +1-301-202-5929. .
Please Note: Customization within the 15% threshold is entirely free of charge. If your request exceeds this limit, we will conduct a feasibility assessment. Following that, a detailed quote and timeline will be provided.
WHY CHOOSE US ?

Assured Quality
Best in class reports with high standard of research integrity

24X7 Research Support
Continuous support to ensure the best customer experience.

Free Customization
Adding more values to your product of interest.

Safe & Secure Access
Providing a secured environment for all online transactions.

Trusted by 600+ Brands
Serving the most reputed brands across the world.