
Nitro Infused Beverages Market
Nitro-Infused Beverages Market Forecasts to 2030 - Global Analysis By Product (Nitro Coffee, Nitro Soft Drinks, Nitro Tea and Other Products), Packaging (Cans, Bottles and Draft Dispensing), Distribution Channel and By Geography

|
Years Covered |
2021-2030 |
|
Estimated Year Value (2023) |
US $102.03 MN |
|
Projected Year Value (2030) |
US $355.92 MN |
|
CAGR (2023 - 2030) |
19.5% |
|
Regions Covered |
North America, Europe, Asia Pacific, South America, and Middle East & Africa |
|
Countries Covered |
US, Canada, Mexico, Germany, UK, Italy, France, Spain, Japan, China, India, Australia, New Zealand, South Korea, Rest of Asia Pacific, South America, Argentina, Brazil, Chile, Middle East & Africa, Saudi Arabia, UAE, Qatar, and South Africa |
|
Largest Market |
Asia Pacific |
|
Highest Growing Market |
North America |
According to Stratistics MRC, the Global Nitro-Infused Beverages Market is accounted for $102.03 million in 2023 and is expected to reach $355.92 million by 2030 growing at a CAGR of 19.5% during the forecast period. Drinks that have been injected with nitrogen gas to produce small, effervescent bubbles that improve their flavour and give them a fresher, sweeter aroma are known as nitro-infused drinks. Beer, coffee, tea, and soft drinks are some of the commonly available nitro-infused beverages. A thick, creamy foam head and a rich, silky texture are the results of the nitrogen infusion process. Beverages infused with nitrogen have less acidity than conventional drinks, which reduces the possibility of experiencing gastrointestinal discomfort.
Market Dynamics:
Driver:
Rising demand for healthy and low-sugar drinks
Nitro-infused beverages, often crafted with nitrogen-infusion technology, offer a unique drinking experience characterised by a creamy texture and smooth taste without added sugars. These beverages, typically cold-brew coffee or teas, appeal to health-conscious consumers seeking low-sugar or sugar-free options while enjoying a rich, flavourful drinking experience. This trend aligns with evolving consumer preferences for healthier alternatives, driving the growth of nitro-infused beverages and catering to this rising demand for healthier, low-sugar drink options.
Restraint:
Escalating raw material prices
The nitro-infused beverage market faces restraint due to escalating raw material prices. Essential components like premium coffee beans, specialty teas, and nitrogen gas are witnessing price hikes attributed to various factors, including supply chain disruptions and increased demand. These elevated costs directly impact production expenses, potentially leading to higher manufacturing costs for nitro-infused beverages. As a result, businesses may face challenges in maintaining competitive pricing or sustaining profit margins, hindering market growth.
Opportunity:
Innovative flavours and varieties
Nitro-infused beverages offer a platform for experimentation with various flavours, infusions, and beverage types, ranging from nitrogen-infused cold-brew coffee and teas to fruit-based drinks and even alcoholic beverages. This flexibility allows beverage manufacturers and artisans to cater to a wide range of consumer tastes and preferences, encouraging the development of new and exciting flavours. Furthermore, the ability to offer creative, enticing, and unusual flavours in nitro-infused beverages becomes a distinct opportunity to captivate consumers and expand market share within the constantly changing beverage industry.
Threat:
Environmental concerns
Environmental concerns pose a threat to the nitro-infused beverage market due to potential sustainability issues related to packaging, production methods, and waste generation. Nitrogen gas, a key component in nitrogen-infused beverages, may contribute to environmental impacts if not handled responsibly. Also, the packaging materials used for these beverages, if not eco-friendly, could raise concerns about their disposal and environmental footprint. Thereby, it will hamper market growth.
Covid-19 Impact
The COVID-19 pandemic had mixed effects on the nitro-infused beverage market. Initially, lockdowns and restrictions on the hospitality and food service sectors led to a downturn as cafes, restaurants, and specialty beverage outlets faced closures or reduced foot traffic. However, the rise in at-home consumption and the shift towards convenient, ready-to-drink options provided opportunities for canned or bottled nitro-infused beverages. Overall, the market adapted to changing consumption habits, witnessing shifts in distribution channels and product formats due to pandemic-induced consumer behaviour changes.
The nitrosoft drinks segment is expected to be the largest during the forecast period
The nitrosoft drinks segment is estimated to hold the largest share. Nitrosoft drinks involve the infusion of nitrogen gas into non-alcoholic carbonated beverages like sodas or flavoured drinks. This process involves pressurising the drink with nitrogen, imparting a smooth and creamy texture with fine bubbles upon pouring. Nitro Soft Drinks offer a unique sensory experience, enhancing the beverage's mouthfeel and flavour profile. The nitrogen infusion creates a velvety texture and enhances the drink's overall creaminess, elevating its appeal among consumers seeking innovative and enjoyable soft drink options with a distinctive visual and taste experience.
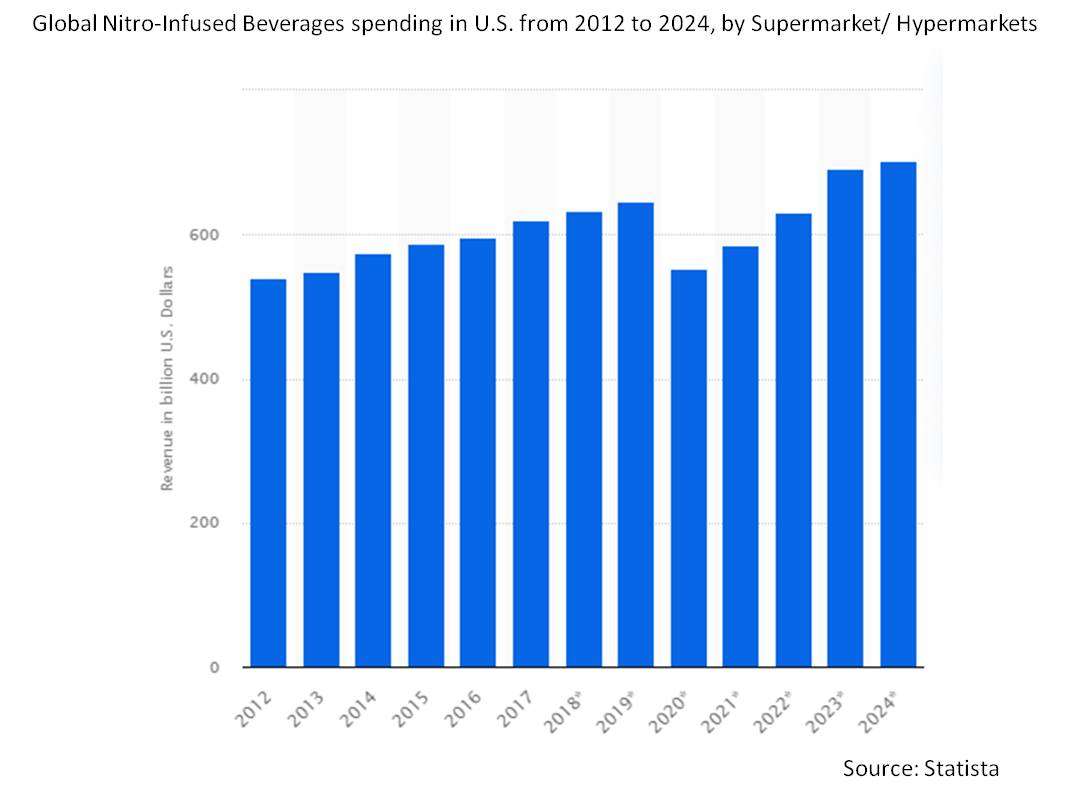
The supermarket/ hypermarkets segment is expected to have the highest CAGR during the forecast period
The supermarket/ hypermarkets segment is anticipated to have lucrative growth during the forecast period. Supermarkets and hypermarkets serve as crucial channels for consumers to access a diverse range of nitro-infused beverages, including canned or bottled options such as nitro coffee, teas, soft drinks, and other specialty beverages. These retail environments offer convenience and variety, enabling customers to explore and purchase nitro-infused drinks alongside other beverage choices. The presence of nitro-infused beverages on supermarket and hypermarket shelves enhances accessibility and exposure, capturing consumer interest and catering to evolving preferences for innovative and premium beverage options.
Region with largest share:
Asia Pacific commanded the largest market share during the extrapolated period due to evolving consumer tastes and increasing demand for innovative drink experiences. Countries like China, Japan, and South Korea witness a rising trend in specialty coffee consumption, propelling the popularity of nitro coffee and other nitrogen-infused beverages. Moreover, urbanisation and a burgeoning café culture in major cities fuel the market's expansion. This region's dynamic beverage landscape, coupled with a growing preference for premium and experiential drinks, positions Asia-Pacific as a promising hub for the nitro-infused beverage market's growth.
Region with highest CAGR:
North America is expected to witness profitable growth over the projection period, a sophisticated beverage culture and a strong inclination towards premium and innovative drink options. The presence of established cafe chains and the rapid expansion of retail outlets catering to specialty beverages enhance accessibility and consumer interest. North America's penchant for unique, high-quality drinks solidifies its position as a thriving hub for the nitro-infused beverage market.

Key players in the market
Some of the key players in the Nitro-Infused Beverages Market include Rise Brewing Co., Lucky Jack, Starbucks Corporation, Califia Farms, Left Hand Brewing Co., Caveman Coffee Co., Monster Energy Company, Quivr, PepsiCo, Bona Fide Nitro Coffee and Tea, Funkin Cocktails, Nitro Beverage Co., Beanly Beverages Private Limited, Cruise Beverages, East Forged, H&H Products Company, La Colombe Coffee Roasters, King's Row Coffee and Lucky Jack Cold Brew Coffee.
Key Developments:
In November 2023, Starbucks Coffee Company announced its long-term growth strategy, Triple Shot Reinvention with Two Pumps, to elevate the brand, strengthen and scale digital, further expand globally, identify opportunities within and outside the store for efficiencies, and reinvigorate the partner (employee) culture.
In September 2021, RISE Brewing Co., the organic nitro cold brew and oat milk company, announced their latest collaboration with a newly launched New York-based Thai Iced Tea and Coffee company, Emshika’s. The collaboration products include the Emshika’s x RISE Brewing Co. Oat Milk Thai Coffee Latte and Thai Tea Latte.
Products Covered:
• Nitro Coffee
• Nitro Soft Drinks
• Nitro Tea
• Other Products
Packagings Covered:
• Cans
• Bottles
• Draft Dispensing
Distribution Channels Covered:
• Supermarket/ Hypermarkets
• Online
• Convenience Stores
• Other Distribution Channels
Regions Covered:
• North America
o US
o Canada
o Mexico
• Europe
o Germany
o UK
o Italy
o France
o Spain
o Rest of Europe
• Asia Pacific
o Japan
o China
o India
o Australia
o New Zealand
o South Korea
o Rest of Asia Pacific
• South America
o Argentina
o Brazil
o Chile
o Rest of South America
• Middle East & Africa
o Saudi Arabia
o UAE
o Qatar
o South Africa
o Rest of Middle East & Africa
What our report offers:
- Market share assessments for the regional and country-level segments
- Strategic recommendations for the new entrants
- Covers Market data for the years 2021, 2022, 2023, 2026, and 2030
- Market Trends (Drivers, Constraints, Opportunities, Threats, Challenges, Investment Opportunities, and recommendations)
- Strategic recommendations in key business segments based on the market estimations
- Competitive landscaping mapping the key common trends
- Company profiling with detailed strategies, financials, and recent developments
- Supply chain trends mapping the latest technological advancements
Free Customization Offerings:
All the customers of this report will be entitled to receive one of the following free customization options:
• Company Profiling
o Comprehensive profiling of additional market players (up to 3)
o SWOT Analysis of key players (up to 3)
• Regional Segmentation
o Market estimations, Forecasts and CAGR of any prominent country as per the client's interest (Note: Depends on feasibility check)
• Competitive Benchmarking
Benchmarking of key players based on product portfolio, geographical presence, and strategic alliances
Table of Contents
1 Executive Summary
2 Preface
2.1 Abstract
2.2 Stake Holders
2.3 Research Scope
2.4 Research Methodology
2.4.1 Data Mining
2.4.2 Data Analysis
2.4.3 Data Validation
2.4.4 Research Approach
2.5 Research Sources
2.5.1 Primary Research Sources
2.5.2 Secondary Research Sources
2.5.3 Assumptions
3 Market Trend Analysis
3.1 Introduction
3.2 Drivers
3.3 Restraints
3.4 Opportunities
3.5 Threats
3.6 Product Analysis
3.7 Emerging Markets
3.8 Impact of Covid-19
4 Porters Five Force Analysis
4.1 Bargaining power of suppliers
4.2 Bargaining power of buyers
4.3 Threat of substitutes
4.4 Threat of new entrants
4.5 Competitive rivalry
5 Global Nitro-Infused Beverages Market, By Product
5.1 Introduction
5.2 Nitro Coffee
5.3 Nitro Soft Drinks
5.4 Nitro Tea
5.5 Other Products
6 Global Nitro-Infused Beverages Market, By Packaging
6.1 Introduction
6.2 Cans
6.3 Bottles
6.4 Draft Dispensing
7 Global Nitro-Infused Beverages Market, By Distribution Channel
7.1 Introduction
7.2 Supermarket/ Hypermarkets
7.3 Online
7.4 Convenience Stores
7.5 Other Distribution Channels
8 Global Nitro-Infused Beverages Market, By Geography
8.1 Introduction
8.2 North America
8.2.1 US
8.2.2 Canada
8.2.3 Mexico
8.3 Europe
8.3.1 Germany
8.3.2 UK
8.3.3 Italy
8.3.4 France
8.3.5 Spain
8.3.6 Rest of Europe
8.4 Asia Pacific
8.4.1 Japan
8.4.2 China
8.4.3 India
8.4.4 Australia
8.4.5 New Zealand
8.4.6 South Korea
8.4.7 Rest of Asia Pacific
8.5 South America
8.5.1 Argentina
8.5.2 Brazil
8.5.3 Chile
8.5.4 Rest of South America
8.6 Middle East & Africa
8.6.1 Saudi Arabia
8.6.2 UAE
8.6.3 Qatar
8.6.4 South Africa
8.6.5 Rest of Middle East & Africa
9 Key Developments
9.1 Agreements, Partnerships, Collaborations and Joint Ventures
9.2 Acquisitions & Mergers
9.3 New Product Launch
9.4 Expansions
9.5 Other Key Strategies
10 Company Profiling
10.1 Rise Brewing Co.
10.2 Lucky Jack
10.3 Starbucks Corporation
10.4 Califia Farms
10.5 Left Hand Brewing Co.
10.6 Caveman Coffee Co.
10.7 Monster Energy Company
10.8 Quivr
10.9 PepsiCo
10.10 Bona Fide Nitro Coffee and Tea
10.11 Funkin Cocktails
10.12 Nitro Beverage Co.
10.13 Beanly Beverages Private Limited
10.14 Cruise Beverages
10.15 East Forged
10.16 H&H Products Company
10.17 La Colombe Coffee Roasters
10.18 King's Row Coffee
10.19 Lucky Jack Cold Brew Coffee
List of Tables
1 Global Nitro-Infused Beverages Market Outlook, By Region (2021-2030) ($MN)
2 Global Nitro-Infused Beverages Market Outlook, By Product (2021-2030) ($MN)
3 Global Nitro-Infused Beverages Market Outlook, By Nitro Coffee (2021-2030) ($MN)
4 Global Nitro-Infused Beverages Market Outlook, By Nitro Soft Drinks (2021-2030) ($MN)
5 Global Nitro-Infused Beverages Market Outlook, By Nitro Tea (2021-2030) ($MN)
6 Global Nitro-Infused Beverages Market Outlook, By Other Products (2021-2030) ($MN)
7 Global Nitro-Infused Beverages Market Outlook, By Packaging (2021-2030) ($MN)
8 Global Nitro-Infused Beverages Market Outlook, By Cans (2021-2030) ($MN)
9 Global Nitro-Infused Beverages Market Outlook, By Bottles (2021-2030) ($MN)
10 Global Nitro-Infused Beverages Market Outlook, By Draft Dispensing (2021-2030) ($MN)
11 Global Nitro-Infused Beverages Market Outlook, By Distribution Channel (2021-2030) ($MN)
12 Global Nitro-Infused Beverages Market Outlook, By Supermarket/ Hypermarkets (2021-2030) ($MN)
13 Global Nitro-Infused Beverages Market Outlook, By Online (2021-2030) ($MN)
14 Global Nitro-Infused Beverages Market Outlook, By Convenience Stores (2021-2030) ($MN)
15 Global Nitro-Infused Beverages Market Outlook, By Other Distribution Channels (2021-2030) ($MN)
16 North America Nitro-Infused Beverages Market Outlook, By Country (2021-2030) ($MN)
17 North America Nitro-Infused Beverages Market Outlook, By Product (2021-2030) ($MN)
18 North America Nitro-Infused Beverages Market Outlook, By Nitro Coffee (2021-2030) ($MN)
19 North America Nitro-Infused Beverages Market Outlook, By Nitro Soft Drinks (2021-2030) ($MN)
20 North America Nitro-Infused Beverages Market Outlook, By Nitro Tea (2021-2030) ($MN)
21 North America Nitro-Infused Beverages Market Outlook, By Other Products (2021-2030) ($MN)
22 North America Nitro-Infused Beverages Market Outlook, By Packaging (2021-2030) ($MN)
23 North America Nitro-Infused Beverages Market Outlook, By Cans (2021-2030) ($MN)
24 North America Nitro-Infused Beverages Market Outlook, By Bottles (2021-2030) ($MN)
25 North America Nitro-Infused Beverages Market Outlook, By Draft Dispensing (2021-2030) ($MN)
26 North America Nitro-Infused Beverages Market Outlook, By Distribution Channel (2021-2030) ($MN)
27 North America Nitro-Infused Beverages Market Outlook, By Supermarket/ Hypermarkets (2021-2030) ($MN)
28 North America Nitro-Infused Beverages Market Outlook, By Online (2021-2030) ($MN)
29 North America Nitro-Infused Beverages Market Outlook, By Convenience Stores (2021-2030) ($MN)
30 North America Nitro-Infused Beverages Market Outlook, By Other Distribution Channels (2021-2030) ($MN)
31 Europe Nitro-Infused Beverages Market Outlook, By Country (2021-2030) ($MN)
32 Europe Nitro-Infused Beverages Market Outlook, By Product (2021-2030) ($MN)
33 Europe Nitro-Infused Beverages Market Outlook, By Nitro Coffee (2021-2030) ($MN)
34 Europe Nitro-Infused Beverages Market Outlook, By Nitro Soft Drinks (2021-2030) ($MN)
35 Europe Nitro-Infused Beverages Market Outlook, By Nitro Tea (2021-2030) ($MN)
36 Europe Nitro-Infused Beverages Market Outlook, By Other Products (2021-2030) ($MN)
37 Europe Nitro-Infused Beverages Market Outlook, By Packaging (2021-2030) ($MN)
38 Europe Nitro-Infused Beverages Market Outlook, By Cans (2021-2030) ($MN)
39 Europe Nitro-Infused Beverages Market Outlook, By Bottles (2021-2030) ($MN)
40 Europe Nitro-Infused Beverages Market Outlook, By Draft Dispensing (2021-2030) ($MN)
41 Europe Nitro-Infused Beverages Market Outlook, By Distribution Channel (2021-2030) ($MN)
42 Europe Nitro-Infused Beverages Market Outlook, By Supermarket/ Hypermarkets (2021-2030) ($MN)
43 Europe Nitro-Infused Beverages Market Outlook, By Online (2021-2030) ($MN)
44 Europe Nitro-Infused Beverages Market Outlook, By Convenience Stores (2021-2030) ($MN)
45 Europe Nitro-Infused Beverages Market Outlook, By Other Distribution Channels (2021-2030) ($MN)
46 Asia Pacific Nitro-Infused Beverages Market Outlook, By Country (2021-2030) ($MN)
47 Asia Pacific Nitro-Infused Beverages Market Outlook, By Product (2021-2030) ($MN)
48 Asia Pacific Nitro-Infused Beverages Market Outlook, By Nitro Coffee (2021-2030) ($MN)
49 Asia Pacific Nitro-Infused Beverages Market Outlook, By Nitro Soft Drinks (2021-2030) ($MN)
50 Asia Pacific Nitro-Infused Beverages Market Outlook, By Nitro Tea (2021-2030) ($MN)
51 Asia Pacific Nitro-Infused Beverages Market Outlook, By Other Products (2021-2030) ($MN)
52 Asia Pacific Nitro-Infused Beverages Market Outlook, By Packaging (2021-2030) ($MN)
53 Asia Pacific Nitro-Infused Beverages Market Outlook, By Cans (2021-2030) ($MN)
54 Asia Pacific Nitro-Infused Beverages Market Outlook, By Bottles (2021-2030) ($MN)
55 Asia Pacific Nitro-Infused Beverages Market Outlook, By Draft Dispensing (2021-2030) ($MN)
56 Asia Pacific Nitro-Infused Beverages Market Outlook, By Distribution Channel (2021-2030) ($MN)
57 Asia Pacific Nitro-Infused Beverages Market Outlook, By Supermarket/ Hypermarkets (2021-2030) ($MN)
58 Asia Pacific Nitro-Infused Beverages Market Outlook, By Online (2021-2030) ($MN)
59 Asia Pacific Nitro-Infused Beverages Market Outlook, By Convenience Stores (2021-2030) ($MN)
60 Asia Pacific Nitro-Infused Beverages Market Outlook, By Other Distribution Channels (2021-2030) ($MN)
61 South America Nitro-Infused Beverages Market Outlook, By Country (2021-2030) ($MN)
62 South America Nitro-Infused Beverages Market Outlook, By Product (2021-2030) ($MN)
63 South America Nitro-Infused Beverages Market Outlook, By Nitro Coffee (2021-2030) ($MN)
64 South America Nitro-Infused Beverages Market Outlook, By Nitro Soft Drinks (2021-2030) ($MN)
65 South America Nitro-Infused Beverages Market Outlook, By Nitro Tea (2021-2030) ($MN)
66 South America Nitro-Infused Beverages Market Outlook, By Other Products (2021-2030) ($MN)
67 South America Nitro-Infused Beverages Market Outlook, By Packaging (2021-2030) ($MN)
68 South America Nitro-Infused Beverages Market Outlook, By Cans (2021-2030) ($MN)
69 South America Nitro-Infused Beverages Market Outlook, By Bottles (2021-2030) ($MN)
70 South America Nitro-Infused Beverages Market Outlook, By Draft Dispensing (2021-2030) ($MN)
71 South America Nitro-Infused Beverages Market Outlook, By Distribution Channel (2021-2030) ($MN)
72 South America Nitro-Infused Beverages Market Outlook, By Supermarket/ Hypermarkets (2021-2030) ($MN)
73 South America Nitro-Infused Beverages Market Outlook, By Online (2021-2030) ($MN)
74 South America Nitro-Infused Beverages Market Outlook, By Convenience Stores (2021-2030) ($MN)
75 South America Nitro-Infused Beverages Market Outlook, By Other Distribution Channels (2021-2030) ($MN)
76 Middle East & Africa Nitro-Infused Beverages Market Outlook, By Country (2021-2030) ($MN)
77 Middle East & Africa Nitro-Infused Beverages Market Outlook, By Product (2021-2030) ($MN)
78 Middle East & Africa Nitro-Infused Beverages Market Outlook, By Nitro Coffee (2021-2030) ($MN)
79 Middle East & Africa Nitro-Infused Beverages Market Outlook, By Nitro Soft Drinks (2021-2030) ($MN)
80 Middle East & Africa Nitro-Infused Beverages Market Outlook, By Nitro Tea (2021-2030) ($MN)
81 Middle East & Africa Nitro-Infused Beverages Market Outlook, By Other Products (2021-2030) ($MN)
82 Middle East & Africa Nitro-Infused Beverages Market Outlook, By Packaging (2021-2030) ($MN)
83 Middle East & Africa Nitro-Infused Beverages Market Outlook, By Cans (2021-2030) ($MN)
84 Middle East & Africa Nitro-Infused Beverages Market Outlook, By Bottles (2021-2030) ($MN)
85 Middle East & Africa Nitro-Infused Beverages Market Outlook, By Draft Dispensing (2021-2030) ($MN)
86 Middle East & Africa Nitro-Infused Beverages Market Outlook, By Distribution Channel (2021-2030) ($MN)
87 Middle East & Africa Nitro-Infused Beverages Market Outlook, By Supermarket/ Hypermarkets (2021-2030) ($MN)
88 Middle East & Africa Nitro-Infused Beverages Market Outlook, By Online (2021-2030) ($MN)
89 Middle East & Africa Nitro-Infused Beverages Market Outlook, By Convenience Stores (2021-2030) ($MN)
90 Middle East & Africa Nitro-Infused Beverages Market Outlook, By Other Distribution Channels (2021-2030) ($MN)
List of Figures
RESEARCH METHODOLOGY

We at ‘Stratistics’ opt for an extensive research approach which involves data mining, data validation, and data analysis. The various research sources include in-house repository, secondary research, competitor’s sources, social media research, client internal data, and primary research.
Our team of analysts prefers the most reliable and authenticated data sources in order to perform the comprehensive literature search. With access to most of the authenticated data bases our team highly considers the best mix of information through various sources to obtain extensive and accurate analysis.
Each report takes an average time of a month and a team of 4 industry analysts. The time may vary depending on the scope and data availability of the desired market report. The various parameters used in the market assessment are standardized in order to enhance the data accuracy.
Data Mining
The data is collected from several authenticated, reliable, paid and unpaid sources and is filtered depending on the scope & objective of the research. Our reports repository acts as an added advantage in this procedure. Data gathering from the raw material suppliers, distributors and the manufacturers is performed on a regular basis, this helps in the comprehensive understanding of the products value chain. Apart from the above mentioned sources the data is also collected from the industry consultants to ensure the objective of the study is in the right direction.
Market trends such as technological advancements, regulatory affairs, market dynamics (Drivers, Restraints, Opportunities and Challenges) are obtained from scientific journals, market related national & international associations and organizations.
Data Analysis
From the data that is collected depending on the scope & objective of the research the data is subjected for the analysis. The critical steps that we follow for the data analysis include:
- Product Lifecycle Analysis
- Competitor analysis
- Risk analysis
- Porters Analysis
- PESTEL Analysis
- SWOT Analysis
The data engineering is performed by the core industry experts considering both the Marketing Mix Modeling and the Demand Forecasting. The marketing mix modeling makes use of multiple-regression techniques to predict the optimal mix of marketing variables. Regression factor is based on a number of variables and how they relate to an outcome such as sales or profits.
Data Validation
The data validation is performed by the exhaustive primary research from the expert interviews. This includes telephonic interviews, focus groups, face to face interviews, and questionnaires to validate our research from all aspects. The industry experts we approach come from the leading firms, involved in the supply chain ranging from the suppliers, distributors to the manufacturers and consumers so as to ensure an unbiased analysis.
We are in touch with more than 15,000 industry experts with the right mix of consultants, CEO's, presidents, vice presidents, managers, experts from both supply side and demand side, executives and so on.
The data validation involves the primary research from the industry experts belonging to:
- Leading Companies
- Suppliers & Distributors
- Manufacturers
- Consumers
- Industry/Strategic Consultants
Apart from the data validation the primary research also helps in performing the fill gap research, i.e. providing solutions for the unmet needs of the research which helps in enhancing the reports quality.
For more details about research methodology, kindly write to us at info@strategymrc.com
Frequently Asked Questions
In case of any queries regarding this report, you can contact the customer service by filing the “Inquiry Before Buy” form available on the right hand side. You may also contact us through email: info@strategymrc.com or phone: +1-301-202-5929
Yes, the samples are available for all the published reports. You can request them by filling the “Request Sample” option available in this page.
Yes, you can request a sample with your specific requirements. All the customized samples will be provided as per the requirement with the real data masked.
All our reports are available in Digital PDF format. In case if you require them in any other formats, such as PPT, Excel etc you can submit a request through “Inquiry Before Buy” form available on the right hand side. You may also contact us through email: info@strategymrc.com or phone: +1-301-202-5929
We offer a free 15% customization with every purchase. This requirement can be fulfilled for both pre and post sale. You may send your customization requirements through email at info@strategymrc.com or call us on +1-301-202-5929.
We have 3 different licensing options available in electronic format.
- Single User Licence: Allows one person, typically the buyer, to have access to the ordered product. The ordered product cannot be distributed to anyone else.
- 2-5 User Licence: Allows the ordered product to be shared among a maximum of 5 people within your organisation.
- Corporate License: Allows the product to be shared among all employees of your organisation regardless of their geographical location.
All our reports are typically be emailed to you as an attachment.
To order any available report you need to register on our website. The payment can be made either through CCAvenue or PayPal payments gateways which accept all international cards.
We extend our support to 6 months post sale. A post sale customization is also provided to cover your unmet needs in the report.
Request Customization
We offer complimentary customization of up to 15% with every purchase. To share your customization requirements, feel free to email us at info@strategymrc.com or call us on +1-301-202-5929. .
Please Note: Customization within the 15% threshold is entirely free of charge. If your request exceeds this limit, we will conduct a feasibility assessment. Following that, a detailed quote and timeline will be provided.
WHY CHOOSE US ?

Assured Quality
Best in class reports with high standard of research integrity

24X7 Research Support
Continuous support to ensure the best customer experience.

Free Customization
Adding more values to your product of interest.

Safe & Secure Access
Providing a secured environment for all online transactions.

Trusted by 600+ Brands
Serving the most reputed brands across the world.