
Non Sugar Sweeteners Market
Non-Sugar Sweeteners Market Forecasts to 2028 – Global Analysis By Type (Natural Sweeteners, Artificial Sweeteners), Application (Food Products and Beverages), and By Geography

|
Years Covered |
2020-2028 |
|
Estimated Year Value (2022) |
US $12.30 MN |
|
Projected Year Value (2028) |
US $15.12 MN |
|
CAGR (2022 - 2028) |
3.5% |
|
Regions Covered |
North America, Europe, Asia Pacific, South America, and Middle East & Africa |
|
Countries Covered |
US, Canada, Mexico, Germany, UK, Italy, France, Spain, Japan, China, India, Australia, New Zealand, South Korea, Rest of Asia Pacific, South America, Argentina, Brazil, Chile, Middle East & Africa, Saudi Arabia, UAE, Qatar, and South Africa |
|
Largest Market |
Asia Pacific |
|
Highest Growing Market |
North America |
According to Stratistics MRC, the Global Non Sugar Sweeteners Market is accounted for $12.30 million in 2022 and is expected to reach $15.12 billion by 2028 growing at a CAGR of 3.5% during the forecast period. Non sugar sweeteners are type of food additives that are added to food and beverages to duplicate result of sugar in terms of taste. High intensity sweeteners are very important segment of non sugar sweetener market which is sweeter than normal sugar. Many popular sugar substitutes approved in food use are artificially-synthesized compounds. Non sugar sweeteners are typically used in diet and low calorie food and beverages.
According to a National Diabetes Statistics Report, published by the US Department of Health & Human Services in 2020, 10.5% of the US population had diabetes in 2018, 13.0% of all US adults had diabetes, 2.8% of all US adults met laboratory criteria for diabetes were not aware of or did not report having diabetes, and 21.4% of all US adults were diagnosed with diabetes. According to the same source, the prevalence of obesity was 40.0% among young adults aged 20 to 39 years, 44.8% among middle-aged adults aged 40 to 59 years, and 42.8% among adults aged 60 and older. These increasing health conditions are resulting in an increased demand for low-calorie food & beverage products for helping consumers maintain a healthy diet.
Market Dynamics:
Driver:
Increase in the consumption of organic sweeteners
There is rapid growth in the consumption of organic sweeteners. The key players working in the sweetener market are diversifying their product selection according to the customers taste and preferences, which seek a shift from sugar to sweeteners like organic honey, organic sugar, stevia etc. These products aid in lowering blood sugar levels. Besides, based on a few studies, it has been observed that stevia has improved digestive easiness with low content of carbohydrates. Therefore, the sweetener market brings extraordinary diagnosis. Further, there is a huge demand for artificial sweeteners besides organic sweetener.
Restraint:
Incidental health problems due to overconsumption
The overconsumption of substitute sweeteners is supposed to have severe side-effects like allergic reactions, improper functioning of digestive system, obesity, cancer, and cardiovascular diseases. This is restraining the growth of the market.
Opportunity:
High prevalence of obesity and diabetes
High prevalence of obesity and diabetes are the main increased advantages for the global non sugar sweeteners market. In such circumstances demand of patients is to lose weight with necessity, which has coaxed millions of sufferers to eradicate the ingestion of sugar from their daily diet. This result in a significant number of people opting for numerous types of sugar substitutes, which lends a serious force to the global non-sugar sweeteners market.
Threat:
High cost and potential health risk
The possible harmful health benefits and the high investment costs to produce the range of products are acting as threats for the growth of the Non Sugar Sweeteners market.
Covid-19 Impact
The Covid-19 pandemic has brought a major change in the diet patterns of customers. The consumption of healthy and nutritional products has increased worldwide due to well being and immunity. The acceptance of sugar alternatives, both natural and artificial, has improved, particularly among obesity and diabetic patients. While these conditions are related to lifestyle diseases such as heart disease, hypertension, stroke, obese and diabetic patients are at a greater risk of COVID-19 and related problems. The covid-19 pandemic extremely affected the supply of products around the globe and the raw materials. Due to lack of availability of raw materials, and supply the production of sweeteners got affected. Lack of supply declined the requirement of the sweetener market. Apart from that, the shortage of labourers in the factories greatly influenced the production of sweeteners. Moreover, the stores were blocked, and due to trouble in the distribution channels, the sweetener market was highly affected.
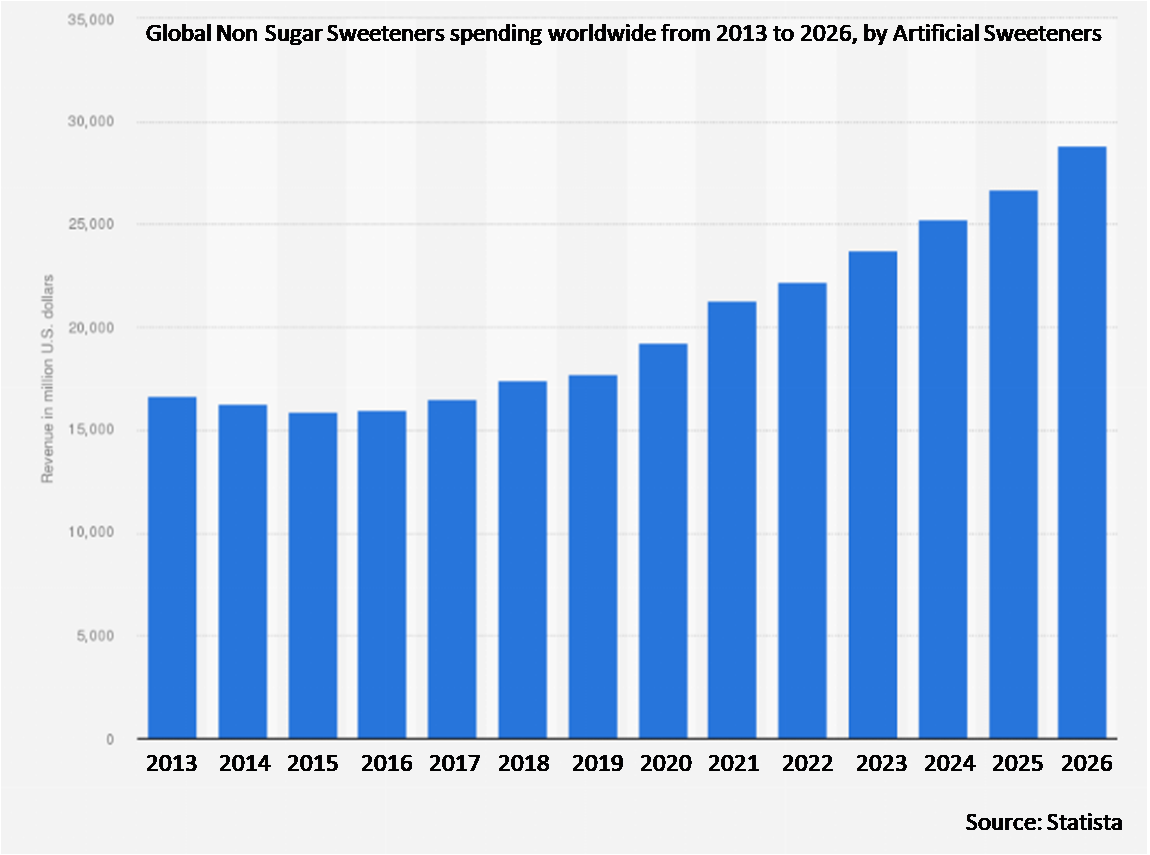
The artificial sweeteners segment is expected to be the largest during the forecast period
The artificial sweeteners are sugar alternatives, which contain a sweet flavour, and produced unnaturally. They hold low calories, and help sustain blood sugar levels, and help the people with health disorders. Artificial sweeteners are highly used in dairy products, bakery products, beverages. Food manufacturing companies manufacture these sugar-free alternatives as their main products, to encourage market growth. The market growth can be qualified to better awareness and health consciousness among customers, leading to a higher demand for low-calories sugar alternatives. To maintain this trend, many food and beverage brands are replacing normal sugars with low-calories sugar substitutes. These products are also best-suited for diabetic patients as they do not raise the blood glucose levels. Thus, the presence of a large number of obesity and diabetes patients should foster artificial sweeteners market growth. Increasing alertness related to risk of diabetes is intensifying focus on dental care, and tendency towards weight management which consequently fuel the market for artificial sweeteners. Increasing preference for sugar-free products is a key artificial sweeteners market trend, which will bode well in the foreseeable future.
The food products segment is expected to have the highest CAGR during the forecast period
The food products segment anticipated for the largest market share and is also expected to have the fastest-growing segment during the forecast period. Owing to the improved usage of sugar substitutes by consumers, resulting in increased demand of the products. The intake of high sugar intake foodstuffs globally is outcome of its usage over a wide range of food and beverage products. Sugar plays a crucial role in sweetening the taste of food products. Hence, the consumption of natural sugar substitute is observed in the food and beverage industry as well, which are constantly inventing new products. In addition, the growing demand for natural health and sports drinks with enhanced nutritional value contributes the growth of this segment. With the rise in fitness trend, food and beverages industry has also started using novel sweeteners, especially stevia in baked food products, syrups, beverages and other food products.
Region with highest share:
Asia Pacific is estimated to increase the highest share in the sweeteners market during the forecast period. Due to the changes in lifestyle and rise in health consciousness among customers is contributed to the growth of the industry. The Asia Pacific region is exceptionally vibrant due to rapid urbanization, liberal trade policies in the food sector, and diet diversification. Moreover, an increasing purchasing power due to rise in per capita income is the key aspect contributing growth projection for manufacturers of sweeteners market in this region. Increasing awareness about sugar consumption is fueling the growth. Manufacturers are also focusing on developing new products using novel sweeteners to meet the increasing demand for low calorie food. The growing frequency of health issues like obesity, hypertension, dental damage, and diabetes, made it necessary for people living in the Asia Pacific region to decrease their sugar consumption.
Region with highest CAGR:
North America is owing to growing consumer dependence in the lead of convenience foods. Countries in this region are screening their choices towards adopting ready to drink beverages. This feature is anticipated to drive North America’s demand and is also expected to dominate the non sugar sweeteners market over the forecast period. This region will lead the global market to nurture consumer reliance upon convenience foods. In North America there is a growing demand for low-calorie products due to the increase in diabetes and obesity.

Key players in the market
Some of the key players profiled in the Non Sugar Sweeteners Market include Beckmann-Kenko GmbH, Cargill, Dulcette Technologies LLC, Nutrasweet Company, Ajinomoto co, Inc, A&Z Food Additives Co Ltd, Merisant worldwide Inc, Imperial Sugar Company, Naturex, Atlantic chemicals trading GmbH, GLG Life Tech Corporation, Pure circle, Biovittoria, Giri Health Products, Sanxinyuan Food Industry Corporation Limited, Zydus Wellness Ltd, Archer Daniels Midland Company (ADM), Corn Products International Inc, Golden time enterprise (Shenzhen) co, ltd, Roquette.
Key Developments:
In January 2021, Roquette, BRAIN AG, and AnalytiCon Discovery revealed that the research and development phase for Brazzein, a protein sweetener that is naturally present in African berries called Pentadiplandra brazzeana Baillon, had been successfully completed.
In 2021, AnalytiCon Discovery and Roquette declared a successful R&D investment to develop Brazzein, a protein sugar substitute naturally produced in African berries renowned as Pentadiplandra.
In 2020, Ingredion EMEA introduced its first polyol sweetener, ERYSTA Erythritol, to allow the industry to reduce or replace sugar in numerous applications to achieve nutrition-related claims including ‘no added sugar’ or ‘calorie-reduced.
In July 2019, Nestle launched a new product with 70% dark chocolate and natural added sweeteners equal to 40% less sugar.
In January 2021, Roquette, BRAIN AG, and AnalytiCon Discovery announced the successful completion of the R&D phase for the development of Brazzein which is a protein sweetener naturally found in African berries Pentadiplandra brazzeana Baillon.
Type Covered:
• Natural Sweeteners
• Artificial Sweeteners
Applications Covered:
• Food Products
• Beverages
Regions Covered:
• North America
o US
o Canada
o Mexico
• Europe
o Germany
o UK
o Italy
o France
o Spain
o Rest of Europe
• Asia Pacific
o Japan
o China
o India
o Australia
o New Zealand
o South Korea
o Rest of Asia Pacific
• South America
o Argentina
o Brazil
o Chile
o Rest of South America
• Middle East & Africa
o Saudi Arabia
o UAE
o Qatar
o South Africa
o Rest of Middle East & Africa
What our report offers:
- Market share assessments for the regional and country-level segments
- Strategic recommendations for the new entrants
- Covers Market data for the years 2020, 2021, 2022, 2025, and 2028
- Market Trends (Drivers, Constraints, Opportunities, Threats, Challenges, Investment Opportunities, and recommendations)
- Strategic recommendations in key business segments based on the market estimations
- Competitive landscaping mapping the key common trends
- Company profiling with detailed strategies, financials, and recent developments
- Supply chain trends mapping the latest technological advancements
Free Customization Offerings:
All the customers of this report will be entitled to receive one of the following free customization options:
• Company Profiling
o Comprehensive profiling of additional market players (up to 3)
o SWOT Analysis of key players (up to 3)
• Regional Segmentation
o Market estimations, Forecasts and CAGR of any prominent country as per the client's interest (Note: Depends on feasibility check)
• Competitive Benchmarking
o Benchmarking of key players based on product portfolio, geographical presence, and strategic alliances
Table of Contents
1 Executive Summary
2 Preface
2.1 Abstract
2.2 Stake Holders
2.3 Research Scope
2.4 Research Methodology
2.4.1 Data Mining
2.4.2 Data Analysis
2.4.3 Data Validation
2.4.4 Research Approach
2.5 Research Sources
2.5.1 Primary Research Sources
2.5.2 Secondary Research Sources
2.5.3 Assumptions
3 Market Trend Analysis
3.1 Introduction
3.2 Drivers
3.3 Restraints
3.4 Opportunities
3.5 Threats
3.6 Application Analysis
3.7 Emerging Markets
3.8 Impact of Covid-19
4 Porters Five Force Analysis
4.1 Bargaining power of suppliers
4.2 Bargaining power of buyers
4.3 Threat of substitutes
4.4 Threat of new entrants
4.5 Competitive rivalry
5 Global Non Sugar Sweeteners Market, By Type
5.1 Introduction
5.2 Natural Sweeteners
5.2.1 Stevia
5.2.2 Other Natural Non-nutritive Sweeteners
5.2.2.1 Xylitol
5.2.2.2 Luo Han Guo
5.2.2.3 Tagatose
5.2.2.4 Thaumatin
5.2.2.5 Sorbitol
5.2.2.6 Monatin
5.2.2.7 Glycyrrhizin
5.3 Artificial Sweeteners
5.3.1 Alitame
5.3.2 Sucralose
5.3.3 Saccharin
5.3.4 Aspartame
5.3.5 Neotame
5.3.6 Cyclamate
5.3.7 Acesulfame Potassium
5.3.8 Other Artificial Sweeteners
6 Global Non Sugar Sweeteners Market, By Application
6.1 Introduction
6.2 Food Products
6.2.1 Baked Products
6.2.2 Confectionery
6.2.3 Frozen Desserts
6.2.4 Other Food Products
6.3 Beverages
6.3.1 Sugar Alcohol
6.3.2 High-Fructose Corn Syrup (HFCS)
6.3.3 Other Beverages
7 Global Non Sugar Sweeteners Market, By Geography
7.1 Introduction
7.2 North America
7.2.1 US
7.2.2 Canada
7.2.3 Mexico
7.3 Europe
7.3.1 Germany
7.3.2 UK
7.3.3 Italy
7.3.4 France
7.3.5 Spain
7.3.6 Rest of Europe
7.4 Asia Pacific
7.4.1 Japan
7.4.2 China
7.4.3 India
7.4.4 Australia
7.4.5 New Zealand
7.4.6 South Korea
7.4.7 Rest of Asia Pacific
7.5 South America
7.5.1 Argentina
7.5.2 Brazil
7.5.3 Chile
7.5.4 Rest of South America
7.6 Middle East & Africa
7.6.1 Saudi Arabia
7.6.2 UAE
7.6.3 Qatar
7.6.4 South Africa
7.6.5 Rest of Middle East & Africa
8 Key Developments
8.1 Agreements, Partnerships, Collaborations and Joint Ventures
8.2 Acquisitions & Mergers
8.3 New Product Launch
8.4 Expansions
8.5 Other Key Strategies
9 Company Profiling
9.1 Beckmann-Kenko GmbH, Germany
9.2 Cargill, U.S.
9.3 Dulcette Technologies LLC, U.S.
9.4 Nutrasweet Company, U.S.
9.5 Ajinomoto co, Inc, Thailand
9.6 A&Z Food Additives Co Ltd, China
9.7 Merisant worldwide Inc, U.S.
9.8 Imperial Sugar Company, U.S.
9.9 Naturex, U.S.
9.10 Atlantic chemicals trading GmbH, Germany
9.11 GLG Life Tech Corporation, China
9.12 Purecircle, Malasia
9.13 Biovittoria, New Zealand
9.14 Giri Health Products, India
9.15 Sanxinyuan Food Industry Corporation Limited, China
9.16 Zydus Wellness Ltd, India
9.17 Archer Daniels Midland Company (ADM), U.S.
9.18 Corn Products International Inc, U.S.
9.19 Golden time enterprise (Shenzhen) co, ltd
9.20 Roquette, France
List of Tables
1 Global Non Sugar Sweeteners Market Outlook, By Region (2020-2028) (US $MN)
2 Global Non Sugar Sweeteners Market Outlook, By Type (2020-2028) (US $MN)
3 Global Non Sugar Sweeteners Market Outlook, By Natural Sweeteners (2020-2028) (US $MN)
4 Global Non Sugar Sweeteners Market Outlook, By Stevia (2020-2028) (US $MN)
5 Global Non Sugar Sweeteners Market Outlook, By Other Natural Non-nutritive Sweeteners (2020-2028) (US $MN)
6 Global Non Sugar Sweeteners Market Outlook, By Artificial Sweeteners (2020-2028) (US $MN)
7 Global Non Sugar Sweeteners Market Outlook, By Alitame (2020-2028) (US $MN)
8 Global Non Sugar Sweeteners Market Outlook, By Sucralose (2020-2028) (US $MN)
9 Global Non Sugar Sweeteners Market Outlook, By Saccharin (2020-2028) (US $MN)
10 Global Non Sugar Sweeteners Market Outlook, By Aspartame (2020-2028) (US $MN)
11 Global Non Sugar Sweeteners Market Outlook, By Neotame (2020-2028) (US $MN)
12 Global Non Sugar Sweeteners Market Outlook, By Cyclamate (2020-2028) (US $MN)
13 Global Non Sugar Sweeteners Market Outlook, By Acesulfame Potassium (2020-2028) (US $MN)
14 Global Non Sugar Sweeteners Market Outlook, By Other Artificial Sweeteners (2020-2028) (US $MN)
15 Global Non Sugar Sweeteners Market Outlook, By Applications (2020-2028) (US $MN)
16 Global Non Sugar Sweeteners Market Outlook, By Food Products (2020-2028) (US $MN)
17 Global Non Sugar Sweeteners Market Outlook, By Baked Products (2020-2028) (US $MN)
18 Global Non Sugar Sweeteners Market Outlook, By Confectionery (2020-2028) (US $MN)
19 Global Non Sugar Sweeteners Market Outlook, By Frozen Desserts (2020-2028) (US $MN)
20 Global Non Sugar Sweeteners Market Outlook, By Other Food Products (2020-2028) (US $MN)
21 Global Non Sugar Sweeteners Market Outlook, By Beverages (2020-2028) (US $MN)
22 Global Non Sugar Sweeteners Market Outlook, By Sugar Alcohol (2020-2028) (US $MN)
23 Global Non Sugar Sweeteners Market Outlook, By High-Fructose Corn Syrup (HFCS) (2020-2028) (US $MN)
24 Global Non Sugar Sweeteners Market Outlook, By Other Beverages (2020-2028) (US $MN)
25 North America Non Sugar Sweeteners Market Outlook, By Country (2020-2028) (US $MN)
26 North America Non Sugar Sweeteners Market Outlook, By Type (2020-2028) (US $MN)
27 North America Non Sugar Sweeteners Market Outlook, By Natural Sweeteners (2020-2028) (US $MN)
28 North America Non Sugar Sweeteners Market Outlook, By Stevia (2020-2028) (US $MN)
29 North America Non Sugar Sweeteners Market Outlook, By Other Natural Non-nutritive Sweeteners (2020-2028) (US $MN)
30 North America Non Sugar Sweeteners Market Outlook, By Artificial Sweeteners (2020-2028) (US $MN)
31 North America Non Sugar Sweeteners Market Outlook, By Alitame (2020-2028) (US $MN)
32 North America Non Sugar Sweeteners Market Outlook, By Sucralose (2020-2028) (US $MN)
33 North America Non Sugar Sweeteners Market Outlook, By Saccharin (2020-2028) (US $MN)
34 North America Non Sugar Sweeteners Market Outlook, By Aspartame (2020-2028) (US $MN)
35 North America Non Sugar Sweeteners Market Outlook, By Neotame (2020-2028) (US $MN)
36 North America Non Sugar Sweeteners Market Outlook, By Cyclamate (2020-2028) (US $MN)
37 North America Non Sugar Sweeteners Market Outlook, By Acesulfame Potassium (2020-2028) (US $MN)
38 North America Non Sugar Sweeteners Market Outlook, By Other Artificial Sweeteners (2020-2028) (US $MN)
39 North America Non Sugar Sweeteners Market Outlook, By Applications (2020-2028) (US $MN)
40 North America Non Sugar Sweeteners Market Outlook, By Food Products (2020-2028) (US $MN)
41 North America Non Sugar Sweeteners Market Outlook, By Baked Products (2020-2028) (US $MN)
42 North America Non Sugar Sweeteners Market Outlook, By Confectionery (2020-2028) (US $MN)
43 North America Non Sugar Sweeteners Market Outlook, By Frozen Desserts (2020-2028) (US $MN)
44 North America Non Sugar Sweeteners Market Outlook, By Other Food Products (2020-2028) (US $MN)
45 North America Non Sugar Sweeteners Market Outlook, By Beverages (2020-2028) (US $MN)
46 North America Non Sugar Sweeteners Market Outlook, By Sugar Alcohol (2020-2028) (US $MN)
47 North America Non Sugar Sweeteners Market Outlook, By High-Fructose Corn Syrup (HFCS) (2020-2028) (US $MN)
48 North America Non Sugar Sweeteners Market Outlook, By Other Beverages (2020-2028) (US $MN)
49 Europe Non Sugar Sweeteners Market Outlook, By Country (2020-2028) (US $MN)
50 Europe Non Sugar Sweeteners Market Outlook, By Type (2020-2028) (US $MN)
51 Europe Non Sugar Sweeteners Market Outlook, By Natural Sweeteners (2020-2028) (US $MN)
52 Europe Non Sugar Sweeteners Market Outlook, By Stevia (2020-2028) (US $MN)
53 Europe Non Sugar Sweeteners Market Outlook, By Other Natural Non-nutritive Sweeteners (2020-2028) (US $MN)
54 Europe Non Sugar Sweeteners Market Outlook, By Artificial Sweeteners (2020-2028) (US $MN)
55 Europe Non Sugar Sweeteners Market Outlook, By Alitame (2020-2028) (US $MN)
56 Europe Non Sugar Sweeteners Market Outlook, By Sucralose (2020-2028) (US $MN)
57 Europe Non Sugar Sweeteners Market Outlook, By Saccharin (2020-2028) (US $MN)
58 Europe Non Sugar Sweeteners Market Outlook, By Aspartame (2020-2028) (US $MN)
59 Europe Non Sugar Sweeteners Market Outlook, By Neotame (2020-2028) (US $MN)
60 Europe Non Sugar Sweeteners Market Outlook, By Cyclamate (2020-2028) (US $MN)
61 Europe Non Sugar Sweeteners Market Outlook, By Acesulfame Potassium (2020-2028) (US $MN)
62 Europe Non Sugar Sweeteners Market Outlook, By Other Artificial Sweeteners (2020-2028) (US $MN)
63 Europe Non Sugar Sweeteners Market Outlook, By Applications (2020-2028) (US $MN)
64 Europe Non Sugar Sweeteners Market Outlook, By Food Products (2020-2028) (US $MN)
65 Europe Non Sugar Sweeteners Market Outlook, By Baked Products (2020-2028) (US $MN)
66 Europe Non Sugar Sweeteners Market Outlook, By Confectionery (2020-2028) (US $MN)
67 Europe Non Sugar Sweeteners Market Outlook, By Frozen Desserts (2020-2028) (US $MN)
68 Europe Non Sugar Sweeteners Market Outlook, By Other Food Products (2020-2028) (US $MN)
69 Europe Non Sugar Sweeteners Market Outlook, By Beverages (2020-2028) (US $MN)
70 Europe Non Sugar Sweeteners Market Outlook, By Sugar Alcohol (2020-2028) (US $MN)
71 Europe Non Sugar Sweeteners Market Outlook, By High-Fructose Corn Syrup (HFCS) (2020-2028) (US $MN)
72 Europe Non Sugar Sweeteners Market Outlook, By Other Beverages (2020-2028) (US $MN)
73 Asia Pacific Non Sugar Sweeteners Market Outlook, By Country (2020-2028) (US $MN)
74 Asia Pacific Non Sugar Sweeteners Market Outlook, By Type (2020-2028) (US $MN)
75 Asia Pacific Non Sugar Sweeteners Market Outlook, By Natural Sweeteners (2020-2028) (US $MN)
76 Asia Pacific Non Sugar Sweeteners Market Outlook, By Stevia (2020-2028) (US $MN)
77 Asia Pacific Non Sugar Sweeteners Market Outlook, By Other Natural Non-nutritive Sweeteners (2020-2028) (US $MN)
78 Asia Pacific Non Sugar Sweeteners Market Outlook, By Artificial Sweeteners (2020-2028) (US $MN)
79 Asia Pacific Non Sugar Sweeteners Market Outlook, By Alitame (2020-2028) (US $MN)
80 Asia Pacific Non Sugar Sweeteners Market Outlook, By Sucralose (2020-2028) (US $MN)
81 Asia Pacific Non Sugar Sweeteners Market Outlook, By Saccharin (2020-2028) (US $MN)
82 Asia Pacific Non Sugar Sweeteners Market Outlook, By Aspartame (2020-2028) (US $MN)
83 Asia Pacific Non Sugar Sweeteners Market Outlook, By Neotame (2020-2028) (US $MN)
84 Asia Pacific Non Sugar Sweeteners Market Outlook, By Cyclamate (2020-2028) (US $MN)
85 Asia Pacific Non Sugar Sweeteners Market Outlook, By Acesulfame Potassium (2020-2028) (US $MN)
86 Asia Pacific Non Sugar Sweeteners Market Outlook, By Other Artificial Sweeteners (2020-2028) (US $MN)
87 Asia Pacific Non Sugar Sweeteners Market Outlook, By Applications (2020-2028) (US $MN)
88 Asia Pacific Non Sugar Sweeteners Market Outlook, By Food Products (2020-2028) (US $MN)
89 Asia Pacific Non Sugar Sweeteners Market Outlook, By Baked Products (2020-2028) (US $MN)
90 Asia Pacific Non Sugar Sweeteners Market Outlook, By Confectionery (2020-2028) (US $MN)
91 Asia Pacific Non Sugar Sweeteners Market Outlook, By Frozen Desserts (2020-2028) (US $MN)
92 Asia Pacific Non Sugar Sweeteners Market Outlook, By Other Food Products (2020-2028) (US $MN)
93 Asia Pacific Non Sugar Sweeteners Market Outlook, By Beverages (2020-2028) (US $MN)
94 Asia Pacific Non Sugar Sweeteners Market Outlook, By Sugar Alcohol (2020-2028) (US $MN)
95 Asia Pacific Non Sugar Sweeteners Market Outlook, By High-Fructose Corn Syrup (HFCS) (2020-2028) (US $MN)
96 Asia Pacific Non Sugar Sweeteners Market Outlook, By Other Beverages (2020-2028) (US $MN)
97 South America Non Sugar Sweeteners Market Outlook, By Country (2020-2028) (US $MN)
98 South America Non Sugar Sweeteners Market Outlook, By Type (2020-2028) (US $MN)
99 South America Non Sugar Sweeteners Market Outlook, By Natural Sweeteners (2020-2028) (US $MN)
100 South America Non Sugar Sweeteners Market Outlook, By Stevia (2020-2028) (US $MN)
101 South America Non Sugar Sweeteners Market Outlook, By Other Natural Non-nutritive Sweeteners (2020-2028) (US $MN)
102 South America Non Sugar Sweeteners Market Outlook, By Artificial Sweeteners (2020-2028) (US $MN)
103 South America Non Sugar Sweeteners Market Outlook, By Alitame (2020-2028) (US $MN)
104 South America Non Sugar Sweeteners Market Outlook, By Sucralose (2020-2028) (US $MN)
105 South America Non Sugar Sweeteners Market Outlook, By Saccharin (2020-2028) (US $MN)
106 South America Non Sugar Sweeteners Market Outlook, By Aspartame (2020-2028) (US $MN)
107 South America Non Sugar Sweeteners Market Outlook, By Neotame (2020-2028) (US $MN)
108 South America Non Sugar Sweeteners Market Outlook, By Cyclamate (2020-2028) (US $MN)
109 South America Non Sugar Sweeteners Market Outlook, By Acesulfame Potassium (2020-2028) (US $MN)
110 South America Non Sugar Sweeteners Market Outlook, By Other Artificial Sweeteners (2020-2028) (US $MN)
111 South America Non Sugar Sweeteners Market Outlook, By Applications (2020-2028) (US $MN)
112 South America Non Sugar Sweeteners Market Outlook, By Food Products (2020-2028) (US $MN)
113 South America Non Sugar Sweeteners Market Outlook, By Baked Products (2020-2028) (US $MN)
114 South America Non Sugar Sweeteners Market Outlook, By Confectionery (2020-2028) (US $MN)
115 South America Non Sugar Sweeteners Market Outlook, By Frozen Desserts (2020-2028) (US $MN)
116 South America Non Sugar Sweeteners Market Outlook, By Other Food Products (2020-2028) (US $MN)
117 South America Non Sugar Sweeteners Market Outlook, By Beverages (2020-2028) (US $MN)
118 South America Non Sugar Sweeteners Market Outlook, By Sugar Alcohol (2020-2028) (US $MN)
119 South America Non Sugar Sweeteners Market Outlook, By High-Fructose Corn Syrup (HFCS) (2020-2028) (US $MN)
120 South America Non Sugar Sweeteners Market Outlook, By Other Beverages (2020-2028) (US $MN)
121 Middle East & Africa Non Sugar Sweeteners Market Outlook, By Country (2020-2028) (US $MN)
122 Middle East & Africa Non Sugar Sweeteners Market Outlook, By Type (2020-2028) (US $MN)
123 Middle East & Africa Non Sugar Sweeteners Market Outlook, By Natural Sweeteners (2020-2028) (US $MN)
124 Middle East & Africa Non Sugar Sweeteners Market Outlook, By Stevia (2020-2028) (US $MN)
125 Middle East & Africa Non Sugar Sweeteners Market Outlook, By Other Natural Non-nutritive Sweeteners (2020-2028) (US $MN)
126 Middle East & Africa Non Sugar Sweeteners Market Outlook, By Artificial Sweeteners (2020-2028) (US $MN)
127 Middle East & Africa Non Sugar Sweeteners Market Outlook, By Alitame (2020-2028) (US $MN)
128 Middle East & Africa Non Sugar Sweeteners Market Outlook, By Sucralose (2020-2028) (US $MN)
129 Middle East & Africa Non Sugar Sweeteners Market Outlook, By Saccharin (2020-2028) (US $MN)
130 Middle East & Africa Non Sugar Sweeteners Market Outlook, By Aspartame (2020-2028) (US $MN)
131 Middle East & Africa Non Sugar Sweeteners Market Outlook, By Neotame (2020-2028) (US $MN)
132 Middle East & Africa Non Sugar Sweeteners Market Outlook, By Cyclamate (2020-2028) (US $MN)
133 Middle East & Africa Non Sugar Sweeteners Market Outlook, By Acesulfame Potassium (2020-2028) (US $MN)
134 Middle East & Africa Non Sugar Sweeteners Market Outlook, By Other Artificial Sweeteners (2020-2028) (US $MN)
135 Middle East & Africa Non Sugar Sweeteners Market Outlook, By Applications (2020-2028) (US $MN)
136 Middle East & Africa Non Sugar Sweeteners Market Outlook, By Food Products (2020-2028) (US $MN)
137 Middle East & Africa Non Sugar Sweeteners Market Outlook, By Baked Products (2020-2028) (US $MN)
138 Middle East & Africa Non Sugar Sweeteners Market Outlook, By Confectionery (2020-2028) (US $MN)
139 Middle East & Africa Non Sugar Sweeteners Market Outlook, By Frozen Desserts (2020-2028) (US $MN)
140 Middle East & Africa Non Sugar Sweeteners Market Outlook, By Other Food Products (2020-2028) (US $MN)
141 Middle East & Africa Non Sugar Sweeteners Market Outlook, By Beverages (2020-2028) (US $MN)
142 Middle East & Africa Non Sugar Sweeteners Market Outlook, By Sugar Alcohol (2020-2028) (US $MN)
143 Middle East & Africa Non Sugar Sweeteners Market Outlook, By High-Fructose Corn Syrup (HFCS) (2020-2028) (US $MN)
144 Middle East & Africa Non Sugar Sweeteners Market Outlook, By Other Beverages (2020-2028) (US $MN)
List of Figures
RESEARCH METHODOLOGY

We at ‘Stratistics’ opt for an extensive research approach which involves data mining, data validation, and data analysis. The various research sources include in-house repository, secondary research, competitor’s sources, social media research, client internal data, and primary research.
Our team of analysts prefers the most reliable and authenticated data sources in order to perform the comprehensive literature search. With access to most of the authenticated data bases our team highly considers the best mix of information through various sources to obtain extensive and accurate analysis.
Each report takes an average time of a month and a team of 4 industry analysts. The time may vary depending on the scope and data availability of the desired market report. The various parameters used in the market assessment are standardized in order to enhance the data accuracy.
Data Mining
The data is collected from several authenticated, reliable, paid and unpaid sources and is filtered depending on the scope & objective of the research. Our reports repository acts as an added advantage in this procedure. Data gathering from the raw material suppliers, distributors and the manufacturers is performed on a regular basis, this helps in the comprehensive understanding of the products value chain. Apart from the above mentioned sources the data is also collected from the industry consultants to ensure the objective of the study is in the right direction.
Market trends such as technological advancements, regulatory affairs, market dynamics (Drivers, Restraints, Opportunities and Challenges) are obtained from scientific journals, market related national & international associations and organizations.
Data Analysis
From the data that is collected depending on the scope & objective of the research the data is subjected for the analysis. The critical steps that we follow for the data analysis include:
- Product Lifecycle Analysis
- Competitor analysis
- Risk analysis
- Porters Analysis
- PESTEL Analysis
- SWOT Analysis
The data engineering is performed by the core industry experts considering both the Marketing Mix Modeling and the Demand Forecasting. The marketing mix modeling makes use of multiple-regression techniques to predict the optimal mix of marketing variables. Regression factor is based on a number of variables and how they relate to an outcome such as sales or profits.
Data Validation
The data validation is performed by the exhaustive primary research from the expert interviews. This includes telephonic interviews, focus groups, face to face interviews, and questionnaires to validate our research from all aspects. The industry experts we approach come from the leading firms, involved in the supply chain ranging from the suppliers, distributors to the manufacturers and consumers so as to ensure an unbiased analysis.
We are in touch with more than 15,000 industry experts with the right mix of consultants, CEO's, presidents, vice presidents, managers, experts from both supply side and demand side, executives and so on.
The data validation involves the primary research from the industry experts belonging to:
- Leading Companies
- Suppliers & Distributors
- Manufacturers
- Consumers
- Industry/Strategic Consultants
Apart from the data validation the primary research also helps in performing the fill gap research, i.e. providing solutions for the unmet needs of the research which helps in enhancing the reports quality.
For more details about research methodology, kindly write to us at info@strategymrc.com
Frequently Asked Questions
In case of any queries regarding this report, you can contact the customer service by filing the “Inquiry Before Buy” form available on the right hand side. You may also contact us through email: info@strategymrc.com or phone: +1-301-202-5929
Yes, the samples are available for all the published reports. You can request them by filling the “Request Sample” option available in this page.
Yes, you can request a sample with your specific requirements. All the customized samples will be provided as per the requirement with the real data masked.
All our reports are available in Digital PDF format. In case if you require them in any other formats, such as PPT, Excel etc you can submit a request through “Inquiry Before Buy” form available on the right hand side. You may also contact us through email: info@strategymrc.com or phone: +1-301-202-5929
We offer a free 15% customization with every purchase. This requirement can be fulfilled for both pre and post sale. You may send your customization requirements through email at info@strategymrc.com or call us on +1-301-202-5929.
We have 3 different licensing options available in electronic format.
- Single User Licence: Allows one person, typically the buyer, to have access to the ordered product. The ordered product cannot be distributed to anyone else.
- 2-5 User Licence: Allows the ordered product to be shared among a maximum of 5 people within your organisation.
- Corporate License: Allows the product to be shared among all employees of your organisation regardless of their geographical location.
All our reports are typically be emailed to you as an attachment.
To order any available report you need to register on our website. The payment can be made either through CCAvenue or PayPal payments gateways which accept all international cards.
We extend our support to 6 months post sale. A post sale customization is also provided to cover your unmet needs in the report.
Request Customization
We offer complimentary customization of up to 15% with every purchase. To share your customization requirements, feel free to email us at info@strategymrc.com or call us on +1-301-202-5929. .
Please Note: Customization within the 15% threshold is entirely free of charge. If your request exceeds this limit, we will conduct a feasibility assessment. Following that, a detailed quote and timeline will be provided.
WHY CHOOSE US ?

Assured Quality
Best in class reports with high standard of research integrity

24X7 Research Support
Continuous support to ensure the best customer experience.

Free Customization
Adding more values to your product of interest.

Safe & Secure Access
Providing a secured environment for all online transactions.

Trusted by 600+ Brands
Serving the most reputed brands across the world.