
Occupancy Sensors Market
Occupancy Sensors Market Forecasts to 2030 - Global Analysis By Connectivity Type (Wired and Wireless), Mounting Type (Ceiling-mounted, Wall-mounted and In-wall), Environment, Coverage Area, Technology, Application, End User and By Geography

|
Years Covered |
2021-2030 |
|
Estimated Year Value (2023) |
US $2.52 BN |
|
Projected Year Value (2030) |
US $15.64 BN |
|
CAGR (2023 - 2030) |
16.2% |
|
Regions Covered |
North America, Europe, Asia Pacific, South America, and Middle East & Africa |
|
Countries Covered |
US, Canada, Mexico, Germany, UK, Italy, France, Spain, Japan, China, India, Australia, New Zealand, South Korea, Rest of Asia Pacific, South America, Argentina, Brazil, Chile, Middle East & Africa, Saudi Arabia, UAE, Qatar, and South Africa |
|
Largest Market |
Asia Pacific |
|
Highest Growing Market |
North America |
According to Stratistics MRC, the Global Occupancy Sensors Market is accounted for $2.52 billion in 2023 and is expected to reach $15.64 billion by 2030 growing at a CAGR of 16.2% during the forecast period. Occupancy sensors are devices used to detect the presence or absence of people within a space, typically in buildings. They work by detecting motion, heat, or sound. When someone enters a room, the sensor triggers lighting, heating, or cooling systems to turn on, and when the space is vacant for a specified period, it automatically switches them off, thereby conserving energy and reducing costs. These sensors improve energy efficiency, enhance security, and provide convenience by automating lighting and climate control systems.
According to the Department of Economic and Social Affairs, Santander, the Spanish city, is embedded with more than 12,000 sensors that measure everything from the amount of trash in containers to the number of parking spaces available to the size of crowds. And with the trend of urbanization is growing worldwide, 60% of the population will be living in cities by 2050.
Market Dynamics:
Driver:
Rapid urbanization and infrastructure development
As cities expand, there's a heightened focus on energy efficiency and smart building solutions to accommodate growing populations sustainably. Occupancy sensors play a crucial role in optimizing energy usage and enhancing building automation systems, aligning with the broader trend towards urban sustainability. Consequently, the need for efficient space utilization and resource management drives the adoption of occupancy sensors in modern building projects, stimulating market growth.
Restraint:
Perception of complexity
The perception of complexity in occupancy sensors arises from factors such as installation challenges, compatibility issues with existing systems, and the need for technical expertise for integration and programming. This perceived complexity can deter potential users, including building owners and operators, from adopting occupancy sensor solutions. As a result, market growth is hampered as the reluctance to invest in and implement these solutions persists.
Opportunity:
Escalating adoption of smart homes
The escalating adoption of smart homes is driving the growth of the occupancy sensors as homeowners seek to enhance convenience, energy efficiency, and security. Occupancy sensors play a crucial role in smart home automation by automatically controlling lighting, heating, ventilation, and air conditioning systems based on occupancy patterns. This not only improves the overall comfort and convenience for residents but also leads to significant energy savings. As smart home technology continues to penetrate households, the demand for occupancy sensors is expected to rise correspondingly.
Threat:
Privacy & reliability concerns
Privacy concerns arise due to the potential intrusion into personal space and data privacy violations associated with occupancy sensors, as they collect information about occupant’s movements and activities within a space. Reliability concerns encompass issues such as false positives/negatives, sensor malfunctions, and data inaccuracies, which can lead to inconvenience and mistrust among users. These concerns deter adoption, thus impeding market growth as users prioritize privacy and reliability over the benefits offered by occupancy sensors.
Covid-19 Impact
The covid-19 pandemic has had a mixed impact on the occupancy sensors market. While the increased focus on indoor air quality and hygiene has led to heightened demand for occupancy sensors to monitor and manage occupancy levels in buildings, the economic downturn and disruption in construction projects have slowed market growth. Additionally, remote work trends have reduced the immediate need for occupancy sensors in commercial spaces. However, the long-term emphasis on building safety and efficiency is expected to drive steady growth as the pandemic subsides.
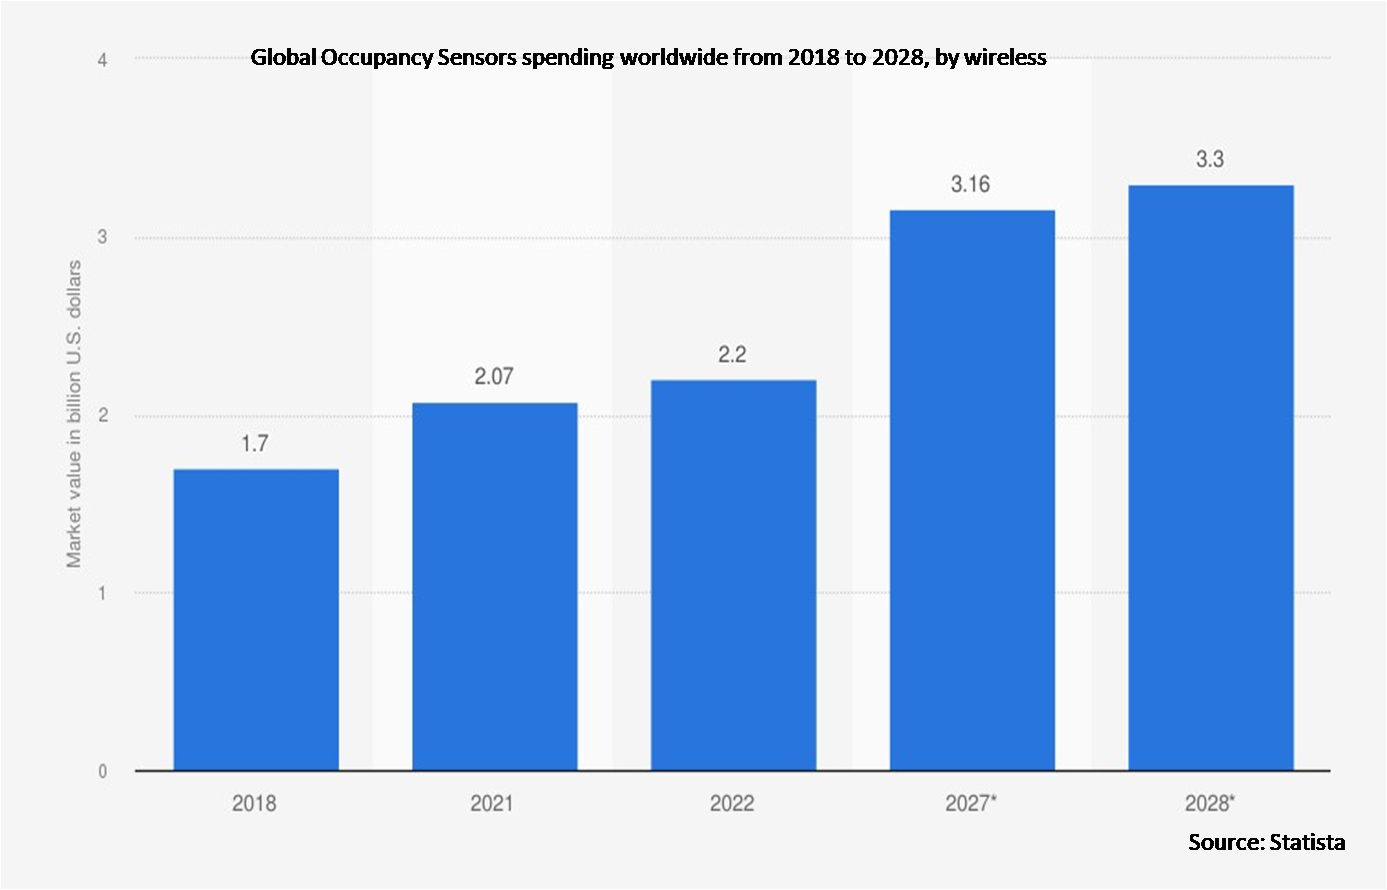
The wireless segment is expected to be the largest during the forecast period
The wireless segment is estimated to have a lucrative growth. Wireless occupancy sensors offer flexibility and ease of installation compared to traditional wired sensors. They eliminate the need for complex wiring and enabling quick deployment in various environments. Wireless connectivity allows for scalability and adaptability, making it suitable for retrofitting existing buildings or implementing temporary setups. Moreover, they contribute to cost savings and improved occupant comfort in residential, commercial, and industrial settings.
The energy management segment is expected to have the highest CAGR during the forecast period
The energy management segment is anticipated to witness the highest CAGR growth during the forecast period. These sensors detect occupancy levels in various spaces, allowing for intelligent control of lighting, heating, ventilation, and air conditioning systems based on real-time occupancy data. By automatically adjusting energy consumption to match occupancy patterns, occupancy sensors help reduce wasted energy in unoccupied areas, leading to significant cost savings and environmental benefits.
Region with largest share:
Asia Pacific is projected to hold the largest market share during the forecast period owing to rapid urbanization, infrastructure development, and increasing awareness of energy efficiency. Government’s initiatives in the region are hugely promoting green buildings and stringent energy regulations. Moreover, the burgeoning smart city projects and the rising demand for smart home solutions are further fueling market growth. Key players are expanding their presence in the region, introducing advanced sensor technologies tailored to the specific needs of the Asia-Pacific market, thereby contributing to its expansion.
Region with highest CAGR:
North America is projected to have the highest CAGR over the forecast period, owing to increasing demand for smart building solutions, and the growing emphasis on workplace safety and security. The region's mature construction industry and high adoption rates of smart technologies further propel market expansion. The region's well-established infrastructure, technological advancements, and high awareness of smart building solutions further fuel market growth. Further, Key players in the region are innovating to meet the evolving needs, contributing to the market's expansion.

Key players in the market
Some of the key players profiled in the Occupancy Sensors Market include Eaton Corporation, Hubbell Incorporated, Honeywell International Inc., Panasonic Corporation, Novelda AS, Danlers Limited, Johnson Controls International PLC, Legrand, Siemens AG, Schneider Electric SE, Silicon Labs, Osram GmbH, Signify N.V., Acuity Brands Inc., Crestron Electronics Inc., Lutron Electronics Corporation, Leviton Manufacturing Corporation, FIBARO and STEINEL.
Key Developments:
In January 2023, Silicon Labs, the leader in secure, intelligent wireless technology for a more connected world announced that Yeelight, a leader in smart lighting, has selected the Silicon Labs MG24 2.4GHz wireless SoC for its first Matter 1.0 battery-powered occupancy sensor, the Yeelight Pro P20, which will be exhibited at CES 2023 at Yeelight Booth #50326 Venetian Expo.
In September 2022, Novelda, maker of the most reliable human presence sensors, announced the launch of its new ultra-wideband (UWB) Occupancy Sensor. This lighting control sensor enhances energy savings and offers improved user experience, instantly turning on lights on approach and turning them off quickly when they are no longer needed.
Connectivity Types Covered:
• Wired
• Wireless
Mounting Types Covered:
• Ceiling-mounted
• Wall-mounted
• In-wall
Environments Covered:
• Indoor
• Outdoor
Coverage Areas Covered:
• Less than 89 Degree
• 90 Degree-179 Degree
• 180 Degree-360 Degree
Technologies Covered:
• Passive Infrared (PIR)
• Dual Technology
• Microwave
• Ultrasonic
• Other Technologies
Applications Covered:
• Lighting Control
• HVAC Control
• Security and Surveillance
• Energy Management
• Other Applications
End Users Covered:
• Residential
• Commercial
• Healthcare
• Hospitality
• Industrial
• Other End Users
Regions Covered:
• North America
o US
o Canada
o Mexico
• Europe
o Germany
o UK
o Italy
o France
o Spain
o Rest of Europe
• Asia Pacific
o Japan
o China
o India
o Australia
o New Zealand
o South Korea
o Rest of Asia Pacific
• South America
o Argentina
o Brazil
o Chile
o Rest of South America
• Middle East & Africa
o Saudi Arabia
o UAE
o Qatar
o South Africa
o Rest of Middle East & Africa
What our report offers:
- Market share assessments for the regional and country-level segments
- Strategic recommendations for the new entrants
- Covers Market data for the years 2021, 2022, 2023, 2026, and 2030
- Market Trends (Drivers, Constraints, Opportunities, Threats, Challenges, Investment Opportunities, and recommendations)
- Strategic recommendations in key business segments based on the market estimations
- Competitive landscaping mapping the key common trends
- Company profiling with detailed strategies, financials, and recent developments
- Supply chain trends mapping the latest technological advancements
Free Customization Offerings:
All the customers of this report will be entitled to receive one of the following free customization options:
• Company Profiling
o Comprehensive profiling of additional market players (up to 3)
o SWOT Analysis of key players (up to 3)
• Regional Segmentation
o Market estimations, Forecasts and CAGR of any prominent country as per the client's interest (Note: Depends on feasibility check)
• Competitive Benchmarking
o Benchmarking of key players based on product portfolio, geographical presence, and strategic alliances
Table of Contents
1 Executive Summary
2 Preface
2.1 Abstract
2.2 Stake Holders
2.3 Research Scope
2.4 Research Methodology
2.4.1 Data Mining
2.4.2 Data Analysis
2.4.3 Data Validation
2.4.4 Research Approach
2.5 Research Sources
2.5.1 Primary Research Sources
2.5.2 Secondary Research Sources
2.5.3 Assumptions
3 Market Trend Analysis
3.1 Introduction
3.2 Drivers
3.3 Restraints
3.4 Opportunities
3.5 Threats
3.6 Technology Analysis
3.7 Application Analysis
3.8 End User Analysis
3.9 Emerging Markets
3.10 Impact of Covid-19
4 Porters Five Force Analysis
4.1 Bargaining power of suppliers
4.2 Bargaining power of buyers
4.3 Threat of substitutes
4.4 Threat of new entrants
4.5 Competitive rivalry
5 Global Occupancy Sensors Market, By Connectivity Type
5.1 Introduction
5.2 Wired
5.3 Wireless
5.3.1 Wi-Fi
5.3.2 Bluetooth
5.3.3 Zigbee
5.3.4 Other Wireless
6 Global Occupancy Sensors Market, By Mounting Type
6.1 Introduction
6.2 Ceiling-mounted
6.3 Wall-mounted
6.4 In-wall
7 Global Occupancy Sensors Market, By Environment
7.1 Introduction
7.2 Indoor
7.3 Outdoor
8 Global Occupancy Sensors Market, By Coverage Area
8.1 Introduction
8.2 Less than 89 Degree
8.3 90 Degree-179 Degree
8.4 180 Degree-360 Degree
9 Global Occupancy Sensors Market, By Technology
9.1 Introduction
9.2 Passive Infrared (PIR)
9.3 Dual Technology
9.4 Microwave
9.5 Ultrasonic
9.6 Other Technologies
10 Global Occupancy Sensors Market, By Application
10.1 Introduction
10.2 Lighting Control
10.3 HVAC Control
10.4 Security and Surveillance
10.5 Energy Management
10.6 Other Applications
11 Global Occupancy Sensors Market, By End User
11.1 Introduction
11.2 Residential
11.3 Commercial
11.4 Healthcare
11.5 Hospitality
11.6 Industrial
11.7 Other End Users
12 Global Occupancy Sensors Market, By Geography
12.1 Introduction
12.2 North America
12.2.1 US
12.2.2 Canada
12.2.3 Mexico
12.3 Europe
12.3.1 Germany
12.3.2 UK
12.3.3 Italy
12.3.4 France
12.3.5 Spain
12.3.6 Rest of Europe
12.4 Asia Pacific
12.4.1 Japan
12.4.2 China
12.4.3 India
12.4.4 Australia
12.4.5 New Zealand
12.4.6 South Korea
12.4.7 Rest of Asia Pacific
12.5 South America
12.5.1 Argentina
12.5.2 Brazil
12.5.3 Chile
12.5.4 Rest of South America
12.6 Middle East & Africa
12.6.1 Saudi Arabia
12.6.2 UAE
12.6.3 Qatar
12.6.4 South Africa
12.6.5 Rest of Middle East & Africa
13 Key Developments
13.1 Agreements, Partnerships, Collaborations and Joint Ventures
13.2 Acquisitions & Mergers
13.3 New Product Launch
13.4 Expansions
13.5 Other Key Strategies
14 Company Profiling
14.1 Eaton Corporation
14.2 Hubbell Incorporated
14.3 Honeywell International Inc.
14.4 Panasonic Corporation
14.5 Novelda AS
14.6 Danlers Limited
14.7 Johnson Controls International PLC
14.8 Legrand
14.9 Siemens AG
14.10 Schneider Electric SE
14.11 Silicon Labs
14.12 Osram GmbH
14.13 Signify N.V.
14.14 Acuity Brands Inc.
14.15 Crestron Electronics Inc.
14.16 Lutron Electronics Corporation
14.17 Leviton Manufacturing Corporation
14.18 FIBARO
14.19 STEINEL
List of Tables
1 Global Occupancy Sensors Market Outlook, By Region (2021-2030) ($MN)
2 Global Occupancy Sensors Market Outlook, By Connectivity Type (2021-2030) ($MN)
3 Global Occupancy Sensors Market Outlook, By Wired (2021-2030) ($MN)
4 Global Occupancy Sensors Market Outlook, By Wireless (2021-2030) ($MN)
5 Global Occupancy Sensors Market Outlook, By Wi-Fi (2021-2030) ($MN)
6 Global Occupancy Sensors Market Outlook, By Bluetooth (2021-2030) ($MN)
7 Global Occupancy Sensors Market Outlook, By Zigbee (2021-2030) ($MN)
8 Global Occupancy Sensors Market Outlook, By Other Wireless (2021-2030) ($MN)
9 Global Occupancy Sensors Market Outlook, By Mounting Type (2021-2030) ($MN)
10 Global Occupancy Sensors Market Outlook, By Ceiling-mounted (2021-2030) ($MN)
11 Global Occupancy Sensors Market Outlook, By Wall-mounted (2021-2030) ($MN)
12 Global Occupancy Sensors Market Outlook, By In-wall (2021-2030) ($MN)
13 Global Occupancy Sensors Market Outlook, By Environment (2021-2030) ($MN)
14 Global Occupancy Sensors Market Outlook, By Indoor (2021-2030) ($MN)
15 Global Occupancy Sensors Market Outlook, By Outdoor (2021-2030) ($MN)
16 Global Occupancy Sensors Market Outlook, By Coverage Area (2021-2030) ($MN)
17 Global Occupancy Sensors Market Outlook, By Less than 89 Degree (2021-2030) ($MN)
18 Global Occupancy Sensors Market Outlook, By 90 Degree-179 Degree (2021-2030) ($MN)
19 Global Occupancy Sensors Market Outlook, By 180 Degree-360 Degree (2021-2030) ($MN)
20 Global Occupancy Sensors Market Outlook, By Technology (2021-2030) ($MN)
21 Global Occupancy Sensors Market Outlook, By Passive Infrared (PIR) (2021-2030) ($MN)
22 Global Occupancy Sensors Market Outlook, By Dual Technology (2021-2030) ($MN)
23 Global Occupancy Sensors Market Outlook, By Microwave (2021-2030) ($MN)
24 Global Occupancy Sensors Market Outlook, By Ultrasonic (2021-2030) ($MN)
25 Global Occupancy Sensors Market Outlook, By Other Technologies (2021-2030) ($MN)
26 Global Occupancy Sensors Market Outlook, By Application (2021-2030) ($MN)
27 Global Occupancy Sensors Market Outlook, By Lighting Control (2021-2030) ($MN)
28 Global Occupancy Sensors Market Outlook, By HVAC Control (2021-2030) ($MN)
29 Global Occupancy Sensors Market Outlook, By Security and Surveillance (2021-2030) ($MN)
30 Global Occupancy Sensors Market Outlook, By Energy Management (2021-2030) ($MN)
31 Global Occupancy Sensors Market Outlook, By Other Applications (2021-2030) ($MN)
32 Global Occupancy Sensors Market Outlook, By End User (2021-2030) ($MN)
33 Global Occupancy Sensors Market Outlook, By Residential (2021-2030) ($MN)
34 Global Occupancy Sensors Market Outlook, By Commercial (2021-2030) ($MN)
35 Global Occupancy Sensors Market Outlook, By Healthcare (2021-2030) ($MN)
36 Global Occupancy Sensors Market Outlook, By Hospitality (2021-2030) ($MN)
37 Global Occupancy Sensors Market Outlook, By Industrial (2021-2030) ($MN)
38 Global Occupancy Sensors Market Outlook, By Other End Users (2021-2030) ($MN)
Note: Tables for North America, Europe, APAC, South America, and Middle East & Africa Regions are also represented in the same manner as above.
List of Figures
RESEARCH METHODOLOGY

We at ‘Stratistics’ opt for an extensive research approach which involves data mining, data validation, and data analysis. The various research sources include in-house repository, secondary research, competitor’s sources, social media research, client internal data, and primary research.
Our team of analysts prefers the most reliable and authenticated data sources in order to perform the comprehensive literature search. With access to most of the authenticated data bases our team highly considers the best mix of information through various sources to obtain extensive and accurate analysis.
Each report takes an average time of a month and a team of 4 industry analysts. The time may vary depending on the scope and data availability of the desired market report. The various parameters used in the market assessment are standardized in order to enhance the data accuracy.
Data Mining
The data is collected from several authenticated, reliable, paid and unpaid sources and is filtered depending on the scope & objective of the research. Our reports repository acts as an added advantage in this procedure. Data gathering from the raw material suppliers, distributors and the manufacturers is performed on a regular basis, this helps in the comprehensive understanding of the products value chain. Apart from the above mentioned sources the data is also collected from the industry consultants to ensure the objective of the study is in the right direction.
Market trends such as technological advancements, regulatory affairs, market dynamics (Drivers, Restraints, Opportunities and Challenges) are obtained from scientific journals, market related national & international associations and organizations.
Data Analysis
From the data that is collected depending on the scope & objective of the research the data is subjected for the analysis. The critical steps that we follow for the data analysis include:
- Product Lifecycle Analysis
- Competitor analysis
- Risk analysis
- Porters Analysis
- PESTEL Analysis
- SWOT Analysis
The data engineering is performed by the core industry experts considering both the Marketing Mix Modeling and the Demand Forecasting. The marketing mix modeling makes use of multiple-regression techniques to predict the optimal mix of marketing variables. Regression factor is based on a number of variables and how they relate to an outcome such as sales or profits.
Data Validation
The data validation is performed by the exhaustive primary research from the expert interviews. This includes telephonic interviews, focus groups, face to face interviews, and questionnaires to validate our research from all aspects. The industry experts we approach come from the leading firms, involved in the supply chain ranging from the suppliers, distributors to the manufacturers and consumers so as to ensure an unbiased analysis.
We are in touch with more than 15,000 industry experts with the right mix of consultants, CEO's, presidents, vice presidents, managers, experts from both supply side and demand side, executives and so on.
The data validation involves the primary research from the industry experts belonging to:
- Leading Companies
- Suppliers & Distributors
- Manufacturers
- Consumers
- Industry/Strategic Consultants
Apart from the data validation the primary research also helps in performing the fill gap research, i.e. providing solutions for the unmet needs of the research which helps in enhancing the reports quality.
For more details about research methodology, kindly write to us at info@strategymrc.com
Frequently Asked Questions
In case of any queries regarding this report, you can contact the customer service by filing the “Inquiry Before Buy” form available on the right hand side. You may also contact us through email: info@strategymrc.com or phone: +1-301-202-5929
Yes, the samples are available for all the published reports. You can request them by filling the “Request Sample” option available in this page.
Yes, you can request a sample with your specific requirements. All the customized samples will be provided as per the requirement with the real data masked.
All our reports are available in Digital PDF format. In case if you require them in any other formats, such as PPT, Excel etc you can submit a request through “Inquiry Before Buy” form available on the right hand side. You may also contact us through email: info@strategymrc.com or phone: +1-301-202-5929
We offer a free 15% customization with every purchase. This requirement can be fulfilled for both pre and post sale. You may send your customization requirements through email at info@strategymrc.com or call us on +1-301-202-5929.
We have 3 different licensing options available in electronic format.
- Single User Licence: Allows one person, typically the buyer, to have access to the ordered product. The ordered product cannot be distributed to anyone else.
- 2-5 User Licence: Allows the ordered product to be shared among a maximum of 5 people within your organisation.
- Corporate License: Allows the product to be shared among all employees of your organisation regardless of their geographical location.
All our reports are typically be emailed to you as an attachment.
To order any available report you need to register on our website. The payment can be made either through CCAvenue or PayPal payments gateways which accept all international cards.
We extend our support to 6 months post sale. A post sale customization is also provided to cover your unmet needs in the report.
Request Customization
We offer complimentary customization of up to 15% with every purchase. To share your customization requirements, feel free to email us at info@strategymrc.com or call us on +1-301-202-5929. .
Please Note: Customization within the 15% threshold is entirely free of charge. If your request exceeds this limit, we will conduct a feasibility assessment. Following that, a detailed quote and timeline will be provided.
WHY CHOOSE US ?

Assured Quality
Best in class reports with high standard of research integrity

24X7 Research Support
Continuous support to ensure the best customer experience.

Free Customization
Adding more values to your product of interest.

Safe & Secure Access
Providing a secured environment for all online transactions.

Trusted by 600+ Brands
Serving the most reputed brands across the world.