
Oil And Gas Pumps Market
Oil & Gas Pumps Market Forecasts to 2028 - Global Analysis By Type (Submersible and Non-Submersible), By Pump Type (Centrifugal pump, Positive Displacement Pump, Cryogenic Pump and Other pump types), By Capacity (Small Up to 500 gpm, Medium 500-1,000 gpm and High More than 1,000 gpm), By Application (Upstream, Midstream and Downstream) and Geography

|
Years Covered |
2020-2028 |
|
Estimated Year Value (2022) |
US $7.75 BN |
|
Projected Year Value (2028) |
US $12.58 BN |
|
CAGR (2022 - 2028) |
8.4% |
|
Regions Covered |
North America, Europe, Asia Pacific, South America, and Middle East & Africa |
|
Countries Covered |
US, Canada, Mexico, Germany, UK, Italy, France, Spain, Japan, China, India, Australia, New Zealand, South Korea, Rest of Asia Pacific, South America, Argentina, Brazil, Chile, Middle East & Africa, Saudi Arabia, UAE, Qatar, and South Africa |
|
Largest Market |
Middle East and Africa |
|
Highest Growing Market |
North America |
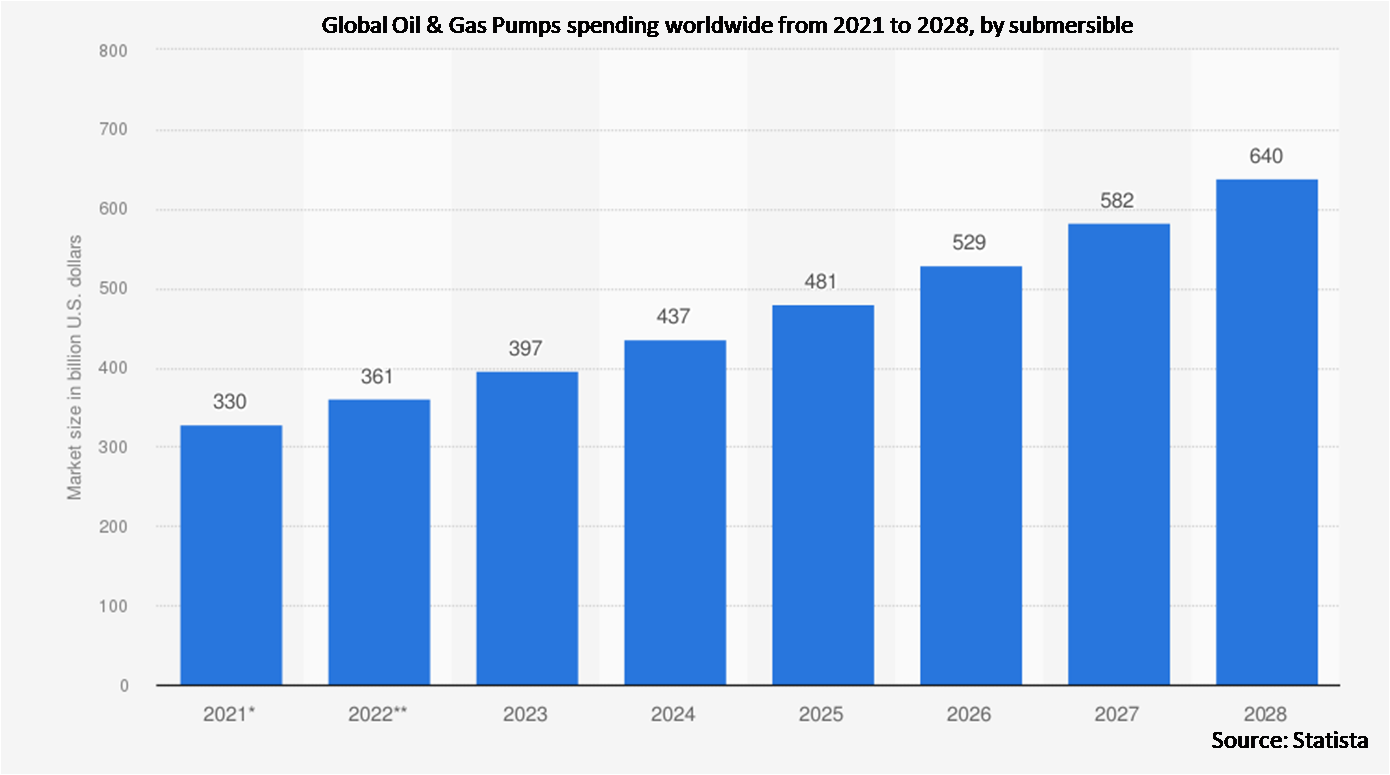
According to Stratistics MRC, the Global Oil and Gas Pumps Market is accounted for $7.75 billion in 2022 and is expected to reach $12.58 billion by 2028 growing at a CAGR of 8.4% during the forecast period. Oil and gas pumps refer to the range of pumps required for extracting, processing, and delivering oil and gas to associated equipment. These pumps are useful for extracting oil and gas from various reservoirs or fields and delivering it to various markets or even exporting it. The oil and gas industry is critical to the global economy. The oil and gas industry not only generates the majority of primary energy, but it also serves as a major supplier of raw materials for chemical products such as pharmaceuticals, solvents, fertilisers, pesticides, and plastics.
According to the Organization of Petroleum Exporting Countries (OPEC), demand for OPEC crude oil is expected to rise by more than 40 million barrels per day by the end of 2040, fueling energy demand.
Market Dynamics:
Driver:
Continuous shale development activities
Shale and oil sands are significant sources of energy in North America, Latin America, and Asia Pacific. With a series of discoveries and technological advances, shale is one of the fastest growing energy sectors. Despite the fact that drilling can extract a significant amount of oil and natural gas from reservoir rock, much of it remains trapped within the reservoir itself. As a result, shale reservoirs necessitate more intervention processes in order to maximise oil production. Shale developments in China, the United States, and Argentina boost well production in these countries. As a result, rising shale oil and gas production is likely to increase demand for oil and gas pumps.
Restraint:
Increasing focus on use of renewable energy
Increasing emphasis on the use of renewable energy over the last decade, the use of renewable energy has increased significantly in regions. This has been bolstered further by lower power generation costs and growing concerns about carbon emissions. According to the Energy Information Administration (EIA), the use of renewable energy is expected to increase by 40% between 2012 and 2018. The decrease in solar and wind farm construction costs as new technologies emerge, as well as the increased adoption of electric vehicles, are supporting this dramatic shift from conventional energy to renewable energy, which is hindering the market.
Opportunity:
Development of pipeline infrastructure
Infrastructure development and the midstream oil and gas sector necessitates a widely distributed network because distances can range from many acres for an intermediate or end terminal tank farm to entire continents for a pipeline system. SCADA systems, control systems, and safety systems in storage facilities, control centres, and corporate offices, as well as a fast and reliable communication infrastructure, are required to perform intranet integration. This demand has a high growth potential for midstream communication solutions.
Threat:
Stringent Regulations
As global emissions levels rise, governments around the world are imposing strict emission regulations on the oil and gas industry. The oil and gas industry, for instance, is the largest source of volatile organic compounds (VOCs) and methane. And, as the world's reliance on oil and gas for energy and transportation grows, emissions levels rise as a result of increased oil and gas production and consumption, restricting market growth.
Covid-19 Impact
The negative global effects of the coronavirus are already visible, and they will have a significant impact on the Oil & Gas pumps market. Exports and imports, global manufacturing, tourism, and the financial sectors have all suffered significantly. For about two months, China, the world's largest consumer of oil, gas, and refined petroleum products, was shut down. As a result, oil prices began to fall in February 2020. Furthermore, in March 2020, Saudi Arabia and Russia engaged in an oil price war in response to Russia's denial of cutting production in order to keep prices moderate. This lasted for days, causing oil prices to fall in the spring. Furthermore, the lockdown has hampered the import and export of various goods.
The Midstream segment is expected to be the largest during the forecast period
The midstream segment has the largest market share and is expected to have the largest share during the forecast period. And, it primarily includes refined products transported over land, crude oil transportation via a network of pipes and pumping stations, as well as trucks and rail cars, all of which contribute to the segment's growth.
The Centrifugal pump segment is expected to have the highest CAGR during the forecast period
Because of their functionality as a water and oil separator, centrifugal pump segment is expected to register highest CAGR during the forecast period. Centrifugal pumps are in high demand in the oil and gas industry. With rising crude oil demand, centrifugal pumps are finding increased use in crude oil transportation in a variety of countries. Oil and gas pump manufacturers are concentrating on the modification of centrifugal pumps, which can improve performance and save a significant amount of energy.
Region with largest share:
The Middle East and Africa are the most profitable markets for oil and gas pumps and are expected to be the largest region during the forecast period. Because the Middle East is home to many oil and gas companies, the demand for oil and gas pumps in the UAE, Qatar, and Saudi Arabia is expected to rise rapidly. Furthermore, investments in the oil and gas sector in high-crude oil producing regions are expected to drive market growth over the next few years.
Region with highest CAGR:
North America is expected to have the highest CAGR growth during the forecast period due to significant expansion in unconventional resources in countries such as the United States and Canada. Furthermore, the development of affordable shale gas exploration and extraction technology as well as a surge in demand from the onshore and offshore segments, particularly in the Gulf of Mexico, appear to have had a relatively positive impact on the market for oil and gas pumps over time.

Key players in the market
Some of the key players profiled in the Oil and Gas Pumps Market include Alfa Laval AB, Gardner Denver Holdings Inc, Xylem Inc., Flowserve Corporation, Sulzer, Weir Group, KSB, HMS Group, Nikkiso, Schmitt Kreiselpumpen, Trillium Flow Technologies, Corporacion E.G., Baker Hughes Company, Groman-Rupp, EBARA Corporation and Tsurumi Manufacturing Co., Ltd.
Key Developments:
In Sep 2020, Alfa Laval won a supply contract to supply Framo pumping systems for two Floating Production Storage and Offloading (FPSO) vessels which comprises marine pumping systems for seawater and firewater lift service, operating outside the coast of Brazil
In August 2019, GAIL India announced an investment of USD 4.4 billion in pipeline laying and another USD 1.6 billion in city gas distribution (CGD) networks
In May 2019, Weir Oil & Gas has introduced SPM EXL Frac pump, a quintuplex pump designed for harsh fracking conditions
Types Covered:
• Submersible
• Non-Submersible
Pump Types Covered:
• Centrifugal pump
• Positive Displacement Pump
• Cryogenic Pump
• Other Pump Types
Capacities Covered:
• Small (Up to 500 gpm)
• Medium (500-1,000 gpm)
• High (More than 1,000 gpm)
Applications Covered:
• Upstream
• Midstream
• Downstream
Regions Covered:
• North America
o US
o Canada
o Mexico
• Europe
o Germany
o UK
o Italy
o France
o Spain
o Rest of Europe
• Asia Pacific
o Japan
o China
o India
o Australia
o New Zealand
o South Korea
o Rest of Asia Pacific
• South America
o Argentina
o Brazil
o Chile
o Rest of South America
• Middle East & Africa
o Saudi Arabia
o UAE
o Qatar
o South Africa
o Rest of Middle East & Africa
What our report offers:
- Market share assessments for the regional and country-level segments
- Strategic recommendations for the new entrants
- Covers Market data for the years 2020, 2021, 2022, 2025, and 2028
- Market Trends (Drivers, Constraints, Opportunities, Threats, Challenges, Investment Opportunities, and recommendations)
- Strategic recommendations in key business segments based on the market estimations
- Competitive landscaping mapping the key common trends
- Company profiling with detailed strategies, financials, and recent developments
- Supply chain trends mapping the latest technological advancements
Free Customization Offerings:
All the customers of this report will be entitled to receive one of the following free customization options:
• Company Profiling
o Comprehensive profiling of additional market players (up to 3)
o SWOT Analysis of key players (up to 3)
• Regional Segmentation
o Market estimations, Forecasts and CAGR of any prominent country as per the client's interest (Note: Depends on feasibility check)
• Competitive Benchmarking
o Benchmarking of key players based on product portfolio, geographical presence, and strategic alliances
Table of Contents
1 Executive Summary
2 Preface
2.1 Abstract
2.2 Stake Holders
2.3 Research Scope
2.4 Research Methodology
2.4.1 Data Mining
2.4.2 Data Analysis
2.4.3 Data Validation
2.4.4 Research Approach
2.5 Research Sources
2.5.1 Primary Research Sources
2.5.2 Secondary Research Sources
2.5.3 Assumptions
3 Market Trend Analysis
3.1 Introduction
3.2 Drivers
3.3 Restraints
3.4 Opportunities
3.5 Threats
3.6 Application Analysis
3.7 Emerging Markets
3.8 Impact of Covid-19
4 Porters Five Force Analysis
4.1 Bargaining power of suppliers
4.2 Bargaining power of buyers
4.3 Threat of substitutes
4.4 Threat of new entrants
4.5 Competitive rivalry
5 Global Oil & Gas Pumps Market, By Type
5.1 Introduction
5.2 Submersible
5.3 Non-Submersible
6 Global Oil & Gas Pumps Market, By Pump Type
6.1 Introduction
6.2 Centrifugal pump
6.3 Positive Displacement Pump
6.4 Cryogenic Pump
6.5 Other Pump Types
7 Global Oil & Gas Pumps Market Outlook, By Capacity
7.1 Introduction
7.2 Small (Up to 500 gpm)
7.3 Medium (500-1,000 gpm)
7.4 High (More than 1,000 gpm)
8 Global Oil & Gas Pumps Market, By Application
8.1 Introduction
8.2 Upstream
8.3 Midstream
8.4 Downstream
9 Global Oil & Gas Pumps Market, By Geography
9.1 Introduction
9.2 North America
9.2.1 US
9.2.2 Canada
9.2.3 Mexico
9.3 Europe
9.3.1 Germany
9.3.2 UK
9.3.3 Italy
9.3.4 France
9.3.5 Spain
9.3.6 Rest of Europe
9.4 Asia Pacific
9.4.1 Japan
9.4.2 China
9.4.3 India
9.4.4 Australia
9.4.5 New Zealand
9.4.6 South Korea
9.4.7 Rest of Asia Pacific
9.5 South America
9.5.1 Argentina
9.5.2 Brazil
9.5.3 Chile
9.5.4 Rest of South America
9.6 Middle East & Africa
9.6.1 Saudi Arabia
9.6.2 UAE
9.6.3 Qatar
9.6.4 South Africa
9.6.5 Rest of Middle East & Africa
10 Key Developments
10.1 Agreements, Partnerships, Collaborations and Joint Ventures
10.2 Acquisitions & Mergers
10.3 New Product Launch
10.4 Expansions
10.5 Other Key Strategies
11 Company Profiling
11.1 Alfa Laval AB
11.2 Gardner Denver Holdings Inc
11.3 Xylem Inc.
11.4 Flowserve Corporation
11.5 Sulzer
11.6 Weir Group
11.7 KSB
11.8 HMS Group
11.9 Nikkiso
11.10 Schmitt Kreiselpumpen
11.11 Trillium Flow Technologies
11.12 Corporacion E.G.
11.13 Baker Hughes Company
11.14 Groman-Rupp
11.15 EBARA Corporation
11.16 Tsurumi Manufacturing Co., Ltd.
List of Tables
1 Global Oil & Gas Pumps Market Outlook, By Region (2020-2028) ($MN)
2 Global Oil & Gas Pumps Market Outlook, By Type (2020-2028) ($MN)
3 Global Oil & Gas Pumps Market Outlook, By Submersible (2020-2028) ($MN)
4 Global Oil & Gas Pumps Market Outlook, By Non-Submersible (2020-2028) ($MN)
5 Global Oil & Gas Pumps Market Outlook, By Pump Type (2020-2028) ($MN)
6 Global Oil & Gas Pumps Market Outlook, By Centrifugal pump (2020-2028) ($MN)
7 Global Oil & Gas Pumps Market Outlook, By Positive Displacement Pump (2020-2028) ($MN)
8 Global Oil & Gas Pumps Market Outlook, By Cryogenic Pump (2020-2028) ($MN)
9 Global Oil & Gas Pumps Market Outlook, By Other Pump Types (2020-2028) ($MN)
10 Global Oil & Gas Pumps Market Outlook, By Capacity (2020-2028) ($MN)
11 Global Oil & Gas Pumps Market Outlook, By Small (Up to 500 gpm) (2020-2028) ($MN)
12 Global Oil & Gas Pumps Market Outlook, By Medium (500-1,000 gpm) (2020-2028) ($MN)
13 Global Oil & Gas Pumps Market Outlook, By High (More than 1,000 gpm) (2020-2028) ($MN)
14 Global Oil & Gas Pumps Market Outlook, By Application (2020-2028) ($MN)
15 Global Oil & Gas Pumps Market Outlook, By Upstream (2020-2028) ($MN)
16 Global Oil & Gas Pumps Market Outlook, By Midstream (2020-2028) ($MN)
17 Global Oil & Gas Pumps Market Outlook, By Downstream (2020-2028) ($MN)
18 North America Oil & Gas Pumps Market Outlook, By Country (2020-2028) ($MN)
19 North America Oil & Gas Pumps Market Outlook, By Type (2020-2028) ($MN)
20 North America Oil & Gas Pumps Market Outlook, By Submersible (2020-2028) ($MN)
21 North America Oil & Gas Pumps Market Outlook, By Non-Submersible (2020-2028) ($MN)
22 North America Oil & Gas Pumps Market Outlook, By Pump Type (2020-2028) ($MN)
23 North America Oil & Gas Pumps Market Outlook, By Centrifugal pump (2020-2028) ($MN)
24 North America Oil & Gas Pumps Market Outlook, By Positive Displacement Pump (2020-2028) ($MN)
25 North America Oil & Gas Pumps Market Outlook, By Cryogenic Pump (2020-2028) ($MN)
26 North America Oil & Gas Pumps Market Outlook, By Other Pump Types (2020-2028) ($MN)
27 North America Oil & Gas Pumps Market Outlook, By Capacity (2020-2028) ($MN)
28 North America Oil & Gas Pumps Market Outlook, By Small (Up to 500 gpm) (2020-2028) ($MN)
29 North America Oil & Gas Pumps Market Outlook, By Medium (500-1,000 gpm) (2020-2028) ($MN)
30 North America Oil & Gas Pumps Market Outlook, By High (More than 1,000 gpm) (2020-2028) ($MN)
31 North America Oil & Gas Pumps Market Outlook, By Application (2020-2028) ($MN)
32 North America Oil & Gas Pumps Market Outlook, By Upstream (2020-2028) ($MN)
33 North America Oil & Gas Pumps Market Outlook, By Midstream (2020-2028) ($MN)
34 North America Oil & Gas Pumps Market Outlook, By Downstream (2020-2028) ($MN)
35 Europe Oil & Gas Pumps Market Outlook, By Country (2020-2028) ($MN)
36 Europe Oil & Gas Pumps Market Outlook, By Type (2020-2028) ($MN)
37 Europe Oil & Gas Pumps Market Outlook, By Submersible (2020-2028) ($MN)
38 Europe Oil & Gas Pumps Market Outlook, By Non-Submersible (2020-2028) ($MN)
39 Europe Oil & Gas Pumps Market Outlook, By Pump Type (2020-2028) ($MN)
40 Europe Oil & Gas Pumps Market Outlook, By Centrifugal pump (2020-2028) ($MN)
41 Europe Oil & Gas Pumps Market Outlook, By Positive Displacement Pump (2020-2028) ($MN)
42 Europe Oil & Gas Pumps Market Outlook, By Cryogenic Pump (2020-2028) ($MN)
43 Europe Oil & Gas Pumps Market Outlook, By Other Pump Types (2020-2028) ($MN)
44 Europe Oil & Gas Pumps Market Outlook, By Capacity (2020-2028) ($MN)
45 Europe Oil & Gas Pumps Market Outlook, By Small (Up to 500 gpm) (2020-2028) ($MN)
46 Europe Oil & Gas Pumps Market Outlook, By Medium (500-1,000 gpm) (2020-2028) ($MN)
47 Europe Oil & Gas Pumps Market Outlook, By High (More than 1,000 gpm) (2020-2028) ($MN)
48 Europe Oil & Gas Pumps Market Outlook, By Application (2020-2028) ($MN)
49 Europe Oil & Gas Pumps Market Outlook, By Upstream (2020-2028) ($MN)
50 Europe Oil & Gas Pumps Market Outlook, By Midstream (2020-2028) ($MN)
51 Europe Oil & Gas Pumps Market Outlook, By Downstream (2020-2028) ($MN)
52 Asia Pacific Oil & Gas Pumps Market Outlook, By Country (2020-2028) ($MN)
53 Asia Pacific Oil & Gas Pumps Market Outlook, By Type (2020-2028) ($MN)
54 Asia Pacific Oil & Gas Pumps Market Outlook, By Submersible (2020-2028) ($MN)
55 Asia Pacific Oil & Gas Pumps Market Outlook, By Non-Submersible (2020-2028) ($MN)
56 Asia Pacific Oil & Gas Pumps Market Outlook, By Pump Type (2020-2028) ($MN)
57 Asia Pacific Oil & Gas Pumps Market Outlook, By Centrifugal pump (2020-2028) ($MN)
58 Asia Pacific Oil & Gas Pumps Market Outlook, By Positive Displacement Pump (2020-2028) ($MN)
59 Asia Pacific Oil & Gas Pumps Market Outlook, By Cryogenic Pump (2020-2028) ($MN)
60 Asia Pacific Oil & Gas Pumps Market Outlook, By Other Pump Types (2020-2028) ($MN)
61 Asia Pacific Oil & Gas Pumps Market Outlook, By Capacity (2020-2028) ($MN)
62 Asia Pacific Oil & Gas Pumps Market Outlook, By Small (Up to 500 gpm) (2020-2028) ($MN)
63 Asia Pacific Oil & Gas Pumps Market Outlook, By Medium (500-1,000 gpm) (2020-2028) ($MN)
64 Asia Pacific Oil & Gas Pumps Market Outlook, By High (More than 1,000 gpm) (2020-2028) ($MN)
65 Asia Pacific Oil & Gas Pumps Market Outlook, By Application (2020-2028) ($MN)
66 Asia Pacific Oil & Gas Pumps Market Outlook, By Upstream (2020-2028) ($MN)
67 Asia Pacific Oil & Gas Pumps Market Outlook, By Midstream (2020-2028) ($MN)
68 Asia Pacific Oil & Gas Pumps Market Outlook, By Downstream (2020-2028) ($MN)
69 South America Oil & Gas Pumps Market Outlook, By Country (2020-2028) ($MN)
70 South America Oil & Gas Pumps Market Outlook, By Type (2020-2028) ($MN)
71 South America Oil & Gas Pumps Market Outlook, By Submersible (2020-2028) ($MN)
72 South America Oil & Gas Pumps Market Outlook, By Non-Submersible (2020-2028) ($MN)
73 South America Oil & Gas Pumps Market Outlook, By Pump Type (2020-2028) ($MN)
74 South America Oil & Gas Pumps Market Outlook, By Centrifugal pump (2020-2028) ($MN)
75 South America Oil & Gas Pumps Market Outlook, By Positive Displacement Pump (2020-2028) ($MN)
76 South America Oil & Gas Pumps Market Outlook, By Cryogenic Pump (2020-2028) ($MN)
77 South America Oil & Gas Pumps Market Outlook, By Other Pump Types (2020-2028) ($MN)
78 South America Oil & Gas Pumps Market Outlook, By Capacity (2020-2028) ($MN)
79 South America Oil & Gas Pumps Market Outlook, By Small (Up to 500 gpm) (2020-2028) ($MN)
80 South America Oil & Gas Pumps Market Outlook, By Medium (500-1,000 gpm) (2020-2028) ($MN)
81 South America Oil & Gas Pumps Market Outlook, By High (More than 1,000 gpm) (2020-2028) ($MN)
82 South America Oil & Gas Pumps Market Outlook, By Application (2020-2028) ($MN)
83 South America Oil & Gas Pumps Market Outlook, By Upstream (2020-2028) ($MN)
84 South America Oil & Gas Pumps Market Outlook, By Midstream (2020-2028) ($MN)
85 South America Oil & Gas Pumps Market Outlook, By Downstream (2020-2028) ($MN)
86 Middle East & Africa Oil & Gas Pumps Market Outlook, By Country (2020-2028) ($MN)
87 Middle East & Africa Oil & Gas Pumps Market Outlook, By Type (2020-2028) ($MN)
88 Middle East & Africa Oil & Gas Pumps Market Outlook, By Submersible (2020-2028) ($MN)
89 Middle East & Africa Oil & Gas Pumps Market Outlook, By Non-Submersible (2020-2028) ($MN)
90 Middle East & Africa Oil & Gas Pumps Market Outlook, By Pump Type (2020-2028) ($MN)
91 Middle East & Africa Oil & Gas Pumps Market Outlook, By Centrifugal pump (2020-2028) ($MN)
92 Middle East & Africa Oil & Gas Pumps Market Outlook, By Positive Displacement Pump (2020-2028) ($MN)
93 Middle East & Africa Oil & Gas Pumps Market Outlook, By Cryogenic Pump (2020-2028) ($MN)
94 Middle East & Africa Oil & Gas Pumps Market Outlook, By Other Pump Types (2020-2028) ($MN)
95 Middle East & Africa Oil & Gas Pumps Market Outlook, By Capacity (2020-2028) ($MN)
96 Middle East & Africa Oil & Gas Pumps Market Outlook, By Small (Up to 500 gpm) (2020-2028) ($MN)
97 Middle East & Africa Oil & Gas Pumps Market Outlook, By Medium (500-1,000 gpm) (2020-2028) ($MN)
98 Middle East & Africa Oil & Gas Pumps Market Outlook, By High (More than 1,000 gpm) (2020-2028) ($MN)
99 Middle East & Africa Oil & Gas Pumps Market Outlook, By Application (2020-2028) ($MN)
100 Middle East & Africa Oil & Gas Pumps Market Outlook, By Upstream (2020-2028) ($MN)
101 Middle East & Africa Oil & Gas Pumps Market Outlook, By Midstream (2020-2028) ($MN)
102 Middle East & Africa Oil & Gas Pumps Market Outlook, By Downstream (2020-2028) ($MN)
List of Figures
RESEARCH METHODOLOGY

We at ‘Stratistics’ opt for an extensive research approach which involves data mining, data validation, and data analysis. The various research sources include in-house repository, secondary research, competitor’s sources, social media research, client internal data, and primary research.
Our team of analysts prefers the most reliable and authenticated data sources in order to perform the comprehensive literature search. With access to most of the authenticated data bases our team highly considers the best mix of information through various sources to obtain extensive and accurate analysis.
Each report takes an average time of a month and a team of 4 industry analysts. The time may vary depending on the scope and data availability of the desired market report. The various parameters used in the market assessment are standardized in order to enhance the data accuracy.
Data Mining
The data is collected from several authenticated, reliable, paid and unpaid sources and is filtered depending on the scope & objective of the research. Our reports repository acts as an added advantage in this procedure. Data gathering from the raw material suppliers, distributors and the manufacturers is performed on a regular basis, this helps in the comprehensive understanding of the products value chain. Apart from the above mentioned sources the data is also collected from the industry consultants to ensure the objective of the study is in the right direction.
Market trends such as technological advancements, regulatory affairs, market dynamics (Drivers, Restraints, Opportunities and Challenges) are obtained from scientific journals, market related national & international associations and organizations.
Data Analysis
From the data that is collected depending on the scope & objective of the research the data is subjected for the analysis. The critical steps that we follow for the data analysis include:
- Product Lifecycle Analysis
- Competitor analysis
- Risk analysis
- Porters Analysis
- PESTEL Analysis
- SWOT Analysis
The data engineering is performed by the core industry experts considering both the Marketing Mix Modeling and the Demand Forecasting. The marketing mix modeling makes use of multiple-regression techniques to predict the optimal mix of marketing variables. Regression factor is based on a number of variables and how they relate to an outcome such as sales or profits.
Data Validation
The data validation is performed by the exhaustive primary research from the expert interviews. This includes telephonic interviews, focus groups, face to face interviews, and questionnaires to validate our research from all aspects. The industry experts we approach come from the leading firms, involved in the supply chain ranging from the suppliers, distributors to the manufacturers and consumers so as to ensure an unbiased analysis.
We are in touch with more than 15,000 industry experts with the right mix of consultants, CEO's, presidents, vice presidents, managers, experts from both supply side and demand side, executives and so on.
The data validation involves the primary research from the industry experts belonging to:
- Leading Companies
- Suppliers & Distributors
- Manufacturers
- Consumers
- Industry/Strategic Consultants
Apart from the data validation the primary research also helps in performing the fill gap research, i.e. providing solutions for the unmet needs of the research which helps in enhancing the reports quality.
For more details about research methodology, kindly write to us at info@strategymrc.com
Frequently Asked Questions
In case of any queries regarding this report, you can contact the customer service by filing the “Inquiry Before Buy” form available on the right hand side. You may also contact us through email: info@strategymrc.com or phone: +1-301-202-5929
Yes, the samples are available for all the published reports. You can request them by filling the “Request Sample” option available in this page.
Yes, you can request a sample with your specific requirements. All the customized samples will be provided as per the requirement with the real data masked.
All our reports are available in Digital PDF format. In case if you require them in any other formats, such as PPT, Excel etc you can submit a request through “Inquiry Before Buy” form available on the right hand side. You may also contact us through email: info@strategymrc.com or phone: +1-301-202-5929
We offer a free 15% customization with every purchase. This requirement can be fulfilled for both pre and post sale. You may send your customization requirements through email at info@strategymrc.com or call us on +1-301-202-5929.
We have 3 different licensing options available in electronic format.
- Single User Licence: Allows one person, typically the buyer, to have access to the ordered product. The ordered product cannot be distributed to anyone else.
- 2-5 User Licence: Allows the ordered product to be shared among a maximum of 5 people within your organisation.
- Corporate License: Allows the product to be shared among all employees of your organisation regardless of their geographical location.
All our reports are typically be emailed to you as an attachment.
To order any available report you need to register on our website. The payment can be made either through CCAvenue or PayPal payments gateways which accept all international cards.
We extend our support to 6 months post sale. A post sale customization is also provided to cover your unmet needs in the report.
Request Customization
We offer complimentary customization of up to 15% with every purchase. To share your customization requirements, feel free to email us at info@strategymrc.com or call us on +1-301-202-5929. .
Please Note: Customization within the 15% threshold is entirely free of charge. If your request exceeds this limit, we will conduct a feasibility assessment. Following that, a detailed quote and timeline will be provided.
WHY CHOOSE US ?

Assured Quality
Best in class reports with high standard of research integrity

24X7 Research Support
Continuous support to ensure the best customer experience.

Free Customization
Adding more values to your product of interest.

Safe & Secure Access
Providing a secured environment for all online transactions.

Trusted by 600+ Brands
Serving the most reputed brands across the world.