
Operational Technology Market
Operational Technology Market Forecasts to 2030 - Global Analysis By Component (Human-machine Interface, Control Systems, Field Instruments and Other Components), Networking Technology (Wired, Wireless and Other Networking Technologies), Organization Size (Large Enterprises, Small and Medium Enterprises (SMEs) and Other Organization Sizes), Deployment Mode (On-Premise, Cloud), End User and By Geography

|
Years Covered |
2021-2030 |
|
Estimated Year Value (2023) |
US $171.40 BN |
|
Projected Year Value (2030) |
US $303.40 BN |
|
CAGR (2023 - 2030) |
8.5% |
|
Regions Covered |
North America, Europe, Asia Pacific, South America, and Middle East & Africa |
|
Countries Covered |
US, Canada, Mexico, Germany, UK, Italy, France, Spain, Japan, China, India, Australia, New Zealand, South Korea, Rest of Asia Pacific, South America, Argentina, Brazil, Chile, Middle East & Africa, Saudi Arabia, UAE, Qatar, and South Africa |
|
Largest Market |
North America |
|
Highest Growing Market |
Asia Pacific |
According to Stratistics MRC, the Global Operational Technology Market is accounted for $171.40 billion in 2023 and is expected to reach $303.40 billion by 2030 growing at a CAGR of 8.5% during the forecast period. Operational technology is a group of communication and computing systems used to manage, watch over, and manage industrial operations with a focus on the physical equipment and procedures they employ. The management of the assets used in industrial processes and manufacturing is aided by this technology. It also includes the hardware and software that maintain the functionality of the equipment in factories, power plants, and other facilities, etc. Moreover, the use of operation technology is widespread across a wide range of industries, including manufacturing, oil and gas, electrical generation and distribution, transportation (air, land, and sea), and utilities.
According to the American Hospital Association (AHA), there are 931,203 hospital beds in the country, and with 15 to 20 medical devices per hospital room, this means that millions of medical devices are linked to the network.
Market Dynamics:
Driver:
Growing interest in industrial automation
Industries have realized the value of industrial automation in their search for operational excellence and cost reduction. Automation increases process effectiveness, lowers human error rates, and enables seamless integration between various production chain components. As a result, there has been an increase in the deployment of OT solutions that enable industrial automation, ranging from advanced supervisory control and data acquisition (SCADA) systems to programmable logic controllers (PLCs).
Restraint:
Insufficient skilled workforce
A specialized skill set that combines familiarity with both current digital technologies and historical industrial processes is needed for the integration of IT and OT. Finding and keeping skilled workers with knowledge of both domains can be difficult, which can cause delays in the implementation of OT initiatives and have an impact on overall productivity. Additionally, as more industries embrace digital transformation for improved operational efficiency, there is a rapid rise in the demand for such skilled workers.
Opportunity:
Increasing productivity
The combination of IT and OT enables businesses to quickly make informed decisions by enabling the collection of real-time data from various processes and equipment. Tools for advanced analytics and data visualization make it easier to identify operational bottlenecks and make prompt adjustments for process optimization. Moreover, companies can implement predictive maintenance and automation to proactively address problems, reduce downtime, and maximize operational productivity, which increases overall efficiency and market competitiveness.
Threat:
Security flaws in the internet
Industrial systems are more vulnerable to cyber attacks as a result of the convergence of IT and OT. Malicious actors targeting critical infrastructure run the risk of causing operational hiccups, data breaches, and safety risks, necessitating strict cybersecurity precautions and ongoing surveillance of the network to identify and quickly address potential cyber incidents. However, in order to protect against evolving cyber threats in the operational technology landscape, it is crucial to implement multi-layered security protocols, conduct regular security assessments, and provide employee cybersecurity training.
Covid-19 Impact:
The Operational Technology (OT) market was significantly impacted by the COVID-19 pandemic. Many industries initially experienced operational disruptions as a result of lockdowns and restrictions, which had an impact on supply chains and production. To improve remote monitoring, predictive maintenance, and automation, businesses invested in OT solutions as a result of the pandemic, which hastened the adoption of digital transformation. Additionally, the significance of OT in enabling business continuity and enhancing resilience became clear as the world managed the crisis, prompting an increase in investments in cybersecurity measures to address the growing cyberthreats.
The Control Systems segment is expected to be the largest during the forecast period
During the forecast period, Control Systems is anticipated to hold the largest share. The management, regulation, efficient automation, and optimization of industrial processes are made possible by control systems. As the backbone of operational technology, these systems monitor and regulate a variety of manufacturing and production processes. They include Supervisory Control and Data Acquisition (SCADA), Programmable Logic Controller (PLC), and Distributed Control Systems (DCS) systems, which collectively improve productivity, reliability, and safety in various industries. Moreover, control systems continue to dominate the market for operational technology, driving advancements as digital transformation and IoT integration become more widely used.
The Small and Medium Enterprises (SMEs) segment is expected to have the highest CAGR during the forecast period
During the forecast period, the operational technology market's Small and Medium Enterprises (SMEs) segment is expected to have the highest CAGR. In recent years, SMEs have realized how operational technology has the power to transform industries and how it affects their ability to compete globally. SMEs are increasingly investing in scalable and economical OT solutions that are tailored to their particular needs, despite having smaller budgets than large corporations. Additionally, SMEs can now access cutting-edge technologies without making sizable upfront investments thanks to the adoption of subscription-based models and cloud-based OT platforms.
Region with largest share:
The North American region is expected to have the largest market share for operational technology (OT) during the anticipated period. The region's dominance was attributed to a number of elements, including its established industrial sectors like manufacturing, oil and gas, and utilities, which have embraced digital transformation to optimize operations. Moreover, demand for OT technologies has been fueled by significant investments in smart manufacturing and Industrial Internet of Things (IIoT) solutions in the United States, a major center for technological innovation and adoption. A further factor in the widespread adoption of OT solutions across different industries is the region's regulatory environment and focus on enhancing cybersecurity measures.
Region with highest CAGR:
During the anticipated period, the Operational Technology (OT) market is anticipated to grow at the highest CAGR in the Asia-Pacific region. Numerous factors, including the quick industrialization of nations like China and India as well as the expanding use of automation and smart manufacturing technologies, were cited as the main causes of the region's impressive CAGR. Moreover, the need for OT solutions to improve efficiency, lower operating costs, and guarantee compliance with changing regulations increased significantly as Asia-Pacific continued to advance in a variety of industries, including manufacturing, energy, and transportation. The region has made significant investments in cutting-edge technologies and has placed a strong emphasis on digital transformation, both of which have fueled the growth of the OT market.

Key players in the market
Some of the key players in Operational Technology market include Broadcom Inc, Fuji Electric Co., LTD, ABB Ltd., Siemens AG, Emerson Electric Co., Hitachi Ltd, General Electric Company, Oracle Corporation, IBM, Cisco System, Inc., Yokogawa Electric Corporation, Omron Corporation, Honeywell International Inc., Microsoft Corporation , Thales Group , Tesco Controls, Schneider Electric Ltd, Rockwell Automation, Mitsubishi Electric Corporation and Advantech CO.Ltd
Key Developments:
In February 2023, Oracle Corporation announced it was going to invest $1.5 billion into the Kingdom of Saudi Arabia as a part of the ongoing tech investment in the country. As a part of the investment, Oracle will be opening a data centre in the country's capital, Riyadh.
In July 2022, Rockwell Automation Inc. announced the partnership with Dragos to improve operational technology incident response readiness to help industrial organizations prepare for, respond to, and recover from cyber incidents in operational technology (OT) environments.
In January 2022, ABB and Red Hat announced the partnership to deliver ABB automation and industrial software solutions at the intersection of operational technology (OT) and information technology (IT), equipping the industrial ecosystem with extended deployment capabilities and greater agility.
Components Covered:
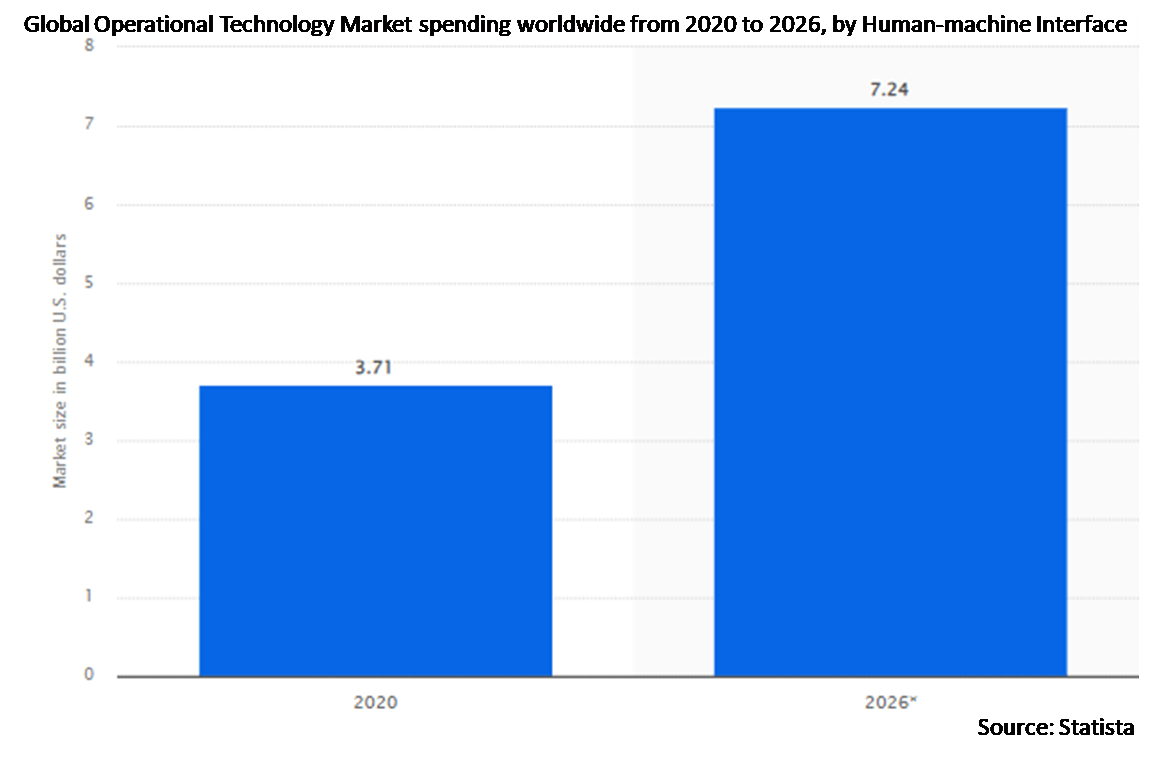
• Human-machine Interface
• Control Systems
• Field Instruments
• Other Components
Networking Technologies Covered:
• Wired
• Wireless
• Other Networking Technologies
Organization Sizes Covered:
• Large Enterprises
• Small and Medium Enterprises (SMEs)
• Other Organization Sizes
Deployment Modes Covered:
• On-Premise
• Cloud
End Users Covered:
• Process Industry
• Discrete Industry
• Other End Users
Regions Covered:
• North America
o US
o Canada
o Mexico
• Europe
o Germany
o UK
o Italy
o France
o Spain
o Rest of Europe
• Asia Pacific
o Japan
o China
o India
o Australia
o New Zealand
o South Korea
o Rest of Asia Pacific
• South America
o Argentina
o Brazil
o Chile
o Rest of South America
• Middle East & Africa
o Saudi Arabia
o UAE
o Qatar
o South Africa
o Rest of Middle East & Africa
What our report offers:
- Market share assessments for the regional and country-level segments
- Strategic recommendations for the new entrants
- Covers Market data for the years 2021, 2022, 2023, 2026, and 2030
- Market Trends (Drivers, Constraints, Opportunities, Threats, Challenges, Investment Opportunities, and recommendations)
- Strategic recommendations in key business segments based on the market estimations
- Competitive landscaping mapping the key common trends
- Company profiling with detailed strategies, financials, and recent developments
- Supply chain trends mapping the latest technological advancements
Free Customization Offerings:
All the customers of this report will be entitled to receive one of the following free customization options:
• Company Profiling
o Comprehensive profiling of additional market players (up to 3)
o SWOT Analysis of key players (up to 3)
• Regional Segmentation
o Market estimations, Forecasts and CAGR of any prominent country as per the client's interest (Note: Depends on feasibility check)
• Competitive Benchmarking
Benchmarking of key players based on product portfolio, geographical presence, and strategic alliances
Table of Contents
1 Executive Summary
2 Preface
2.1 Abstract
2.2 Stake Holders
2.3 Research Scope
2.4 Research Methodology
2.4.1 Data Mining
2.4.2 Data Analysis
2.4.3 Data Validation
2.4.4 Research Approach
2.5 Research Sources
2.5.1 Primary Research Sources
2.5.2 Secondary Research Sources
2.5.3 Assumptions
3 Market Trend Analysis
3.1 Introduction
3.2 Drivers
3.3 Restraints
3.4 Opportunities
3.5 Threats
3.6 End User Analysis
3.7 Emerging Markets
3.8 Impact of Covid-19
4 Porters Five Force Analysis
4.1 Bargaining power of suppliers
4.2 Bargaining power of buyers
4.3 Threat of substitutes
4.4 Threat of new entrants
4.5 Competitive rivalry
5 Global Operational Technology Market, By Component
5.1 Introduction
5.2 Human-machine Interface
5.2.1 Industrial Valves
5.2.2 Transmitters
5.2.3 Industrial Sensors
5.2.4 Actuators
5.3 Control Systems
5.3.1 Supervisory Control and Data Acquisition (SCADA)
5.3.2 Manufacturing Execution System (MES)
5.3.3 Warehouse Management System (WMS)
5.3.4 Distributed Control System (DCS)
5.3.5 Process Control Domains (PCD)
5.3.6 Programmable Logic Controllers (PLC)
5.3.7 Human Machine Interface (HMI)
5.3.8 Safety Instrumented Systems (SIS)
5.3.9 Building Management/Automation Systems (BAS)
5.3.10 Functional Safety
5.4 Field Instruments
5.5 Other Components
6 Global Operational Technology Market, By Networking Technology
6.1 Introduction
6.2 Wired
6.3 Wireless
6.4 Other Networking Technologies
7 Global Operational Technology Market, By Organization Size
7.1 Introduction
7.2 Large Enterprises
7.3 Small and Medium Enterprises (SMEs)
7.4 Other Organization Sizes
8 Global Operational Technology Market, By Deployment Mode
8.1 Introduction
8.2 On-Premise
8.3 Cloud
9 Global Operational Technology Market, By End User
9.1 Introduction
9.2 Process Industry
9.2.1 Oil & Gas
9.2.2 Food & Beverages
9.2.3 Pharmaceuticals
9.2.4 Chemicals
9.2.5 Energy & Power
9.2.6 Metals & Mining
9.2.7 Pulp & Paper
9.3 Discrete Industry
9.3.1 Automotive
9.3.2 Aerospace & Defense
9.3.3 Semiconductor & Electronics
9.3.4 Medical Devices
9.3.5 Machine Manufacturing
9.4 Other End Users
10 Global Operational Technology Market, By Geography
10.1 Introduction
10.2 North America
10.2.1 US
10.2.2 Canada
10.2.3 Mexico
10.3 Europe
10.3.1 Germany
10.3.2 UK
10.3.3 Italy
10.3.4 France
10.3.5 Spain
10.3.6 Rest of Europe
10.4 Asia Pacific
10.4.1 Japan
10.4.2 China
10.4.3 India
10.4.4 Australia
10.4.5 New Zealand
10.4.6 South Korea
10.4.7 Rest of Asia Pacific
10.5 South America
10.5.1 Argentina
10.5.2 Brazil
10.5.3 Chile
10.5.4 Rest of South America
10.6 Middle East & Africa
10.6.1 Saudi Arabia
10.6.2 UAE
10.6.3 Qatar
10.6.4 South Africa
10.6.5 Rest of Middle East & Africa
11 Key Developments
11.1 Agreements, Partnerships, Collaborations and Joint Ventures
11.2 Acquisitions & Mergers
11.3 New Product Launch
11.4 Expansions
11.5 Other Key Strategies
12 Company Profiling
12.1 Broadcom Inc
12.2 Fuji Electric Co., LTD
12.3 ABB Ltd.
12.4 Siemens AG
12.5 Emerson Electric Co.
12.6 Hitachi Ltd
12.7 General Electric Company
12.8 Oracle Corporation
12.9 IBM
12.10 Cisco System, Inc.
12.11 Yokogawa Electric Corporation
12.12 Omron Corporation
12.13 Honeywell International Inc.
12.14 Microsoft Corporation
12.15 Thales Group
12.16 Tesco Controls
12.17 Schneider Electric Ltd
12.18 Rockwell Automation
12.19 Mitsubishi Electric Corporation
12.20 Advantech CO.Ltd
List of Tables
1 Global Operational Technology Market Outlook, By Region (2021-2030) ($MN)
2 Global Operational Technology Market Outlook, By Component (2021-2030) ($MN)
3 Global Operational Technology Market Outlook, By Human-machine Interface (2021-2030) ($MN)
4 Global Operational Technology Market Outlook, By Industrial Valves (2021-2030) ($MN)
5 Global Operational Technology Market Outlook, By Transmitters (2021-2030) ($MN)
6 Global Operational Technology Market Outlook, By Industrial Sensors (2021-2030) ($MN)
7 Global Operational Technology Market Outlook, By Actuators (2021-2030) ($MN)
8 Global Operational Technology Market Outlook, By Control Systems (2021-2030) ($MN)
9 Global Operational Technology Market Outlook, By Supervisory Control and Data Acquisition (SCADA) (2021-2030) ($MN)
10 Global Operational Technology Market Outlook, By Manufacturing Execution System (MES) (2021-2030) ($MN)
11 Global Operational Technology Market Outlook, By Warehouse Management System (WMS) (2021-2030) ($MN)
12 Global Operational Technology Market Outlook, By Distributed Control System (DCS) (2021-2030) ($MN)
13 Global Operational Technology Market Outlook, By Process Control Domains (PCD) (2021-2030) ($MN)
14 Global Operational Technology Market Outlook, By Programmable Logic Controllers (PLC) (2021-2030) ($MN)
15 Global Operational Technology Market Outlook, By Human Machine Interface (HMI) (2021-2030) ($MN)
16 Global Operational Technology Market Outlook, By Safety Instrumented Systems (SIS) (2021-2030) ($MN)
17 Global Operational Technology Market Outlook, By Building Management/Automation Systems (BAS) (2021-2030) ($MN)
18 Global Operational Technology Market Outlook, By Functional Safety (2021-2030) ($MN)
19 Global Operational Technology Market Outlook, By Field Instruments (2021-2030) ($MN)
20 Global Operational Technology Market Outlook, By Other Components (2021-2030) ($MN)
21 Global Operational Technology Market Outlook, By Networking Technology (2021-2030) ($MN)
22 Global Operational Technology Market Outlook, By Wired (2021-2030) ($MN)
23 Global Operational Technology Market Outlook, By Wireless (2021-2030) ($MN)
24 Global Operational Technology Market Outlook, By Other Networking Technologies (2021-2030) ($MN)
25 Global Operational Technology Market Outlook, By Organization Size (2021-2030) ($MN)
26 Global Operational Technology Market Outlook, By Large Enterprises (2021-2030) ($MN)
27 Global Operational Technology Market Outlook, By Small and Medium Enterprises (SMEs) (2021-2030) ($MN)
28 Global Operational Technology Market Outlook, By Other Organization Sizes (2021-2030) ($MN)
29 Global Operational Technology Market Outlook, By Deployment Mode (2021-2030) ($MN)
30 Global Operational Technology Market Outlook, By On-Premise (2021-2030) ($MN)
31 Global Operational Technology Market Outlook, By Cloud (2021-2030) ($MN)
32 Global Operational Technology Market Outlook, By End User (2021-2030) ($MN)
33 Global Operational Technology Market Outlook, By Process Industry (2021-2030) ($MN)
34 Global Operational Technology Market Outlook, By Oil & Gas (2021-2030) ($MN)
35 Global Operational Technology Market Outlook, By Food & Beverages (2021-2030) ($MN)
36 Global Operational Technology Market Outlook, By Pharmaceuticals (2021-2030) ($MN)
37 Global Operational Technology Market Outlook, By Chemicals (2021-2030) ($MN)
38 Global Operational Technology Market Outlook, By Energy & Power (2021-2030) ($MN)
39 Global Operational Technology Market Outlook, By Metals & Mining (2021-2030) ($MN)
40 Global Operational Technology Market Outlook, By Pulp & Paper (2021-2030) ($MN)
41 Global Operational Technology Market Outlook, By Discrete Industry (2021-2030) ($MN)
42 Global Operational Technology Market Outlook, By Automotive (2021-2030) ($MN)
43 Global Operational Technology Market Outlook, By Aerospace & Defense (2021-2030) ($MN)
44 Global Operational Technology Market Outlook, By Semiconductor & Electronics (2021-2030) ($MN)
45 Global Operational Technology Market Outlook, By Medical Devices (2021-2030) ($MN)
46 Global Operational Technology Market Outlook, By Machine Manufacturing (2021-2030) ($MN)
47 Global Operational Technology Market Outlook, By Other End Users (2021-2030) ($MN)
Note: Tables for North America, Europe, APAC, South America, and Middle East & Africa Regions are also represented in the same manner as above.
List of Figures
RESEARCH METHODOLOGY

We at ‘Stratistics’ opt for an extensive research approach which involves data mining, data validation, and data analysis. The various research sources include in-house repository, secondary research, competitor’s sources, social media research, client internal data, and primary research.
Our team of analysts prefers the most reliable and authenticated data sources in order to perform the comprehensive literature search. With access to most of the authenticated data bases our team highly considers the best mix of information through various sources to obtain extensive and accurate analysis.
Each report takes an average time of a month and a team of 4 industry analysts. The time may vary depending on the scope and data availability of the desired market report. The various parameters used in the market assessment are standardized in order to enhance the data accuracy.
Data Mining
The data is collected from several authenticated, reliable, paid and unpaid sources and is filtered depending on the scope & objective of the research. Our reports repository acts as an added advantage in this procedure. Data gathering from the raw material suppliers, distributors and the manufacturers is performed on a regular basis, this helps in the comprehensive understanding of the products value chain. Apart from the above mentioned sources the data is also collected from the industry consultants to ensure the objective of the study is in the right direction.
Market trends such as technological advancements, regulatory affairs, market dynamics (Drivers, Restraints, Opportunities and Challenges) are obtained from scientific journals, market related national & international associations and organizations.
Data Analysis
From the data that is collected depending on the scope & objective of the research the data is subjected for the analysis. The critical steps that we follow for the data analysis include:
- Product Lifecycle Analysis
- Competitor analysis
- Risk analysis
- Porters Analysis
- PESTEL Analysis
- SWOT Analysis
The data engineering is performed by the core industry experts considering both the Marketing Mix Modeling and the Demand Forecasting. The marketing mix modeling makes use of multiple-regression techniques to predict the optimal mix of marketing variables. Regression factor is based on a number of variables and how they relate to an outcome such as sales or profits.
Data Validation
The data validation is performed by the exhaustive primary research from the expert interviews. This includes telephonic interviews, focus groups, face to face interviews, and questionnaires to validate our research from all aspects. The industry experts we approach come from the leading firms, involved in the supply chain ranging from the suppliers, distributors to the manufacturers and consumers so as to ensure an unbiased analysis.
We are in touch with more than 15,000 industry experts with the right mix of consultants, CEO's, presidents, vice presidents, managers, experts from both supply side and demand side, executives and so on.
The data validation involves the primary research from the industry experts belonging to:
- Leading Companies
- Suppliers & Distributors
- Manufacturers
- Consumers
- Industry/Strategic Consultants
Apart from the data validation the primary research also helps in performing the fill gap research, i.e. providing solutions for the unmet needs of the research which helps in enhancing the reports quality.
For more details about research methodology, kindly write to us at info@strategymrc.com
Frequently Asked Questions
In case of any queries regarding this report, you can contact the customer service by filing the “Inquiry Before Buy” form available on the right hand side. You may also contact us through email: info@strategymrc.com or phone: +1-301-202-5929
Yes, the samples are available for all the published reports. You can request them by filling the “Request Sample” option available in this page.
Yes, you can request a sample with your specific requirements. All the customized samples will be provided as per the requirement with the real data masked.
All our reports are available in Digital PDF format. In case if you require them in any other formats, such as PPT, Excel etc you can submit a request through “Inquiry Before Buy” form available on the right hand side. You may also contact us through email: info@strategymrc.com or phone: +1-301-202-5929
We offer a free 15% customization with every purchase. This requirement can be fulfilled for both pre and post sale. You may send your customization requirements through email at info@strategymrc.com or call us on +1-301-202-5929.
We have 3 different licensing options available in electronic format.
- Single User Licence: Allows one person, typically the buyer, to have access to the ordered product. The ordered product cannot be distributed to anyone else.
- 2-5 User Licence: Allows the ordered product to be shared among a maximum of 5 people within your organisation.
- Corporate License: Allows the product to be shared among all employees of your organisation regardless of their geographical location.
All our reports are typically be emailed to you as an attachment.
To order any available report you need to register on our website. The payment can be made either through CCAvenue or PayPal payments gateways which accept all international cards.
We extend our support to 6 months post sale. A post sale customization is also provided to cover your unmet needs in the report.
Request Customization
We offer complimentary customization of up to 15% with every purchase. To share your customization requirements, feel free to email us at info@strategymrc.com or call us on +1-301-202-5929. .
Please Note: Customization within the 15% threshold is entirely free of charge. If your request exceeds this limit, we will conduct a feasibility assessment. Following that, a detailed quote and timeline will be provided.
WHY CHOOSE US ?

Assured Quality
Best in class reports with high standard of research integrity

24X7 Research Support
Continuous support to ensure the best customer experience.

Free Customization
Adding more values to your product of interest.

Safe & Secure Access
Providing a secured environment for all online transactions.

Trusted by 600+ Brands
Serving the most reputed brands across the world.