
Optoelectronic Components Market
Optoelectronic Components Market Forecasts to 2028 – Global Analysis By Material (Gallium Arsenide, Gallium Nitride, Gallium Phosphide), Component Type (Infrared Components, Laser Diode), Application, End User, and By Geography

|
Years Covered |
2020-2028 |
|
Estimated Year Value (2021) |
US $42.54 BN |
|
Projected Year Value (2028) |
US $61.88 BN |
|
CAGR (2021 - 2028) |
5.5% |
|
Regions Covered |
North America, Europe, Asia Pacific, South America, and Middle East & Africa |
|
Countries Covered |
US, Canada, Mexico, Germany, UK, Italy, France, Spain, Japan, China, India, Australia, New Zealand, South Korea, Rest of Asia Pacific, South America, Argentina, Brazil, Chile, Middle East & Africa, Saudi Arabia, UAE, Qatar, and South Africa |
|
Largest Market |
North America |
|
Highest Growing Market |
Asia Pacific |
According to Stratistics MRC, the Global Optoelectronic Components Market is accounted for $42.54 billion in 2021 and is expected to reach $61.88 billion by 2028 growing at a CAGR of 5.5% during the forecast period. Optoelectronic components are electronic components that identify and control light, and changes over electrical signs into infrared or visible energy or vice versa. It is utilized in electric eyes, screen and control circuits, photovoltaic force supplies, and optical fibres communications systems. Infusion laser diodes and quantum course lasers use optoelectronic components for stimulated emission. Picture sensors and LEDs are utilized for safety purposes, packaging, and digital imaging systems.
Market Dynamics:
Driver:
Growing inclination from healthcare industry
Optoelectronics is a critical part of several advanced technologies. Healthcare and automotive are the prominent industries that have started adopting optoelectronics in recent years. The use of optical sensors for biosensing applications in the healthcare industry allows for monitoring the heart rate and the functioning of other vital organs in a human body. Thus, the use of non-intrusive, inexpensive sensors across advanced healthcare applications has led to a paradigm change in consumer wellness. Current medical applications that use optoelectronic sensors include pulse oximetry, measuring the amount of oxygen in the blood, heart-rate monitors blood diagnostics, such as blood glucose monitoring; urine analysis, and dental color matching.
Restraint:
Presence of substitutes
Cost-efficient substitute advancements and easy availability of costly gadgets are relied upon to hamper the development of the worldwide optoelectronic component market. The presence of user-friendly and cheaper substitute technologies is expected to restrain the positive growth of the optoelectronic components market. The high price of raw materials along with the huge initial investment required for developing energy-efficient LED displays are likely to negatively affect the growth of the optoelectronic components market.
Opportunity:
Advancements in technology
The advancements in Li-Fi technology which allows data transmission via light sources to overcome the challenges faced by the 5G and Wi-Fi technologies, is expected to create huge growth prospects for the optoelectronic components in the near future. Because of its capacity to transport data by light, this technology is much more energy-efficient than other wireless data transmission systems. As a result, industry participants in the optoelectronic components market will have more opportunities to grow. The advanced smartphones and wearable with intuitive displays and camera technology is driving the demand for optoelectronic components. Moreover, the high-tech cameras also demand image sensors with the capability to capture precise high-quality images, further spurring the market growth.
Threat:
Huge dip due to the pandemic
The outbreak of the COVID-19 pandemic had a significant impact on public health as well as businesses. To stop the spread of the virus, governments worldwide imposed lockdowns, consequently shutting down on-premise business processes and manufacturing operations and disrupting supply chains and production schedules. This scenario led to a demand-supply gap of components required in residential and healthcare applications. The demand for optoelectronics witnessed a dip due to the shutdown of consumer electronics, automobile, industrial, and other manufacturing facilities across the globe. In addition, Asia-Pacific being the hub of semiconductor manufacturing and China, the epicenter of the virus outbreak, led to huge losses during the first and second quarters of 2020.
The sensors segment is expected to be the largest during the forecast period
The sensors segment is estimated to have a lucrative growth due to the high adoption of various sensors such as photodiodes, image sensors, and optical sensors across various industry verticals. The use of optical sensors in the textile industry offers improved safety; CMOS image sensors are used in cameras, spectroscopy, and LiDAR systems; and plasmonic color sensors are used for LED monitoring and colorimetry, among other applications. Thus, the adoption of various sensors across a wide application area contributes to the sensors segment’s highest share among devices in the optoelectronic components market.
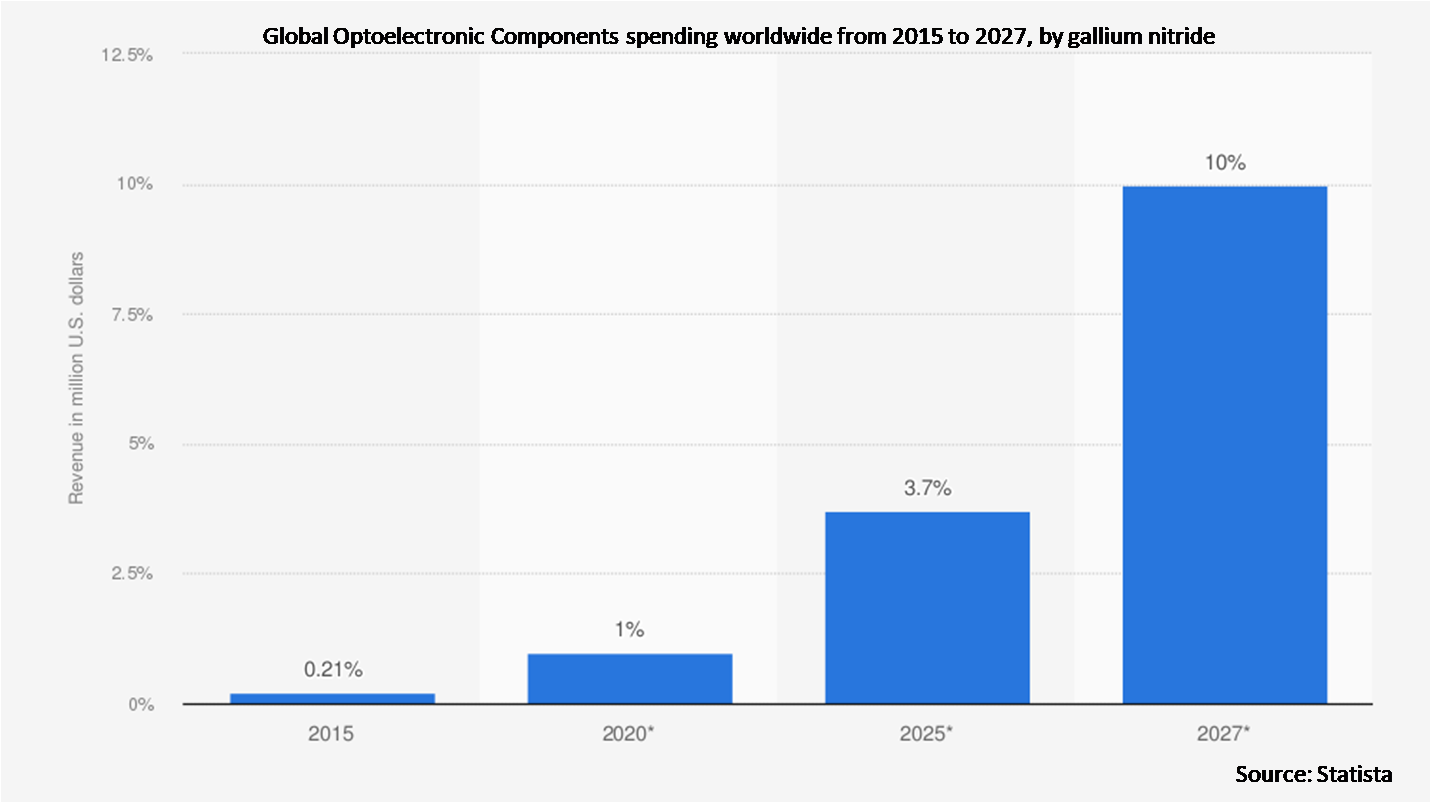
The gallium nitride segment is expected to have the highest CAGR during the forecast period
The gallium nitride segment is anticipated to witness the fastest CAGR growth during the forecast period. Gallium nitride is a high electron mobility transistor (HEHT) material that is used as a basic component for optoelectronic components, which are superior to older silicon-based optoelectronic components. Gallium nitride finds application in LEDs, which are widely used in general lighting and commercial lighting. The ability to withstand high temperatures and voltages makes gallium nitride ideal for imaging and sensing applications. GaN is used in LEDs, power devices, RF components, lasers, and photonics applications. Thus, the need for enhanced efficiency, minimized power consumption, and lower system costs contributes to the GaN segment’s largest share among other device materials in the optoelectronics market.
Region with highest share:
North America is projected to hold the largest market share during the forecast period. North America is one of the most technologically advanced markets for optoelectronic components owing to the presence of prominent system suppliers, large semiconductor companies, LED, laser, and sensor manufacturers in the region. The US, Canada, and Mexico are the major contributors to the growth of the market in North America.
Region with highest CAGR:
Asia Pacific is projected to have the highest CAGR over the forecast period due to the evolving automobile, medical, and industrial manufacturing companies and also the rising demand for optoelectronic components from the overseas markets of North America and Europe. South Korea, Japan China, and India are the major contributors to the growth of the market in Asia Pacific. In addition, Asia-Pacific is the hub of semiconductor component manufacturing, and the region houses the majority of key players operating in the optoelectronic components market such as Rohm Co., Ltd, Hamamatsu Photonics K.K., Samsung Electronics Co., Ltd., Sony Corporation, Panasonic Corporation, and Sharp Corporation along with other small regional players. Furthermore, growth in the healthcare, consumer electronics, and automotive industries is further expected to propel the demand for optoelectronic components in the region.

Key players in the market
Some of the key players profiled in the Optoelectronic Components Market include Micropac, Mitsubishi Electric Corporation, Newport, Omnivision, ON Semiconductor, Osram, Panasonic, Rohm, Samsung, Sharp, SICK AG, Sony, and Trumpf.
Key Developments:
In July 2021, Sharp Fukuyama Semiconductor Co., Ltd has developed the GP2AP130S00F proximity sensor, the industry’s smallest in class for wearable devices that supports the I2C communication protocol. The wearable device market is a growing field that includes TWS*4 earbuds used with smartphones, as well as VR goggles and smart glasses that are expected to enter widespread use in the future, and devices equipped with biometric information monitoring functions.
In December 2019, Mitsubishi Electric Corporation launched the ML562G86 pulse laser diode (LD) for projectors, featuring a vibrant 638-nanometer (nm) red light, the output power of 3.0W under pulse operation and mean time to failure1 (MTTF) of over 20,000 hours.
In February 2019, Osram acquired Ring Automotive, a British manufacturer and distributor of vehicle lighting and auto-electrical parts. The acquisition enabled OSRAM to strengthen its expertise in automotive lighting and tap into additional sales potential by utilizing the distribution channels of Ring Automotive.
Materials Covered:
• Gallium Arsenide
• Gallium Nitride
• Gallium Phosphide
• Indium Phosphide
• Silicon Carbide
• Silicon Germanium
Component Types Covered:
• Infrared Components
• Laser Diode
• Light-Emitting Diode (LED)
• Optocouplers
• Sensors
Applications Covered:
• Communications
• Geographical Survey
• Lighting
• Measurement
• Scanning
• Security & Surveillance
• Spectrometry
End Users Covered:
• Automotive
• Devices
• Food & Beverages
• Healthcare
• Industrial
• Military & Aerospace
• Pulp & Paper
• Residential & Commercial
• Telecommunication
• Utility
Regions Covered:
• North America
o US
o Canada
o Mexico
• Europe
o Germany
o UK
o Italy
o France
o Spain
o Rest of Europe
• Asia Pacific
o Japan
o China
o India
o Australia
o New Zealand
o South Korea
o Rest of Asia Pacific
• South America
o Argentina
o Brazil
o Chile
o Rest of South America
• Middle East & Africa
o Saudi Arabia
o UAE
o Qatar
o South Africa
o Rest of Middle East & Africa
What our report offers:
- Market share assessments for the regional and country-level segments
- Strategic recommendations for the new entrants
- Covers Market data for the years 2020, 2021, 2022, 2025, and 2028
- Market Trends (Drivers, Constraints, Opportunities, Threats, Challenges, Investment Opportunities, and recommendations)
- Strategic recommendations in key business segments based on the market estimations
- Competitive landscaping mapping the key common trends
- Company profiling with detailed strategies, financials, and recent developments
- Supply chain trends mapping the latest technological advancements
Free Customization Offerings:
All the customers of this report will be entitled to receive one of the following free customization options:
• Company Profiling
o Comprehensive profiling of additional market players (up to 3)
o SWOT Analysis of key players (up to 3)
• Regional Segmentation
o Market estimations, Forecasts and CAGR of any prominent country as per the client's interest (Note: Depends on feasibility check)
• Competitive Benchmarking
o Benchmarking of key players based on product portfolio, geographical presence, and strategic alliances
Table of Contents
1 Executive Summary
2 Preface
2.1 Abstract
2.2 Stake Holders
2.3 Research Scope
2.4 Research Methodology
2.4.1 Data Mining
2.4.2 Data Analysis
2.4.3 Data Validation
2.4.4 Research Approach
2.5 Research Sources
2.5.1 Primary Research Sources
2.5.2 Secondary Research Sources
2.5.3 Assumptions
3 Market Trend Analysis
3.1 Introduction
3.2 Drivers
3.3 Restraints
3.4 Opportunities
3.5 Threats
3.6 Application Analysis
3.7 End User Analysis
3.8 Emerging Markets
3.9 Impact of Covid-19
4 Porters Five Force Analysis
4.1 Bargaining power of suppliers
4.2 Bargaining power of buyers
4.3 Threat of substitutes
4.4 Threat of new entrants
4.5 Competitive rivalry
5 Global Optoelectronic Components Market, By Material
5.1 Introduction
5.2 Gallium Arsenide
5.3 Gallium Nitride
5.4 Gallium Phosphide
5.5 Indium Phosphide
5.6 Silicon Carbide
5.7 Silicon Germanium
6 Global Optoelectronic Components Market, By Component Type
6.1 Introduction
6.2 Infrared Components
6.2.1 Infrared Data Association (IrDA) Transceiver
6.2.2 Infrared Emitting Diode (IRED)
6.2.3 Infrared (IR) Detector
6.3 Laser Diode
6.3.1 Blue Laser Diode
6.3.2 Green Laser Diode
6.3.3 Near Infrared (NIR)
6.3.4 Red Laser Diode
6.4 Light-Emitting Diode (LED)
6.4.1 General Light-Emitting Diode
6.4.2 Organic Light-Emitting Diode
6.4.3 Ultraviolet Light-Emitting Diode
6.5 Optocouplers
6.5.1 4 Pin Optocoupler
6.5.2 6 Pin Optocoupler
6.5.3 High Speed Optocoupler
6.5.4 Insulated-Gate Bipolar Transistor Gate
6.5.5 Isolation Amplifier
6.6 Sensors
6.6.1 Image Sensor
6.6.1.1 Charge-Coupled Device (CCD) Image Sensor
6.6.1.2 Complementary Metal Oxide Semiconductor (CMOS) Image Sensor
6.6.1.3 Hybrid Image Sensor
6.6.2 Optical Sensor
6.6.3 Ultraviolet Sensor
7 Global Optoelectronic Components Market, By Application
7.1 Introduction
7.2 Communications
7.3 Geographical Survey
7.4 Lighting
7.5 Measurement
7.6 Scanning
7.7 Security & Surveillance
7.8 Spectrometry
8 Global Optoelectronic Components Market, By End User
8.1 Introduction
8.2 Automotive
8.3 Devices
8.3.1 Consumer Electronic Devices
8.3.2 Smart Home Devices
8.3.3 Wearable Devices
8.4 Food & Beverages
8.5 Healthcare
8.6 Industrial
8.7 Military & Aerospace
8.8 Pulp & Paper
8.9 Residential & Commercial
8.10 Telecommunication
8.11 Utility
9 Global Optoelectronic Components Market, By Geography
9.1 Introduction
9.2 North America
9.2.1 US
9.2.2 Canada
9.2.3 Mexico
9.3 Europe
9.3.1 Germany
9.3.2 UK
9.3.3 Italy
9.3.4 France
9.3.5 Spain
9.3.6 Rest of Europe
9.4 Asia Pacific
9.4.1 Japan
9.4.2 China
9.4.3 India
9.4.4 Australia
9.4.5 New Zealand
9.4.6 South Korea
9.4.7 Rest of Asia Pacific
9.5 South America
9.5.1 Argentina
9.5.2 Brazil
9.5.3 Chile
9.5.4 Rest of South America
9.6 Middle East & Africa
9.6.1 Saudi Arabia
9.6.2 UAE
9.6.3 Qatar
9.6.4 South Africa
9.6.5 Rest of Middle East & Africa
10 Key Developments
10.1 Agreements, Partnerships, Collaborations and Joint Ventures
10.2 Acquisitions & Mergers
10.3 New Product Launch
10.4 Expansions
10.5 Other Key Strategies
11 Company Profiling
11.1 Broadcom
11.2 Hamamatsu
11.3 Micropac
11.4 Mitsubishi Electric Corporation
11.5 Newport
11.6 Omnivision
11.7 ON Semiconductor
11.8 Osram
11.9 Panasonic
11.10 Rohm
11.11 Samsung
11.12 Sharp
11.13 SICK AG
11.14 Sony
11.15 Trumpf
List of Tables
1 Global Optoelectronic Components Market Outlook, By Region (2020-2028) ($MN)
2 Global Optoelectronic Components Market Outlook, By Material (2020-2028) ($MN)
3 Global Optoelectronic Components Market Outlook, By Gallium Arsenide (2020-2028) ($MN)
4 Global Optoelectronic Components Market Outlook, By Gallium Nitride (2020-2028) ($MN)
5 Global Optoelectronic Components Market Outlook, By Gallium Phosphide (2020-2028) ($MN)
6 Global Optoelectronic Components Market Outlook, By Indium Phosphide (2020-2028) ($MN)
7 Global Optoelectronic Components Market Outlook, By Silicon Carbide (2020-2028) ($MN)
8 Global Optoelectronic Components Market Outlook, By Silicon Germanium (2020-2028) ($MN)
9 Global Optoelectronic Components Market Outlook, By Component Type (2020-2028) ($MN)
10 Global Optoelectronic Components Market Outlook, By Infrared Components (2020-2028) ($MN)
11 Global Optoelectronic Components Market Outlook, By Infrared Data Association (IrDA) Transceiver (2020-2028) ($MN)
12 Global Optoelectronic Components Market Outlook, By Infrared Emitting Diode (IRED) (2020-2028) ($MN)
13 Global Optoelectronic Components Market Outlook, By Infrared (IR) Detector (2020-2028) ($MN)
14 Global Optoelectronic Components Market Outlook, By Laser Diode (2020-2028) ($MN)
15 Global Optoelectronic Components Market Outlook, By Blue Laser Diode (2020-2028) ($MN)
16 Global Optoelectronic Components Market Outlook, By Green Laser Diode (2020-2028) ($MN)
17 Global Optoelectronic Components Market Outlook, By Near Infrared (NIR) (2020-2028) ($MN)
18 Global Optoelectronic Components Market Outlook, By Red Laser Diode (2020-2028) ($MN)
19 Global Optoelectronic Components Market Outlook, By Light-Emitting Diode (LED) (2020-2028) ($MN)
20 Global Optoelectronic Components Market Outlook, By General Light-Emitting Diode (2020-2028) ($MN)
21 Global Optoelectronic Components Market Outlook, By Organic Light-Emitting Diode (2020-2028) ($MN)
22 Global Optoelectronic Components Market Outlook, By Ultraviolet Light-Emitting Diode (2020-2028) ($MN)
23 Global Optoelectronic Components Market Outlook, By Optocouplers (2020-2028) ($MN)
24 Global Optoelectronic Components Market Outlook, By 4 Pin Optocoupler (2020-2028) ($MN)
25 Global Optoelectronic Components Market Outlook, By 6 Pin Optocoupler (2020-2028) ($MN)
26 Global Optoelectronic Components Market Outlook, By High Speed Optocoupler (2020-2028) ($MN)
27 Global Optoelectronic Components Market Outlook, By Insulated-Gate Bipolar Transistor Gate (2020-2028) ($MN)
28 Global Optoelectronic Components Market Outlook, By Isolation Amplifier (2020-2028) ($MN)
29 Global Optoelectronic Components Market Outlook, By Sensors (2020-2028) ($MN)
30 Global Optoelectronic Components Market Outlook, By Image Sensor (2020-2028) ($MN)
31 Global Optoelectronic Components Market Outlook, By Optical Sensor (2020-2028) ($MN)
32 Global Optoelectronic Components Market Outlook, By Ultraviolet Sensor (2020-2028) ($MN)
33 Global Optoelectronic Components Market Outlook, By Application (2020-2028) ($MN)
34 Global Optoelectronic Components Market Outlook, By Communications (2020-2028) ($MN)
35 Global Optoelectronic Components Market Outlook, By Geographical Survey (2020-2028) ($MN)
36 Global Optoelectronic Components Market Outlook, By Lighting (2020-2028) ($MN)
37 Global Optoelectronic Components Market Outlook, By Measurement (2020-2028) ($MN)
38 Global Optoelectronic Components Market Outlook, By Scanning (2020-2028) ($MN)
39 Global Optoelectronic Components Market Outlook, By Security & Surveillance (2020-2028) ($MN)
40 Global Optoelectronic Components Market Outlook, By Spectrometry (2020-2028) ($MN)
41 Global Optoelectronic Components Market Outlook, By End User (2020-2028) ($MN)
42 Global Optoelectronic Components Market Outlook, By Automotive (2020-2028) ($MN)
43 Global Optoelectronic Components Market Outlook, By Devices (2020-2028) ($MN)
44 Global Optoelectronic Components Market Outlook, By Consumer Electronic Devices (2020-2028) ($MN)
45 Global Optoelectronic Components Market Outlook, By Smart Home Devices (2020-2028) ($MN)
46 Global Optoelectronic Components Market Outlook, By Wearable Devices (2020-2028) ($MN)
47 Global Optoelectronic Components Market Outlook, By Food & Beverages (2020-2028) ($MN)
48 Global Optoelectronic Components Market Outlook, By Healthcare (2020-2028) ($MN)
49 Global Optoelectronic Components Market Outlook, By Industrial (2020-2028) ($MN)
50 Global Optoelectronic Components Market Outlook, By Military & Aerospace (2020-2028) ($MN)
51 Global Optoelectronic Components Market Outlook, By Pulp & Paper (2020-2028) ($MN)
52 Global Optoelectronic Components Market Outlook, By Residential & Commercial (2020-2028) ($MN)
53 Global Optoelectronic Components Market Outlook, By Telecommunication (2020-2028) ($MN)
54 Global Optoelectronic Components Market Outlook, By Utility (2020-2028) ($MN)
Note: Tables for North America, Europe, APAC, South America, and Middle East & Africa Regions are also represented in the same manner as above.
List of Figures
RESEARCH METHODOLOGY

We at ‘Stratistics’ opt for an extensive research approach which involves data mining, data validation, and data analysis. The various research sources include in-house repository, secondary research, competitor’s sources, social media research, client internal data, and primary research.
Our team of analysts prefers the most reliable and authenticated data sources in order to perform the comprehensive literature search. With access to most of the authenticated data bases our team highly considers the best mix of information through various sources to obtain extensive and accurate analysis.
Each report takes an average time of a month and a team of 4 industry analysts. The time may vary depending on the scope and data availability of the desired market report. The various parameters used in the market assessment are standardized in order to enhance the data accuracy.
Data Mining
The data is collected from several authenticated, reliable, paid and unpaid sources and is filtered depending on the scope & objective of the research. Our reports repository acts as an added advantage in this procedure. Data gathering from the raw material suppliers, distributors and the manufacturers is performed on a regular basis, this helps in the comprehensive understanding of the products value chain. Apart from the above mentioned sources the data is also collected from the industry consultants to ensure the objective of the study is in the right direction.
Market trends such as technological advancements, regulatory affairs, market dynamics (Drivers, Restraints, Opportunities and Challenges) are obtained from scientific journals, market related national & international associations and organizations.
Data Analysis
From the data that is collected depending on the scope & objective of the research the data is subjected for the analysis. The critical steps that we follow for the data analysis include:
- Product Lifecycle Analysis
- Competitor analysis
- Risk analysis
- Porters Analysis
- PESTEL Analysis
- SWOT Analysis
The data engineering is performed by the core industry experts considering both the Marketing Mix Modeling and the Demand Forecasting. The marketing mix modeling makes use of multiple-regression techniques to predict the optimal mix of marketing variables. Regression factor is based on a number of variables and how they relate to an outcome such as sales or profits.
Data Validation
The data validation is performed by the exhaustive primary research from the expert interviews. This includes telephonic interviews, focus groups, face to face interviews, and questionnaires to validate our research from all aspects. The industry experts we approach come from the leading firms, involved in the supply chain ranging from the suppliers, distributors to the manufacturers and consumers so as to ensure an unbiased analysis.
We are in touch with more than 15,000 industry experts with the right mix of consultants, CEO's, presidents, vice presidents, managers, experts from both supply side and demand side, executives and so on.
The data validation involves the primary research from the industry experts belonging to:
- Leading Companies
- Suppliers & Distributors
- Manufacturers
- Consumers
- Industry/Strategic Consultants
Apart from the data validation the primary research also helps in performing the fill gap research, i.e. providing solutions for the unmet needs of the research which helps in enhancing the reports quality.
For more details about research methodology, kindly write to us at info@strategymrc.com
Frequently Asked Questions
In case of any queries regarding this report, you can contact the customer service by filing the “Inquiry Before Buy” form available on the right hand side. You may also contact us through email: info@strategymrc.com or phone: +1-301-202-5929
Yes, the samples are available for all the published reports. You can request them by filling the “Request Sample” option available in this page.
Yes, you can request a sample with your specific requirements. All the customized samples will be provided as per the requirement with the real data masked.
All our reports are available in Digital PDF format. In case if you require them in any other formats, such as PPT, Excel etc you can submit a request through “Inquiry Before Buy” form available on the right hand side. You may also contact us through email: info@strategymrc.com or phone: +1-301-202-5929
We offer a free 15% customization with every purchase. This requirement can be fulfilled for both pre and post sale. You may send your customization requirements through email at info@strategymrc.com or call us on +1-301-202-5929.
We have 3 different licensing options available in electronic format.
- Single User Licence: Allows one person, typically the buyer, to have access to the ordered product. The ordered product cannot be distributed to anyone else.
- 2-5 User Licence: Allows the ordered product to be shared among a maximum of 5 people within your organisation.
- Corporate License: Allows the product to be shared among all employees of your organisation regardless of their geographical location.
All our reports are typically be emailed to you as an attachment.
To order any available report you need to register on our website. The payment can be made either through CCAvenue or PayPal payments gateways which accept all international cards.
We extend our support to 6 months post sale. A post sale customization is also provided to cover your unmet needs in the report.
Request Customization
We offer complimentary customization of up to 15% with every purchase. To share your customization requirements, feel free to email us at info@strategymrc.com or call us on +1-301-202-5929. .
Please Note: Customization within the 15% threshold is entirely free of charge. If your request exceeds this limit, we will conduct a feasibility assessment. Following that, a detailed quote and timeline will be provided.
WHY CHOOSE US ?

Assured Quality
Best in class reports with high standard of research integrity

24X7 Research Support
Continuous support to ensure the best customer experience.

Free Customization
Adding more values to your product of interest.

Safe & Secure Access
Providing a secured environment for all online transactions.

Trusted by 600+ Brands
Serving the most reputed brands across the world.