
Photoacoustic Imaging Market
Photoacoustic Imaging Market Forecasts to 2030 - Global Analysis By Product (Software and Accessories, Imaging Systems and Other Products), Type (Photoacoustic Microscopy, Photoacoustic Tomography and Other types), Application, End User and By Geography

|
Years Covered |
2021-2030 |
|
Estimated Year Value (2023) |
US $78.88 MN |
|
Projected Year Value (2030) |
US $222.93 MN |
|
CAGR (2023 - 2030) |
16.0% |
|
Regions Covered |
North America, Europe, Asia Pacific, South America, and Middle East & Africa |
|
Countries Covered |
US, Canada, Mexico, Germany, UK, Italy, France, Spain, Japan, China, India, Australia, New Zealand, South Korea, Rest of Asia Pacific, South America, Argentina, Brazil, Chile, Middle East & Africa, Saudi Arabia, UAE, Qatar, and South Africa |
|
Largest Market |
North America |
|
Highest Growing Market |
Asia Pacific |
According to Stratistics MRC, the Global Photoacoustic Imaging Market is accounted for $78.88 million in 2023 and is expected to reach $222.93 million by 2030 growing at a CAGR of 16.0% during the forecast period. Photoacoustic imaging is a non-invasive biomedical imaging technique that combines the advantages of both optical and ultrasound imaging modalities. It relies on the photoacoustic effect, where tissues absorb short laser pulses and emit ultrasound waves in response. This allows for high-resolution imaging of biological structures with excellent contrast, as different tissues exhibit varying absorption properties. Its ability to provide both structural and functional information makes it a promising tool for various applications in medical research.
According to the report of cancer.net, published in February 2023, about 297,790 women in the U.S. were diagnosed with invasive breast cancer, and 55,720 women will be diagnosed with non-invasive breast cancer in 2023.
Market Dynamics:
Driver:
Increasing adoption of hybrid imaging systems
Hybrid imaging systems combine multiple imaging modalities, such as ultrasound and photoacoustic imaging, providing complementary information for more comprehensive diagnostic insights. The synergy between different imaging techniques enhances the accuracy and depth of tissue visualization, making hybrid systems particularly attractive in medical applications. This trend is fueled by the growing demand for advanced imaging solutions in areas like oncology and cardiovascular diseases, where the integration of photoacoustic imaging into hybrid systems offers a powerful tool for early detection and precise characterization of abnormalities.
Restraint:
Cost of equipment
The specialized nature of photoacoustic imaging technology requires sophisticated and often expensive equipment, including laser sources, ultrasound transducers, and signal processing systems. These high upfront costs pose a barrier to widespread adoption, particularly in resource-constrained healthcare settings or research laboratories. Additionally, the maintenance and operational expenses further contribute to the economic challenges associated with implementing photoacoustic imaging systems.
Opportunity:
Industrial applications
Photoacoustic imaging technology allows for the visualization of internal structures and material properties with high resolution and depth penetration. In sectors such as manufacturing, photoacoustic imaging can be employed to inspect welds, detect defects in materials, and assess the integrity of components, enhancing overall quality assurance processes. Its ability to provide real-time imaging of subsurface features, such as flaws or inclusions, makes it a valuable tool in industries like aerospace, automotive, and electronics. As a non-invasive and versatile technique, photoacoustic imaging holds promise for improving efficiency and reliability in industrial inspection and maintenance procedures.
Threat:
Limited awareness and education
Many potential users and healthcare professionals may not be sufficiently informed about the technology's capabilities and benefits. This lack of awareness can hinder adoption rates and limit market growth. Moreover, the complex nature of photoacoustic imaging requires a certain level of education for effective utilization, and inadequate training might result in suboptimal usage or even reluctance to adopt the technology. Addressing these challenges through targeted educational initiatives is crucial to unlocking the full potential of photoacoustic imaging in healthcare and other applications.
Covid-19 Impact:
With healthcare systems overwhelmed and a heightened focus on respiratory illnesses, there has been a surge in demand for advanced diagnostic technologies. Photoacoustic imaging, which combines ultrasound and laser-induced photoacoustic signals, has gained prominence for its ability to provide detailed imaging of tissues. The pandemic has accelerated research and development in this field, leading to increased investments and adoption. As a result, the photoacoustic imaging market has experienced notable growth amid the global health crisis.
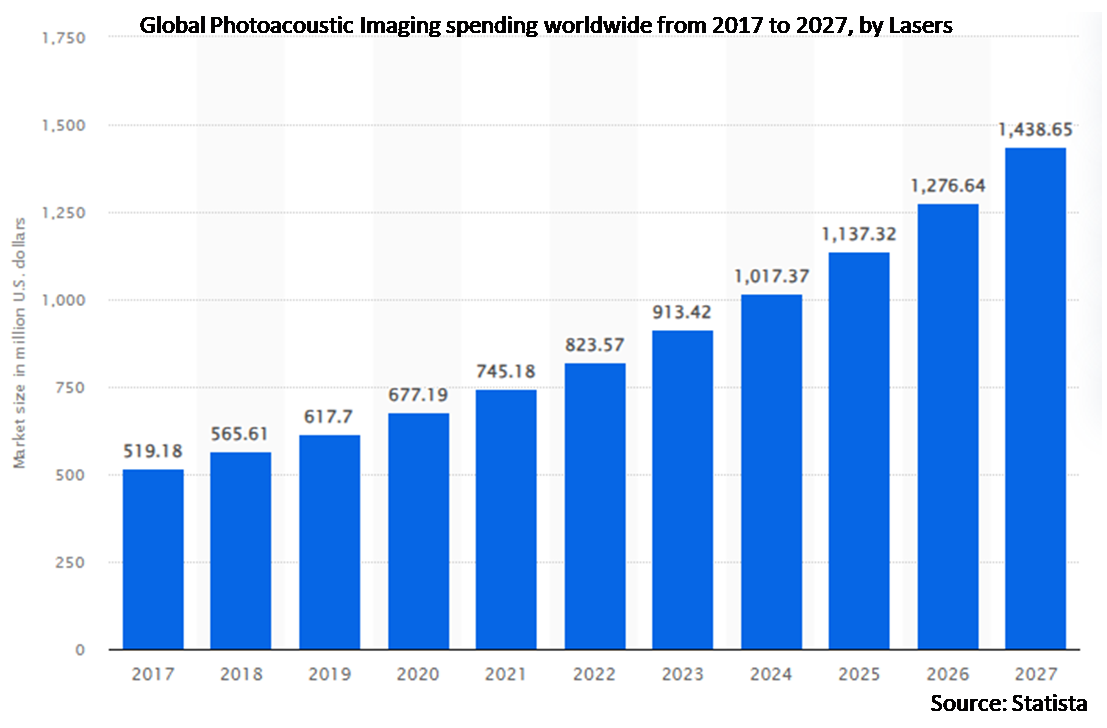
The lasers segment is expected to be the largest during the forecast period
The laser segment in the photoacoustic imaging market has experienced robust growth due to its pivotal role in enhancing imaging capabilities. Lasers serve as the primary energy source for generating photoacoustic signals, crucial for high-resolution imaging of biological tissues. Technological advancements, such as the development of tunable and ultrafast lasers, have significantly improved imaging depth and sensitivity. Additionally, ongoing research and innovation in laser technology continue to expand the application scope of photoacoustic imaging, fostering sustained growth in the laser segment within this dynamic market.
The hematology segment is expected to have the highest CAGR during the forecast period
The hematology segment is experiencing significant growth in the photoacoustic imaging market due to its ability to provide non-invasive and real-time visualization of blood-related parameters. Photoacoustic imaging in hematology allows for detailed assessment of blood composition, oxygenation levels, and vascular structures, aiding in the diagnosis and monitoring of various blood disorders such as anemia, leukemia, and thrombosis. The technology's capacity to capture functional information complements traditional imaging methods, fostering a comprehensive understanding of hematological conditions.
Region with largest share:
The North American region has experienced substantial growth in the photoacoustic imaging market due to increasing research and development activities, rising healthcare investments, and a growing prevalence of chronic diseases. The region's well-established healthcare infrastructure and technological advancements in medical imaging have propelled the adoption of photoacoustic imaging for early disease detection. In addition, the demand for non-invasive and high-resolution imaging techniques has driven the widespread acceptance of photoacoustic imaging, positioning North America as a key contributor to the expanding global market.
Region with highest CAGR:
The Asia-Pacific region has witnessed significant growth in the photoacoustic imaging market, driven by advancements in healthcare infrastructure and rising demand for non-invasive diagnostic tools. The increasing prevalence of chronic diseases, coupled with a growing aging population, has spurred the adoption of cutting-edge medical technologies in the region. Government and private sector investments in research and development have also played a pivotal role in fostering innovation in the photoacoustic imaging sector. Furthermore, the market's growth is fuelled by collaborations between academic institutions and industry players, fostering a conducive environment for technological breakthroughs.

Key players in the market
Some of the key players in Photoacoustic Imaging market include Advantest Corp, Aspectus GmbH, EKSPLA, Endra Life Sciences, FUJIFILM VisualSonics Inc, illumiSonics Inc, InnoLas Laser GmbH, iThera Medical GmbH , Kibero GmbH, Micro Photo Acoustics Inc. , Opotek LLC, PA Imaging, Photosound Technologies Inc, Seno Medical Instruments, TomoWave Laboratories and Vibronix Inc.
Key Developments:
In June 2022, Seno Medical received the supplemental FDA premarket approval (PMA from the Center for Devices and Radiological Health (CDRH) of the U.S. Food & Drug Administration (FDA) to its product Imagio Breast Imaging System, a revolutionary new modality in breast imaging.
In February 2022, FUJIFILM VisualSonics Inc. and PIUR Imaging announced a strategic partnership to develop an Ultra-High Frequency (UHF) Three-Dimensional (3D) ultrasound technology for researchers and clinicians. The FUJIFILM VisualSonics Inc. Vevo MD and PIUR Imaging tUS Infinity platform together provide researchers and clinicians with the capability to measure and visualize ultrasound volumes in 3D, thereby supporting the assessment of irregularity in clinical research for applications in the field of neurology and dermatology.
Products Covered:
• Software and Accessories
• Imaging Systems
• Lasers
• Contrast Agents
• Transducers
• Other Products
Types Covered:
• Photoacoustic Microscopy
• Photoacoustic Tomography
• Clinical
• Pre Clinical
• Other types
Applications Covered:
• Neurology
• Haematology
• Oncology
• Cardiology
• Other Applications
End Users Covered:
• Hospitals and Imaging Centers
• Research Institutes and Academia
• Other End Users
Regions Covered:
• North America
o US
o Canada
o Mexico
• Europe
o Germany
o UK
o Italy
o France
o Spain
o Rest of Europe
• Asia Pacific
o Japan
o China
o India
o Australia
o New Zealand
o South Korea
o Rest of Asia Pacific
• South America
o Argentina
o Brazil
o Chile
o Rest of South America
• Middle East & Africa
o Saudi Arabia
o UAE
o Qatar
o South Africa
o Rest of Middle East & Africa
What our report offers:
- Market share assessments for the regional and country-level segments
- Strategic recommendations for the new entrants
- Covers Market data for the years 2021, 2022, 2023, 2026, and 2030
- Market Trends (Drivers, Constraints, Opportunities, Threats, Challenges, Investment Opportunities, and recommendations)
- Strategic recommendations in key business segments based on the market estimations
- Competitive landscaping mapping the key common trends
- Company profiling with detailed strategies, financials, and recent developments
- Supply chain trends mapping the latest technological advancements
Free Customization Offerings:
All the customers of this report will be entitled to receive one of the following free customization options:
• Company Profiling
o Comprehensive profiling of additional market players (up to 3)
o SWOT Analysis of key players (up to 3)
• Regional Segmentation
o Market estimations, Forecasts and CAGR of any prominent country as per the client's interest (Note: Depends on feasibility check)
• Competitive Benchmarking
Benchmarking of key players based on product portfolio, geographical presence, and strategic alliances
Table of Contents
1 Executive Summary
2 Preface
2.1 Abstract
2.2 Stake Holders
2.3 Research Scope
2.4 Research Methodology
2.4.1 Data Mining
2.4.2 Data Analysis
2.4.3 Data Validation
2.4.4 Research Approach
2.5 Research Sources
2.5.1 Primary Research Sources
2.5.2 Secondary Research Sources
2.5.3 Assumptions
3 Market Trend Analysis
3.1 Introduction
3.2 Drivers
3.3 Restraints
3.4 Opportunities
3.5 Threats
3.6 Product Analysis
3.7 Application Analysis
3.8 End User Analysis
3.9 Emerging Markets
3.10 Impact of Covid-19
4 Porters Five Force Analysis
4.1 Bargaining power of suppliers
4.2 Bargaining power of buyers
4.3 Threat of substitutes
4.4 Threat of new entrants
4.5 Competitive rivalry
5 Global Photoacoustic Imaging Market, By Product
5.1 Introduction
5.2 Software and Accessories
5.3 Imaging Systems
5.4 Lasers
5.5 Contrast Agents
5.6 Transducers
5.7 Other Products
6 Global Photoacoustic Imaging Market, By Type
6.1 Introduction
6.2 Photoacoustic Microscopy
6.3 Photoacoustic Tomography
6.4 Clinical
6.5 Pre Clinical
6.6 Other types
7 Global Photoacoustic Imaging Market, By Application
7.1 Introduction
7.2 Neurology
7.3 Haematology
7.4 Oncology
7.5 Cardiology
7.6 Other Applications
8 Global Photoacoustic Imaging Market, By End User
8.1 Introduction
8.2 Hospitals and Imaging Centers
8.3 Research Institutes and Academia
8.4 Other End Users
9 Global Photoacoustic Imaging Market, By Geography
9.1 Introduction
9.2 North America
9.2.1 US
9.2.2 Canada
9.2.3 Mexico
9.3 Europe
9.3.1 Germany
9.3.2 UK
9.3.3 Italy
9.3.4 France
9.3.5 Spain
9.3.6 Rest of Europe
9.4 Asia Pacific
9.4.1 Japan
9.4.2 China
9.4.3 India
9.4.4 Australia
9.4.5 New Zealand
9.4.6 South Korea
9.4.7 Rest of Asia Pacific
9.5 South America
9.5.1 Argentina
9.5.2 Brazil
9.5.3 Chile
9.5.4 Rest of South America
9.6 Middle East & Africa
9.6.1 Saudi Arabia
9.6.2 UAE
9.6.3 Qatar
9.6.4 South Africa
9.6.5 Rest of Middle East & Africa
10 Key Developments
10.1 Agreements, Partnerships, Collaborations and Joint Ventures
10.2 Acquisitions & Mergers
10.3 New Product Launch
10.4 Expansions
10.5 Other Key Strategies
11 Company Profiling
11.1 Advantest Corp
11.2 Aspectus GmbH
11.3 EKSPLA
11.4 Endra Life Sciences
11.5 FUJIFILM VisualSonics Inc
11.6 illumiSonics Inc
11.7 InnoLas Laser GmbH
11.8 iThera Medical GmbH
11.9 Kibero GmbH
11.10 Micro Photo Acoustics Inc.
11.11 Opotek LLC
11.12 PA Imaging
11.11 Photosound Technologies Inc
11.14 Seno Medical Instruments
11.15 TomoWave Laboratories
11.16 Vibronix Inc
List of Tables
1 Global Photoacoustic Imaging Market Outlook, By Region (2021-2030) ($MN)
2 Global Photoacoustic Imaging Market Outlook, By Product (2021-2030) ($MN)
3 Global Photoacoustic Imaging Market Outlook, By Software and Accessories (2021-2030) ($MN)
4 Global Photoacoustic Imaging Market Outlook, By Imaging Systems (2021-2030) ($MN)
5 Global Photoacoustic Imaging Market Outlook, By Lasers (2021-2030) ($MN)
6 Global Photoacoustic Imaging Market Outlook, By Contrast Agents (2021-2030) ($MN)
7 Global Photoacoustic Imaging Market Outlook, By Transducers (2021-2030) ($MN)
8 Global Photoacoustic Imaging Market Outlook, By Other Products (2021-2030) ($MN)
9 Global Photoacoustic Imaging Market Outlook, By Type (2021-2030) ($MN)
10 Global Photoacoustic Imaging Market Outlook, By Photoacoustic Microscopy (2021-2030) ($MN)
11 Global Photoacoustic Imaging Market Outlook, By Photoacoustic Tomography (2021-2030) ($MN)
12 Global Photoacoustic Imaging Market Outlook, By Clinical (2021-2030) ($MN)
13 Global Photoacoustic Imaging Market Outlook, By Pre Clinical (2021-2030) ($MN)
14 Global Photoacoustic Imaging Market Outlook, By Other types (2021-2030) ($MN)
15 Global Photoacoustic Imaging Market Outlook, By Application (2021-2030) ($MN)
16 Global Photoacoustic Imaging Market Outlook, By Neurology (2021-2030) ($MN)
17 Global Photoacoustic Imaging Market Outlook, By Haematology (2021-2030) ($MN)
18 Global Photoacoustic Imaging Market Outlook, By Oncology (2021-2030) ($MN)
19 Global Photoacoustic Imaging Market Outlook, By Cardiology (2021-2030) ($MN)
20 Global Photoacoustic Imaging Market Outlook, By Other Applications (2021-2030) ($MN)
21 Global Photoacoustic Imaging Market Outlook, By End User (2021-2030) ($MN)
22 Global Photoacoustic Imaging Market Outlook, By Hospitals and Imaging Centers (2021-2030) ($MN)
23 Global Photoacoustic Imaging Market Outlook, By Research Institutes and Academia (2021-2030) ($MN)
24 Global Photoacoustic Imaging Market Outlook, By Other End Users (2021-2030) ($MN)
25 North America Photoacoustic Imaging Market Outlook, By Country (2021-2030) ($MN)
26 North America Photoacoustic Imaging Market Outlook, By Product (2021-2030) ($MN)
27 North America Photoacoustic Imaging Market Outlook, By Software and Accessories (2021-2030) ($MN)
28 North America Photoacoustic Imaging Market Outlook, By Imaging Systems (2021-2030) ($MN)
29 North America Photoacoustic Imaging Market Outlook, By Lasers (2021-2030) ($MN)
30 North America Photoacoustic Imaging Market Outlook, By Contrast Agents (2021-2030) ($MN)
31 North America Photoacoustic Imaging Market Outlook, By Transducers (2021-2030) ($MN)
32 North America Photoacoustic Imaging Market Outlook, By Other Products (2021-2030) ($MN)
33 North America Photoacoustic Imaging Market Outlook, By Type (2021-2030) ($MN)
34 North America Photoacoustic Imaging Market Outlook, By Photoacoustic Microscopy (2021-2030) ($MN)
35 North America Photoacoustic Imaging Market Outlook, By Photoacoustic Tomography (2021-2030) ($MN)
36 North America Photoacoustic Imaging Market Outlook, By Clinical (2021-2030) ($MN)
37 North America Photoacoustic Imaging Market Outlook, By Pre Clinical (2021-2030) ($MN)
38 North America Photoacoustic Imaging Market Outlook, By Other types (2021-2030) ($MN)
39 North America Photoacoustic Imaging Market Outlook, By Application (2021-2030) ($MN)
40 North America Photoacoustic Imaging Market Outlook, By Neurology (2021-2030) ($MN)
41 North America Photoacoustic Imaging Market Outlook, By Haematology (2021-2030) ($MN)
42 North America Photoacoustic Imaging Market Outlook, By Oncology (2021-2030) ($MN)
43 North America Photoacoustic Imaging Market Outlook, By Cardiology (2021-2030) ($MN)
44 North America Photoacoustic Imaging Market Outlook, By Other Applications (2021-2030) ($MN)
45 North America Photoacoustic Imaging Market Outlook, By End User (2021-2030) ($MN)
46 North America Photoacoustic Imaging Market Outlook, By Hospitals and Imaging Centers (2021-2030) ($MN)
47 North America Photoacoustic Imaging Market Outlook, By Research Institutes and Academia (2021-2030) ($MN)
48 North America Photoacoustic Imaging Market Outlook, By Other End Users (2021-2030) ($MN)
49 Europe Photoacoustic Imaging Market Outlook, By Country (2021-2030) ($MN)
50 Europe Photoacoustic Imaging Market Outlook, By Product (2021-2030) ($MN)
51 Europe Photoacoustic Imaging Market Outlook, By Software and Accessories (2021-2030) ($MN)
52 Europe Photoacoustic Imaging Market Outlook, By Imaging Systems (2021-2030) ($MN)
53 Europe Photoacoustic Imaging Market Outlook, By Lasers (2021-2030) ($MN)
54 Europe Photoacoustic Imaging Market Outlook, By Contrast Agents (2021-2030) ($MN)
55 Europe Photoacoustic Imaging Market Outlook, By Transducers (2021-2030) ($MN)
56 Europe Photoacoustic Imaging Market Outlook, By Other Products (2021-2030) ($MN)
57 Europe Photoacoustic Imaging Market Outlook, By Type (2021-2030) ($MN)
58 Europe Photoacoustic Imaging Market Outlook, By Photoacoustic Microscopy (2021-2030) ($MN)
59 Europe Photoacoustic Imaging Market Outlook, By Photoacoustic Tomography (2021-2030) ($MN)
60 Europe Photoacoustic Imaging Market Outlook, By Clinical (2021-2030) ($MN)
61 Europe Photoacoustic Imaging Market Outlook, By Pre Clinical (2021-2030) ($MN)
62 Europe Photoacoustic Imaging Market Outlook, By Other types (2021-2030) ($MN)
63 Europe Photoacoustic Imaging Market Outlook, By Application (2021-2030) ($MN)
64 Europe Photoacoustic Imaging Market Outlook, By Neurology (2021-2030) ($MN)
65 Europe Photoacoustic Imaging Market Outlook, By Haematology (2021-2030) ($MN)
66 Europe Photoacoustic Imaging Market Outlook, By Oncology (2021-2030) ($MN)
67 Europe Photoacoustic Imaging Market Outlook, By Cardiology (2021-2030) ($MN)
68 Europe Photoacoustic Imaging Market Outlook, By Other Applications (2021-2030) ($MN)
69 Europe Photoacoustic Imaging Market Outlook, By End User (2021-2030) ($MN)
70 Europe Photoacoustic Imaging Market Outlook, By Hospitals and Imaging Centers (2021-2030) ($MN)
71 Europe Photoacoustic Imaging Market Outlook, By Research Institutes and Academia (2021-2030) ($MN)
72 Europe Photoacoustic Imaging Market Outlook, By Other End Users (2021-2030) ($MN)
73 Asia Pacific Photoacoustic Imaging Market Outlook, By Country (2021-2030) ($MN)
74 Asia Pacific Photoacoustic Imaging Market Outlook, By Product (2021-2030) ($MN)
75 Asia Pacific Photoacoustic Imaging Market Outlook, By Software and Accessories (2021-2030) ($MN)
76 Asia Pacific Photoacoustic Imaging Market Outlook, By Imaging Systems (2021-2030) ($MN)
77 Asia Pacific Photoacoustic Imaging Market Outlook, By Lasers (2021-2030) ($MN)
78 Asia Pacific Photoacoustic Imaging Market Outlook, By Contrast Agents (2021-2030) ($MN)
79 Asia Pacific Photoacoustic Imaging Market Outlook, By Transducers (2021-2030) ($MN)
80 Asia Pacific Photoacoustic Imaging Market Outlook, By Other Products (2021-2030) ($MN)
81 Asia Pacific Photoacoustic Imaging Market Outlook, By Type (2021-2030) ($MN)
82 Asia Pacific Photoacoustic Imaging Market Outlook, By Photoacoustic Microscopy (2021-2030) ($MN)
83 Asia Pacific Photoacoustic Imaging Market Outlook, By Photoacoustic Tomography (2021-2030) ($MN)
84 Asia Pacific Photoacoustic Imaging Market Outlook, By Clinical (2021-2030) ($MN)
85 Asia Pacific Photoacoustic Imaging Market Outlook, By Pre Clinical (2021-2030) ($MN)
86 Asia Pacific Photoacoustic Imaging Market Outlook, By Other types (2021-2030) ($MN)
87 Asia Pacific Photoacoustic Imaging Market Outlook, By Application (2021-2030) ($MN)
88 Asia Pacific Photoacoustic Imaging Market Outlook, By Neurology (2021-2030) ($MN)
89 Asia Pacific Photoacoustic Imaging Market Outlook, By Haematology (2021-2030) ($MN)
90 Asia Pacific Photoacoustic Imaging Market Outlook, By Oncology (2021-2030) ($MN)
91 Asia Pacific Photoacoustic Imaging Market Outlook, By Cardiology (2021-2030) ($MN)
92 Asia Pacific Photoacoustic Imaging Market Outlook, By Other Applications (2021-2030) ($MN)
93 Asia Pacific Photoacoustic Imaging Market Outlook, By End User (2021-2030) ($MN)
94 Asia Pacific Photoacoustic Imaging Market Outlook, By Hospitals and Imaging Centers (2021-2030) ($MN)
95 Asia Pacific Photoacoustic Imaging Market Outlook, By Research Institutes and Academia (2021-2030) ($MN)
96 Asia Pacific Photoacoustic Imaging Market Outlook, By Other End Users (2021-2030) ($MN)
97 South America Photoacoustic Imaging Market Outlook, By Country (2021-2030) ($MN)
98 South America Photoacoustic Imaging Market Outlook, By Product (2021-2030) ($MN)
99 South America Photoacoustic Imaging Market Outlook, By Software and Accessories (2021-2030) ($MN)
100 South America Photoacoustic Imaging Market Outlook, By Imaging Systems (2021-2030) ($MN)
101 South America Photoacoustic Imaging Market Outlook, By Lasers (2021-2030) ($MN)
102 South America Photoacoustic Imaging Market Outlook, By Contrast Agents (2021-2030) ($MN)
103 South America Photoacoustic Imaging Market Outlook, By Transducers (2021-2030) ($MN)
104 South America Photoacoustic Imaging Market Outlook, By Other Products (2021-2030) ($MN)
105 South America Photoacoustic Imaging Market Outlook, By Type (2021-2030) ($MN)
106 South America Photoacoustic Imaging Market Outlook, By Photoacoustic Microscopy (2021-2030) ($MN)
107 South America Photoacoustic Imaging Market Outlook, By Photoacoustic Tomography (2021-2030) ($MN)
108 South America Photoacoustic Imaging Market Outlook, By Clinical (2021-2030) ($MN)
109 South America Photoacoustic Imaging Market Outlook, By Pre Clinical (2021-2030) ($MN)
110 South America Photoacoustic Imaging Market Outlook, By Other types (2021-2030) ($MN)
111 South America Photoacoustic Imaging Market Outlook, By Application (2021-2030) ($MN)
112 South America Photoacoustic Imaging Market Outlook, By Neurology (2021-2030) ($MN)
113 South America Photoacoustic Imaging Market Outlook, By Haematology (2021-2030) ($MN)
114 South America Photoacoustic Imaging Market Outlook, By Oncology (2021-2030) ($MN)
115 South America Photoacoustic Imaging Market Outlook, By Cardiology (2021-2030) ($MN)
116 South America Photoacoustic Imaging Market Outlook, By Other Applications (2021-2030) ($MN)
117 South America Photoacoustic Imaging Market Outlook, By End User (2021-2030) ($MN)
118 South America Photoacoustic Imaging Market Outlook, By Hospitals and Imaging Centers (2021-2030) ($MN)
119 South America Photoacoustic Imaging Market Outlook, By Research Institutes and Academia (2021-2030) ($MN)
120 South America Photoacoustic Imaging Market Outlook, By Other End Users (2021-2030) ($MN)
121 Middle East & Africa Photoacoustic Imaging Market Outlook, By Country (2021-2030) ($MN)
122 Middle East & Africa Photoacoustic Imaging Market Outlook, By Product (2021-2030) ($MN)
123 Middle East & Africa Photoacoustic Imaging Market Outlook, By Software and Accessories (2021-2030) ($MN)
124 Middle East & Africa Photoacoustic Imaging Market Outlook, By Imaging Systems (2021-2030) ($MN)
125 Middle East & Africa Photoacoustic Imaging Market Outlook, By Lasers (2021-2030) ($MN)
126 Middle East & Africa Photoacoustic Imaging Market Outlook, By Contrast Agents (2021-2030) ($MN)
127 Middle East & Africa Photoacoustic Imaging Market Outlook, By Transducers (2021-2030) ($MN)
128 Middle East & Africa Photoacoustic Imaging Market Outlook, By Other Products (2021-2030) ($MN)
129 Middle East & Africa Photoacoustic Imaging Market Outlook, By Type (2021-2030) ($MN)
130 Middle East & Africa Photoacoustic Imaging Market Outlook, By Photoacoustic Microscopy (2021-2030) ($MN)
131 Middle East & Africa Photoacoustic Imaging Market Outlook, By Photoacoustic Tomography (2021-2030) ($MN)
132 Middle East & Africa Photoacoustic Imaging Market Outlook, By Clinical (2021-2030) ($MN)
133 Middle East & Africa Photoacoustic Imaging Market Outlook, By Pre Clinical (2021-2030) ($MN)
134 Middle East & Africa Photoacoustic Imaging Market Outlook, By Other types (2021-2030) ($MN)
135 Middle East & Africa Photoacoustic Imaging Market Outlook, By Application (2021-2030) ($MN)
136 Middle East & Africa Photoacoustic Imaging Market Outlook, By Neurology (2021-2030) ($MN)
137 Middle East & Africa Photoacoustic Imaging Market Outlook, By Haematology (2021-2030) ($MN)
138 Middle East & Africa Photoacoustic Imaging Market Outlook, By Oncology (2021-2030) ($MN)
139 Middle East & Africa Photoacoustic Imaging Market Outlook, By Cardiology (2021-2030) ($MN)
140 Middle East & Africa Photoacoustic Imaging Market Outlook, By Other Applications (2021-2030) ($MN)
141 Middle East & Africa Photoacoustic Imaging Market Outlook, By End User (2021-2030) ($MN)
142 Middle East & Africa Photoacoustic Imaging Market Outlook, By Hospitals and Imaging Centers (2021-2030) ($MN)
143 Middle East & Africa Photoacoustic Imaging Market Outlook, By Research Institutes and Academia (2021-2030) ($MN)
144 Middle East & Africa Photoacoustic Imaging Market Outlook, By Other End Users (2021-2030) ($MN)
List of Figures
RESEARCH METHODOLOGY

We at ‘Stratistics’ opt for an extensive research approach which involves data mining, data validation, and data analysis. The various research sources include in-house repository, secondary research, competitor’s sources, social media research, client internal data, and primary research.
Our team of analysts prefers the most reliable and authenticated data sources in order to perform the comprehensive literature search. With access to most of the authenticated data bases our team highly considers the best mix of information through various sources to obtain extensive and accurate analysis.
Each report takes an average time of a month and a team of 4 industry analysts. The time may vary depending on the scope and data availability of the desired market report. The various parameters used in the market assessment are standardized in order to enhance the data accuracy.
Data Mining
The data is collected from several authenticated, reliable, paid and unpaid sources and is filtered depending on the scope & objective of the research. Our reports repository acts as an added advantage in this procedure. Data gathering from the raw material suppliers, distributors and the manufacturers is performed on a regular basis, this helps in the comprehensive understanding of the products value chain. Apart from the above mentioned sources the data is also collected from the industry consultants to ensure the objective of the study is in the right direction.
Market trends such as technological advancements, regulatory affairs, market dynamics (Drivers, Restraints, Opportunities and Challenges) are obtained from scientific journals, market related national & international associations and organizations.
Data Analysis
From the data that is collected depending on the scope & objective of the research the data is subjected for the analysis. The critical steps that we follow for the data analysis include:
- Product Lifecycle Analysis
- Competitor analysis
- Risk analysis
- Porters Analysis
- PESTEL Analysis
- SWOT Analysis
The data engineering is performed by the core industry experts considering both the Marketing Mix Modeling and the Demand Forecasting. The marketing mix modeling makes use of multiple-regression techniques to predict the optimal mix of marketing variables. Regression factor is based on a number of variables and how they relate to an outcome such as sales or profits.
Data Validation
The data validation is performed by the exhaustive primary research from the expert interviews. This includes telephonic interviews, focus groups, face to face interviews, and questionnaires to validate our research from all aspects. The industry experts we approach come from the leading firms, involved in the supply chain ranging from the suppliers, distributors to the manufacturers and consumers so as to ensure an unbiased analysis.
We are in touch with more than 15,000 industry experts with the right mix of consultants, CEO's, presidents, vice presidents, managers, experts from both supply side and demand side, executives and so on.
The data validation involves the primary research from the industry experts belonging to:
- Leading Companies
- Suppliers & Distributors
- Manufacturers
- Consumers
- Industry/Strategic Consultants
Apart from the data validation the primary research also helps in performing the fill gap research, i.e. providing solutions for the unmet needs of the research which helps in enhancing the reports quality.
For more details about research methodology, kindly write to us at info@strategymrc.com
Frequently Asked Questions
In case of any queries regarding this report, you can contact the customer service by filing the “Inquiry Before Buy” form available on the right hand side. You may also contact us through email: info@strategymrc.com or phone: +1-301-202-5929
Yes, the samples are available for all the published reports. You can request them by filling the “Request Sample” option available in this page.
Yes, you can request a sample with your specific requirements. All the customized samples will be provided as per the requirement with the real data masked.
All our reports are available in Digital PDF format. In case if you require them in any other formats, such as PPT, Excel etc you can submit a request through “Inquiry Before Buy” form available on the right hand side. You may also contact us through email: info@strategymrc.com or phone: +1-301-202-5929
We offer a free 15% customization with every purchase. This requirement can be fulfilled for both pre and post sale. You may send your customization requirements through email at info@strategymrc.com or call us on +1-301-202-5929.
We have 3 different licensing options available in electronic format.
- Single User Licence: Allows one person, typically the buyer, to have access to the ordered product. The ordered product cannot be distributed to anyone else.
- 2-5 User Licence: Allows the ordered product to be shared among a maximum of 5 people within your organisation.
- Corporate License: Allows the product to be shared among all employees of your organisation regardless of their geographical location.
All our reports are typically be emailed to you as an attachment.
To order any available report you need to register on our website. The payment can be made either through CCAvenue or PayPal payments gateways which accept all international cards.
We extend our support to 6 months post sale. A post sale customization is also provided to cover your unmet needs in the report.
Request Customization
We offer complimentary customization of up to 15% with every purchase. To share your customization requirements, feel free to email us at info@strategymrc.com or call us on +1-301-202-5929. .
Please Note: Customization within the 15% threshold is entirely free of charge. If your request exceeds this limit, we will conduct a feasibility assessment. Following that, a detailed quote and timeline will be provided.
WHY CHOOSE US ?

Assured Quality
Best in class reports with high standard of research integrity

24X7 Research Support
Continuous support to ensure the best customer experience.

Free Customization
Adding more values to your product of interest.

Safe & Secure Access
Providing a secured environment for all online transactions.

Trusted by 600+ Brands
Serving the most reputed brands across the world.