
Pipeline And Process Services Market
Pipeline and Process Services Market Forecasts to 2030 - Global Analysis By Asset Type (Pipeline, Process and Other Asset Types), Raw Material (Plastic, Carbon Steel, Steel and Other Raw Materials), Operation (Pre-commissioning & Commissioning, Maintenance and Inspection, Decommissioning and Other Operations), End User and by Geography

|
Years Covered |
2021-2030 |
|
Estimated Year Value (2023) |
US $3.85 MN |
|
Projected Year Value (2030) |
US $6.39 MN |
|
CAGR (2023 - 2030) |
7.5% |
|
Regions Covered |
North America, Europe, Asia Pacific, South America, and Middle East & Africa |
|
Countries Covered |
US, Canada, Mexico, Germany, UK, Italy, France, Spain, Japan, China, India, Australia, New Zealand, South Korea, Rest of Asia Pacific, South America, Argentina, Brazil, Chile, Middle East & Africa, Saudi Arabia, UAE, Qatar, and South Africa |
|
Largest Market |
Asia Pacific |
|
Highest Growing Market |
Middle East & Africa |
According to Stratistics MRC, the Global Pipeline and Process Services Market is accounted for $3.85 billion in 2023 and is expected to reach $6.39 billion by 2030 growing at a CAGR of 7.5% during the forecast period. The optimization of manufacturing processes and the effective long-distance transportation of liquids and gases are dependent on pipeline and process services, which are essential to industries. Moreover, oil and natural gas can be moved safely thanks to pipelines, and quality control and production coordination are just two examples of the services provided by process services. Collectively, they facilitate the efficient allocation of resources and make substantial contributions to cost containment, industry standard observance, and operational effectiveness, all of which are critical to maintaining productivity across a range of industries.
According to the International Pipeline and Process Services Association, the seamless integration of pipeline and process services is fundamental for ensuring the reliable transportation of materials and the optimization of manufacturing processes across diverse industries.
Market Dynamics:
Driver:
Increasing demand for energy
The need for strong pipeline and process services is fueled by the world's energy consumption rising exponentially as a result of expanding economies and growing populations. Building large pipeline networks becomes essential as countries work to ensure a steady supply of energy. Additionally, the search and extraction of unconventional energy sources, which calls for sophisticated services to move these resources effectively, emphasizes this driver even more.
Restraint:
Environmental issues and resistance
The market for pipeline and process services is constrained by community opposition and increased environmental awareness, even in spite of the growing demand for energy resources. Project approvals are hampered by worries about possible ecological effects, habitat disruption, and water contamination linked to pipeline construction. Furthermore, obstacles such as legal issues, regulatory scrutiny, and community activism make comprehensive environmental impact assessments and community engagement plans essential for the development of sustainable projects.
Opportunity:
Increase in capturing and storing carbon
There are new opportunities in the field of carbon capture and storage due to the increased focus on reducing climate change. Transporting captured carbon dioxide for storage or use in different industries can be done with pipeline infrastructure. Moreover, businesses in the pipeline and process services sector can help mitigate climate change and diversify their service offerings by investing in CCS initiatives, as governments and businesses do.
Threat:
Increased uncertainties in the economy
The financial viability of pipeline projects is threatened by economic uncertainties like commodity price fluctuations or global recessions. Market expansion may be hampered by reduced energy infrastructure investment, difficult financing situations, and postponed project approvals. Additionally, to effectively navigate economic uncertainties, businesses must put risk mitigation strategies into practice, diversify their revenue streams, and maintain financial resilience.
Covid-19 Impact:
The market for pipeline and process services has been significantly impacted by the COVID-19 pandemic, which has brought with it both opportunities and challenges. The industry's resilience has been put to the test by the early disruptions, which included workforce constraints brought on by lockdowns and travel restrictions, delays in projects, and disruptions in the supply chain. Moreover, to improve operational efficiency, the pandemic has hastened the adoption of digital technologies for automation, data analytics, and remote monitoring.
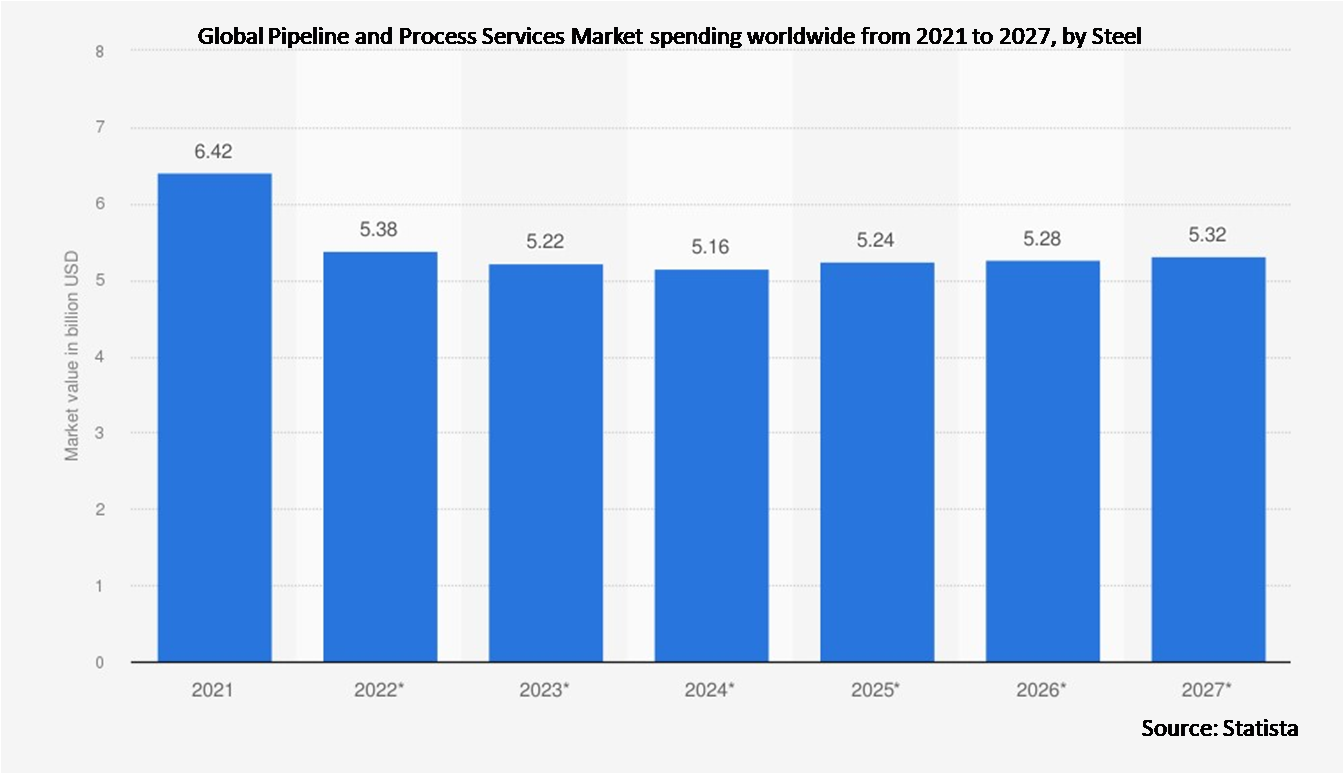
The Carbon Steel segment is expected to be the largest during the forecast period
It is projected that the carbon steel segment will command the largest market share. Because carbon steel is strong, durable, and affordable, it is widely used in many different industries. Carbon steel is a common material used in manufacturing, infrastructure, and construction projects because of its strength and adaptability. Additionally, its supremacy is attributed to its capacity to satisfy a wide range of industrial needs, from the fabrication of machinery and equipment to structural applications.
The Water Treatment Industry segment is expected to have the highest CAGR during the forecast period
The industry that is at the center of the market is the water treatment industry, which has continuously shown the highest CAGR. Growing worries about water scarcity, strict environmental laws, and a growing focus on sustainable water management techniques are driving this industry's expansion. Furthermore, the water treatment industry continues to be a major player in addressing the urgent problems with water quality and supply that societies around the world are facing, which makes it a desirable and rapidly changing market for innovation and investment.
Region with largest share:
It is projected that the Asia-Pacific region will command the largest market share. The region is well-known due to its quick industrialization, thriving manufacturing sector, and sizable population base that fuels demand from consumers. In this economic environment, nations like China, India, and Japan are essential because they promote significant market expansion in a variety of industries. Moreover, the Asia-Pacific region continues to attract businesses and investors due to factors like growing infrastructure projects, technological advancements, and advantageous economic policies.
Region with highest CAGR:
The market's highest CAGR is projected to be seen in the Middle East and Africa (MENA) region, owing by large-scale infrastructure investments, especially in industries like renewable energy, construction, and oil and gas. Rapid economic development has occurred in nations like Saudi Arabia, Qatar, and the United Arab Emirates, which has created a favourable atmosphere for market expansion. Additionally, the MENA region has the potential to experience rapid growth in a number of industries due to its advantageous geographic location, efforts to diversify its economies, and improvements to its industrial capabilities.

Key players in the market
Some of the key players in Pipeline and Process Services market include EnerMech, Dexon Technology PLC, BlueFin Services, Techfem, Altus Intervention, Oceaneering International, Inc, Step Energy Services, Halliburton, Enerpac Tool Group, Baker Hughes Company and Chenergy Services Limited.
Key Developments:
In January 2024, Bluefin launched a new ShieldConex capability providing token and/or EMV/P2PE based processing services to any payment processor, as well as protecting Personally Identifiable Information and Protected Health Information (PII/PHI) endpoints. For enterprise merchants looking for a universal solution, the endpoint-agnostic upgrade to ShieldConex unlocks enormous value by minimizing the PCI and PII footprint while avoiding long-term processor lock in.
In August 2023, Integrated solutions specialists EnerMech has been awarded a five-year multi-million contract by TotalEnergies EP Congo for crane and lifting maintenance at a new facility to be built at Pointe-Noire, the second largest city in Congo. The work scope will include specific maintenance of crane and lifting equipment, and onshore and offshore parts supply for three offshore sectors which include Likouf and Nkossa. The agreement also includes riser pulling systems, mooring and tensioning systems.
In May 2023, Dexon Technology, a Thai company that provides pipeline inspection services, has decided to expand its business into the US and the Netherlands by using proceeds from its recent fundraising scheme. The firm's board of executives approved the plan by setting up a wholly-owned subsidiary named Dexon Technology USA Inc, with registered capital of US$1 million, or around 33.8 million baht.
Asset Types Covered:
• Pipeline
• Process
• Other Asset Types
Raw Materials Covered:
• Plastic
• Carbon Steel
• Steel
• Other Raw Materials
Operations Covered:
• Pre-commissioning & Commissioning
• Maintenance and Inspection
• Decommissioning
• Other Operations
End Users Covered:
• Oil and Gas Industry
• Chemical Industry
• Water Treatment Industry
• Construction and Manufacturing Industry
• Other End Users
Regions Covered:
• North America
o US
o Canada
o Mexico
• Europe
o Germany
o UK
o Italy
o France
o Spain
o Rest of Europe
• Asia Pacific
o Japan
o China
o India
o Australia
o New Zealand
o South Korea
o Rest of Asia Pacific
• South America
o Argentina
o Brazil
o Chile
o Rest of South America
• Middle East & Africa
o Saudi Arabia
o UAE
o Qatar
o South Africa
o Rest of Middle East & Africa
What our report offers:
- Market share assessments for the regional and country-level segments
- Strategic recommendations for the new entrants
- Covers Market data for the years 2021, 2022, 2023, 2026, and 2030
- Market Trends (Drivers, Constraints, Opportunities, Threats, Challenges, Investment Opportunities, and recommendations)
- Strategic recommendations in key business segments based on the market estimations
- Competitive landscaping mapping the key common trends
- Company profiling with detailed strategies, financials, and recent developments
- Supply chain trends mapping the latest technological advancements
Free Customization Offerings:
All the customers of this report will be entitled to receive one of the following free customization options:
• Company Profiling
o Comprehensive profiling of additional market players (up to 3)
o SWOT Analysis of key players (up to 3)
• Regional Segmentation
o Market estimations, Forecasts and CAGR of any prominent country as per the client's interest (Note: Depends on feasibility check)
• Competitive Benchmarking
Benchmarking of key players based on product portfolio, geographical presence, and strategic alliances
Table of Contents
1 Executive Summary
2 Preface
2.1 Abstract
2.2 Stake Holders
2.3 Research Scope
2.4 Research Methodology
2.4.1 Data Mining
2.4.2 Data Analysis
2.4.3 Data Validation
2.4.4 Research Approach
2.5 Research Sources
2.5.1 Primary Research Sources
2.5.2 Secondary Research Sources
2.5.3 Assumptions
3 Market Trend Analysis
3.1 Introduction
3.2 Drivers
3.3 Restraints
3.4 Opportunities
3.5 Threats
3.6 End User Analysis
3.7 Emerging Markets
3.8 Impact of Covid-19
4 Porters Five Force Analysis
4.1 Bargaining power of suppliers
4.2 Bargaining power of buyers
4.3 Threat of substitutes
4.4 Threat of new entrants
4.5 Competitive rivalry
5 Global Pipeline and Process Services Market, By Asset Type
5.1 Introduction
5.2 Pipeline
5.2.1 Transmission Pipelines
5.2.2 Distribution Pipelines
5.3 Process
5.3.1 Refinery & Petrochemical Facility Management
5.3.2 FPS Management
5.3.3 Gas Processing
5.3.4 Gas Storage
5.4 Other Asset Types
6 Global Pipeline and Process Services Market, By Raw Material
6.1 Introduction
6.2 Plastic
6.3 Carbon Steel
6.4 Steel
6.5 Other Raw Materials
7 Global Pipeline and Process Services Market, By Operation
7.1 Introduction
7.2 Pre-commissioning & Commissioning
7.3 Maintenance and Inspection
7.4 Decommissioning
7.5 Other Operations
8 Global Pipeline and Process Services Market, By End User
8.1 Introduction
8.2 Oil and Gas Industry
8.3 Chemical Industry
8.4 Water Treatment Industry
8.5 Construction and Manufacturing Industry
8.6 Other End Users
9 Global Pipeline and Process Services Market, By Geography
9.1 Introduction
9.2 North America
9.2.1 US
9.2.2 Canada
9.2.3 Mexico
9.3 Europe
9.3.1 Germany
9.3.2 UK
9.3.3 Italy
9.3.4 France
9.3.5 Spain
9.3.6 Rest of Europe
9.4 Asia Pacific
9.4.1 Japan
9.4.2 China
9.4.3 India
9.4.4 Australia
9.4.5 New Zealand
9.4.6 South Korea
9.4.7 Rest of Asia Pacific
9.5 South America
9.5.1 Argentina
9.5.2 Brazil
9.5.3 Chile
9.5.4 Rest of South America
9.6 Middle East & Africa
9.6.1 Saudi Arabia
9.6.2 UAE
9.6.3 Qatar
9.6.4 South Africa
9.6.5 Rest of Middle East & Africa
10 Key Developments
10.1 Agreements, Partnerships, Collaborations and Joint Ventures
10.2 Acquisitions & Mergers
10.3 New Product Launch
10.4 Expansions
10.5 Other Key Strategies
11 Company Profiling
11.1 EnerMech
11.2 Dexon Technology PLC
11.3 BlueFin Services
11.4 Techfem
11.5 Altus Intervention
11.6 Oceaneering International, Inc
11.7 Step Energy Services
11.8 Halliburton
11.9 Enerpac Tool Group
11.10 Baker Hughes Company
11.11 Chenergy Services Limited
List of Tables
1 Global Pipeline and Process Services Market Outlook, By Region (2021-2030) ($MN)
2 Global Pipeline and Process Services Market Outlook, By Asset Type (2021-2030) ($MN)
3 Global Pipeline and Process Services Market Outlook, By Pipeline (2021-2030) ($MN)
4 Global Pipeline and Process Services Market Outlook, By Transmission Pipelines (2021-2030) ($MN)
5 Global Pipeline and Process Services Market Outlook, By Distribution Pipelines (2021-2030) ($MN)
6 Global Pipeline and Process Services Market Outlook, By Process (2021-2030) ($MN)
7 Global Pipeline and Process Services Market Outlook, By Refinery & Petrochemical Facility Management (2021-2030) ($MN)
8 Global Pipeline and Process Services Market Outlook, By FPS Management (2021-2030) ($MN)
9 Global Pipeline and Process Services Market Outlook, By Gas Processing (2021-2030) ($MN)
10 Global Pipeline and Process Services Market Outlook, By Gas Storage (2021-2030) ($MN)
11 Global Pipeline and Process Services Market Outlook, By Other Asset Types (2021-2030) ($MN)
12 Global Pipeline and Process Services Market Outlook, By Raw Material (2021-2030) ($MN)
13 Global Pipeline and Process Services Market Outlook, By Plastic (2021-2030) ($MN)
14 Global Pipeline and Process Services Market Outlook, By Carbon Steel (2021-2030) ($MN)
15 Global Pipeline and Process Services Market Outlook, By Steel (2021-2030) ($MN)
16 Global Pipeline and Process Services Market Outlook, By Other Raw Materials (2021-2030) ($MN)
17 Global Pipeline and Process Services Market Outlook, By Operation (2021-2030) ($MN)
18 Global Pipeline and Process Services Market Outlook, By Pre-commissioning & Commissioning (2021-2030) ($MN)
19 Global Pipeline and Process Services Market Outlook, By Maintenance and Inspection (2021-2030) ($MN)
20 Global Pipeline and Process Services Market Outlook, By Decommissioning (2021-2030) ($MN)
21 Global Pipeline and Process Services Market Outlook, By Other Operations (2021-2030) ($MN)
22 Global Pipeline and Process Services Market Outlook, By End User (2021-2030) ($MN)
23 Global Pipeline and Process Services Market Outlook, By Oil and Gas Industry (2021-2030) ($MN)
24 Global Pipeline and Process Services Market Outlook, By Chemical Industry (2021-2030) ($MN)
25 Global Pipeline and Process Services Market Outlook, By Water Treatment Industry (2021-2030) ($MN)
26 Global Pipeline and Process Services Market Outlook, By Construction and Manufacturing Industry (2021-2030) ($MN)
27 Global Pipeline and Process Services Market Outlook, By Other End Users (2021-2030) ($MN)
Note: Tables for North America, Europe, APAC, South America, and Middle East & Africa Regions are also represented in the same manner as above.
List of Figures
RESEARCH METHODOLOGY

We at ‘Stratistics’ opt for an extensive research approach which involves data mining, data validation, and data analysis. The various research sources include in-house repository, secondary research, competitor’s sources, social media research, client internal data, and primary research.
Our team of analysts prefers the most reliable and authenticated data sources in order to perform the comprehensive literature search. With access to most of the authenticated data bases our team highly considers the best mix of information through various sources to obtain extensive and accurate analysis.
Each report takes an average time of a month and a team of 4 industry analysts. The time may vary depending on the scope and data availability of the desired market report. The various parameters used in the market assessment are standardized in order to enhance the data accuracy.
Data Mining
The data is collected from several authenticated, reliable, paid and unpaid sources and is filtered depending on the scope & objective of the research. Our reports repository acts as an added advantage in this procedure. Data gathering from the raw material suppliers, distributors and the manufacturers is performed on a regular basis, this helps in the comprehensive understanding of the products value chain. Apart from the above mentioned sources the data is also collected from the industry consultants to ensure the objective of the study is in the right direction.
Market trends such as technological advancements, regulatory affairs, market dynamics (Drivers, Restraints, Opportunities and Challenges) are obtained from scientific journals, market related national & international associations and organizations.
Data Analysis
From the data that is collected depending on the scope & objective of the research the data is subjected for the analysis. The critical steps that we follow for the data analysis include:
- Product Lifecycle Analysis
- Competitor analysis
- Risk analysis
- Porters Analysis
- PESTEL Analysis
- SWOT Analysis
The data engineering is performed by the core industry experts considering both the Marketing Mix Modeling and the Demand Forecasting. The marketing mix modeling makes use of multiple-regression techniques to predict the optimal mix of marketing variables. Regression factor is based on a number of variables and how they relate to an outcome such as sales or profits.
Data Validation
The data validation is performed by the exhaustive primary research from the expert interviews. This includes telephonic interviews, focus groups, face to face interviews, and questionnaires to validate our research from all aspects. The industry experts we approach come from the leading firms, involved in the supply chain ranging from the suppliers, distributors to the manufacturers and consumers so as to ensure an unbiased analysis.
We are in touch with more than 15,000 industry experts with the right mix of consultants, CEO's, presidents, vice presidents, managers, experts from both supply side and demand side, executives and so on.
The data validation involves the primary research from the industry experts belonging to:
- Leading Companies
- Suppliers & Distributors
- Manufacturers
- Consumers
- Industry/Strategic Consultants
Apart from the data validation the primary research also helps in performing the fill gap research, i.e. providing solutions for the unmet needs of the research which helps in enhancing the reports quality.
For more details about research methodology, kindly write to us at info@strategymrc.com
Frequently Asked Questions
In case of any queries regarding this report, you can contact the customer service by filing the “Inquiry Before Buy” form available on the right hand side. You may also contact us through email: info@strategymrc.com or phone: +1-301-202-5929
Yes, the samples are available for all the published reports. You can request them by filling the “Request Sample” option available in this page.
Yes, you can request a sample with your specific requirements. All the customized samples will be provided as per the requirement with the real data masked.
All our reports are available in Digital PDF format. In case if you require them in any other formats, such as PPT, Excel etc you can submit a request through “Inquiry Before Buy” form available on the right hand side. You may also contact us through email: info@strategymrc.com or phone: +1-301-202-5929
We offer a free 15% customization with every purchase. This requirement can be fulfilled for both pre and post sale. You may send your customization requirements through email at info@strategymrc.com or call us on +1-301-202-5929.
We have 3 different licensing options available in electronic format.
- Single User Licence: Allows one person, typically the buyer, to have access to the ordered product. The ordered product cannot be distributed to anyone else.
- 2-5 User Licence: Allows the ordered product to be shared among a maximum of 5 people within your organisation.
- Corporate License: Allows the product to be shared among all employees of your organisation regardless of their geographical location.
All our reports are typically be emailed to you as an attachment.
To order any available report you need to register on our website. The payment can be made either through CCAvenue or PayPal payments gateways which accept all international cards.
We extend our support to 6 months post sale. A post sale customization is also provided to cover your unmet needs in the report.
Request Customization
We offer complimentary customization of up to 15% with every purchase. To share your customization requirements, feel free to email us at info@strategymrc.com or call us on +1-301-202-5929. .
Please Note: Customization within the 15% threshold is entirely free of charge. If your request exceeds this limit, we will conduct a feasibility assessment. Following that, a detailed quote and timeline will be provided.
WHY CHOOSE US ?

Assured Quality
Best in class reports with high standard of research integrity

24X7 Research Support
Continuous support to ensure the best customer experience.

Free Customization
Adding more values to your product of interest.

Safe & Secure Access
Providing a secured environment for all online transactions.

Trusted by 600+ Brands
Serving the most reputed brands across the world.