
Prebiotic Ingredients Market
"Prebiotic Ingredients Market Forecasts to 2028 – Global Analysis By Type (Inulin, Fructooligosaccharide (FOS), Galactooligosaccharide (GOS)), Brand, (Domo Vivinal GOS, Fibregum, Frutafit ), Source (Roots Grains) and By Geography "

|
Years Covered |
2020-2028 |
|
Estimated Year Value (2021) |
US $5.84 BN |
|
Projected Year Value (2028) |
US $14.35 BN |
|
CAGR (2021 - 2028) |
13.7% |
|
Regions Covered |
North America, Europe, Asia Pacific, South America, and Middle East & Africa |
|
Countries Covered |
US, Canada, Mexico, Germany, UK, Italy, France, Spain, Japan, China, India, Australia, New Zealand, South Korea, Rest of Asia Pacific, South America, Argentina, Brazil, Chile, Middle East & Africa, Saudi Arabia, UAE, Qatar, and South Africa |
|
Largest Market |
Asia Pacific |
|
Highest Growing Market |
Europ |
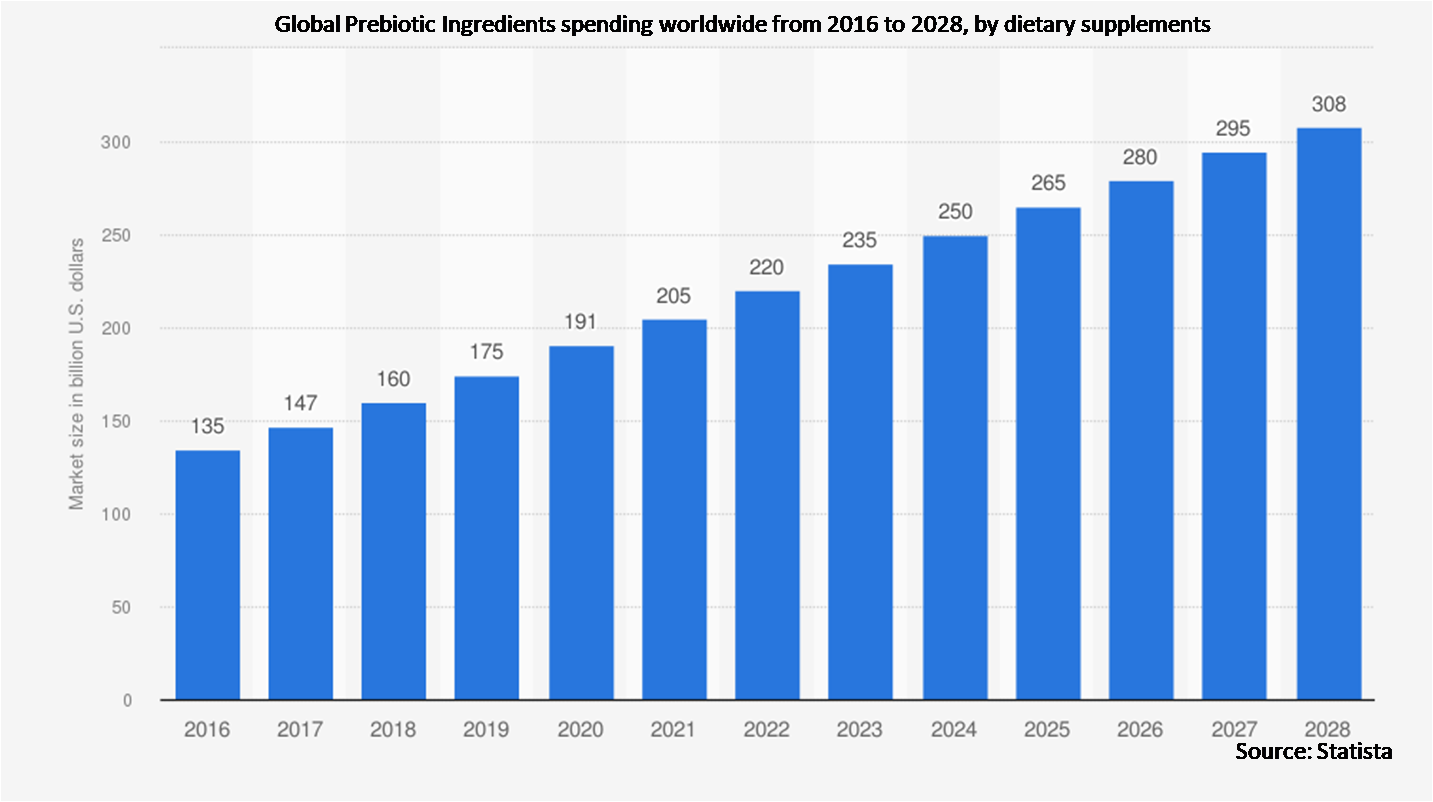
According to Stratistics MRC, the Global Prebiotic Ingredients Market is accounted for $5.84 billion in 2021 and is expected to reach $14.35 billion by 2028 growing at a CAGR of 13.7% during the forecast period. Prebiotics are carbohydrates that are not digested by digestive enzymes or acids and help beneficial bacteria grow or function better in the human stomach. They aid in the improvement of gut barrier function, the strengthening of the immune system, the reduction of stomach inflammation, the improvement of overall digestive health, the reduction of the risk of diarrhea, increase in calcium absorption to promote bone density, and reduce cardiovascular disease risk factors.
Market Dynamics:
Driver:
Growing Prebiotic Consumption for Gut Health
Its substances are found in over 1,400 foods and beverages. It is being used by manufacturers in a range of end-use industries to create a low-calorie food, which is fuelling the market growth. The market of it is expected to develop, mostly in American and European countries, due to the rising demand for healthy foods containing prebiotic ingredients. In the food processing industry, galactooligosaccharides (GOS) and fructooligosaccharides (FOS) are widely used because they are easy on the digestive system.
Restraint:
High Cost
High production costs of prebiotic ingredients, the requirement for extensive testing procedures, and stringent rules for approval causing delays are major factors that could hamper the growth of the global market to a certain extent. Additionally, the long and well-controlled trials that must be conducted to produce prebiotic components are expected to be a barrier to the Prebiotics Ingredients Market.
Opportunity:
Growing Inclination of Plant Based Products
Manufacturers in several industries are attempting to include natural components in their products since consumers prefer plant-based and natural products. Natural dietary fiber is the principal source of prebiotic compounds. As people become more aware of the negative effects of antibiotics and other chemicals included in processed foods, they consume more prebiotic fibers. As a result, the growing preference for plant-based products is expected to have a favorable impact on the prebiotics market. Prebiotic fiber compounds that are heat and pH stable. The multiple advantages of prebiotics have increased their demand in the end-use industry, which is projected to fuel the prebiotics market's growth.
Threat:
Lack of Consciousness
Lack of awareness regarding the products and over consumption of mineral ingredients. Some of the causes that are anticipated to stymie the development of the market are the extensive and well-controlled experiments that must be conducted in order to manufacture prebiotic components.
Inulin segment is expected to be the largest during the forecast period
At ease sourcing of raw material for the extraction of inulin has accredited for a higher market share and faster growth rate. Chicory roots, the major source are widely cultivated across the globe, and the proliferation of products of high value in the market has paved the way for increasing arable land for inulin. Inulin has also shown fewer production barriers for the manufacturers as it can be easily incorporated into the processing of finished food products without altering their taste and texture. Another factor boosting the segmental growth is the low prices in the market.
The Food & beverage segment is expected to have the highest CAGR during the forecast period
Due to an upsurge in consumer spending on goods that improve intestinal health. As consumers become increasingly aware of the need for protein consumption in maintaining adequate nutritional levels and muscle mass, market demand for these goods is growing. The increased importance of animal proteins and fortification of animal feed with bacteria that improve animal gut health is likely to boost prebiotics demand in the animal feed sector during the forecast period.
Region with highest share:
The Asia Pacific is projected to hold the highest market share; this is accredited to the growing government initiatives to enhance consumer knowledge towards innovations in the field of prebiotic ingredients, and increasing focus on the research & development to adopt prebiotic ingredients in dietary formulations that offer health benefits. The market in this region is growing due to raising customer interest in a healthy diet and an increase in the number of applications in the food and beverage industry.
Region with highest CAGR:
Europe is projected to have the highest CAGR, owing to the increasing demand for fortifying food with prebiotic ingredients among the population and rising demand from the food & beverage and animal feed industry. Rising awareness regarding health benefits and the surge in the aging population are some of the major factors to boost the market, both in food and beverages and pharmaceuticals, since prebiotics aid in digestion and healthy bowel movements. According to Sensus, the European bakery market witnessed 228 product launches in the last year, having labels mentioning inulin, oligofructose, or chicory root fiber on the packaging. 11% of these launches were in the United Kingdom. The European dietary supplement market is driven by the growing acceptance of these supplements among the aging population and the increasing incidences of lifestyle disorders.

Key players in the market:
Some of the key players profiled in the Prebiotic Ingredients Market include Koninklijke FrieslandCampina N.V., Roquette Frères S.A., Kerry Group plc, Ingredion Incorporated, Cargill, Incorporated, Yakult Honsha Co.,Ltd., Cosucra Groupe Warcoing SA, BENEO GmbH, Fonterra Co-operative Group Limited, Sensus America, Inc., Jarrow Formulas, Inc., Nexira, Prenexus Health, Tereos Group.
Key developments:
In December 2017: DuPont partnered with the APC Microbiome Institute in Ireland, the venture's first major partnership, in order to create solutions that establish a healthy microbiome for infants.
In October 2016: Ingredion Incorporated launched a prebiotic fiber, Nutraflora L95-S, which is an expansion of Nutraflora prebiotic fiber scFOS portfolio. This prebiotic may reduce the sugar and calorie levels by 30% in bakery products, thus, holding a major application in the bakery industry.
In November 2018: Tereos SA announced that it opened an R&D center in Singapore, thus, bringing innovative solutions to the food sector in the Asia-Pacific region and leveraging the group’s extensive portfolio of products to address the regional demand for noodles, bakery products, confectionery, teas, sauces, snacks, and beverages.
Types Covered:
• Inulin
• Fructooligosaccharide (FOS)
• Galactooligosaccharide (GOS)
• Other Types
• Mannan-Oligosaccharide (MOS)
• Disaccharides
• Monosaccharide
• Nucleotide-Activated Saccharides
• Soy Oligosaccharides
• Polydextrose
Brands Covered:
• Domo Vivinal GOS
• Fibregum
• Frutafit
• Frutalose
• Nutraflora
• Oliggo-Fiber
• Orafti HPX
• Osmoaid
Sources Covered:
• Roots
• Grains
• Vegetables
• Fruit Trunk or Stem
Bacterial Activity’s Covered:
• Bifidobacteria
• Lactic Acid Bacteria
Functionality’s Covered:
• Gut Health
• Cardiovascular Health
• Bone Health
• Immunity
• Weight Management
Applications Covered:
• Dietary Supplements
• Functional Food and Beverage
• Infant Formula and Baby Food
• Animal Feed
• Bakery and Confectionery
• Breakfast Cereal
• Clinical Nutrition
• Dairy and Frozen Desserts
• Oil And Fats
• Sweet and Savory Snacks
End Users Covered:
• Animal
• Human
Regions Covered:
• North America
o US
o Canada
o Mexico
• Europe
o Germany
o UK
o Italy
o France
o Spain
o Rest of Europe
• Asia Pacific
o Japan
o China
o India
o Australia
o New Zealand
o South Korea
o Rest of Asia Pacific
• South America
o Argentina
o Brazil
o Chile
o Rest of South America
• Middle East & Africa
o Saudi Arabia
o UAE
o Qatar
o South Africa
o Rest of Middle East & Africa
What our report offers:
- Market share assessments for the regional and country-level segments
- Strategic recommendations for the new entrants
- Covers Market data for the years 2020, 2021, 2022, 2025 and 2028
- Market Trends (Drivers, Constraints, Opportunities, Threats, Challenges, Investment Opportunities, and recommendations)
- Strategic recommendations in key business segments based on the market estimations
- Competitive landscaping mapping the key common trends
- Company profiling with detailed strategies, financials, and recent developments
- Supply chain trends mapping the latest technological advancements
Free Customization Offerings:
All the customers of this report will be entitled to receive one of the following free customization options:
• Company Profiling
o Comprehensive profiling of additional market players (up to 3)
o SWOT Analysis of key players (up to 3)
• Regional Segmentation
o Market estimations, Forecasts and CAGR of any prominent country as per the client's interest (Note: Depends on feasibility check)
• Competitive Benchmarking
o Benchmarking of key players based on product portfolio, geographical presence, and strategic alliances
Table of Contents
1 Executive Summary
2 Preface
2.1 Abstract
2.2 Stake Holders
2.3 Research Scope
2.4 Research Methodology
2.4.1 Data Mining
2.4.2 Data Analysis
2.4.3 Data Validation
2.4.4 Research Approach
2.5 Research Sources
2.5.1 Primary Research Sources
2.5.2 Secondary Research Sources
2.5.3 Assumptions
3 Market Trend Analysis
3.1 Introduction
3.2 Drivers
3.3 Restraints
3.4 Opportunities
3.5 Threats
3.6 Application Analysis
3.7 End User Analysis
3.8 Emerging Markets
3.9 Impact of Covid-19
4 Porters Five Force Analysis
4.1 Bargaining power of suppliers
4.2 Bargaining power of buyers
4.3 Threat of substitutes
4.4 Threat of new entrants
4.5 Competitive rivalry
5 Global Prebiotic Ingredients Market, By Type
5.1 Introduction
5.2 Inulin
5.3 Fructooligosaccharide (FOS)
5.4 Galactooligosaccharide (GOS)
5.5 Mannan-Oligosaccharide (MOS)
5.6 Disaccharides
5.7 Monosaccharide
5.8 Nucleotide-Activated Saccharides
5.9 Soy Oligosaccharides
5.10 Polydextrose
6 Global Prebiotic Ingredients Market, By Brand
6.1 Introduction
6.2 Domo Vivinal GOS
6.3 Fibregum
6.4 Frutafit
6.5 Frutalose
6.6 Nutraflora
6.7 Oliggo-Fiber
6.8 Orafti HPX
6.9 Osmoaid
7 Global Prebiotic Ingredients Market, By Source
7.1 Introduction
7.2 Roots
7.3 Grains
7.4 Vegetables
7.5 Fruit Trunk or Stem
8 Global Prebiotic Ingredients Market, By Bacterial Activity
8.1 Introduction
8.2 Bifidobacteria
8.3 Lactic Acid Bacteria
9 Global Prebiotic Ingredients Market, By Functionality
9.1 Introduction
9.2 Gut Health
9.3 Cardiovascular Health
9.4 Bone Health
9.5 Immunity
9.6 Weight Management
10 Global Prebiotic Ingredients Market, By Application
10.1 Introduction
10.2 Dietary Supplements
10.3 Functional Food and Beverage
10.4 Infant Formula and Baby Food
10.5 Animal Feed
10.5.1 Ruminant
10.5.2 Poultry
10.5.3 Swine
10.5.4 Aquaculture
10.6 Bakery and Confectionery
10.7 Breakfast Cereal
10.8 Clinical Nutrition
10.9 Dairy and Frozen Desserts
10.10 Oil And Fats
10.11 Sweet and Savory Snacks
11 Global Prebiotic Ingredients Market, By End User
11.1 Introduction
11.2 Animal
11.3 Human
12 Global Prebiotic Ingredients Market, By Geography
12.1 Introduction
12.2 North America
12.2.1 US
12.2.2 Canada
12.2.3 Mexico
12.3 Europe
12.3.1 Germany
12.3.2 UK
12.3.3 Italy
12.3.4 France
12.3.5 Spain
12.3.6 Rest of Europe
12.4 Asia Pacific
12.4.1 Japan
12.4.2 China
12.4.3 India
12.4.4 Australia
12.4.5 New Zealand
12.4.6 South Korea
12.4.7 Rest of Asia Pacific
12.5 South America
12.5.1 Argentina
12.5.2 Brazil
12.5.3 Chile
12.5.4 Rest of South America
12.6 Middle East & Africa
12.6.1 Saudi Arabia
12.6.2 UAE
12.6.3 Qatar
12.6.4 South Africa
12.6.5 Rest of Middle East & Africa
13 Key Developments
13.1 Agreements, Partnerships, Collaborations and Joint Ventures
13.2 Acquisitions & Mergers
13.3 New Product Launch
13.4 Expansions
13.5 Other Key Strategies
14 Company Profiling
14.1 Koninklijke FrieslandCampina N.V.
14.2 Roquette Frères S.A.
14.3 Kerry Group plc
14.4 Ingredion Incorporated
14.5 Cargill, Incorporated
14.6 Yakult Honsha Co.,Ltd.
14.7 Cosucra Groupe Warcoing SA
14.8 BENEO GmbH
14.9 Fonterra Co-operative Group Limited
14.10 Sensus America, Inc.
14.11 Jarrow Formulas, Inc.
14.12 Nexira
14.13 Prenexus Health
14.14 Tereos Group
List of Tables
1 Global Prebiotic Ingredients Market Outlook, By Region (2020-2028) (US $MN)
2 Global Prebiotic Ingredients Market Outlook, By Type (2020-2028) (US $MN)
3 Global Prebiotic Ingredients Market Outlook, By Inulin (2020-2028) (US $MN)
4 Global Prebiotic Ingredients Market Outlook, By Fructooligosaccharide (FOS) (2020-2028) (US $MN)
5 Global Prebiotic Ingredients Market Outlook, By Galactooligosaccharide (GOS) (2020-2028) (US $MN)
6 Global Prebiotic Ingredients Market Outlook, By Mannan-Oligosaccharide (MOS) (2020-2028) (US $MN)
7 Global Prebiotic Ingredients Market Outlook, By Disaccharides (2020-2028) (US $MN)
8 Global Prebiotic Ingredients Market Outlook, By Monosaccharide (2020-2028) (US $MN)
9 Global Prebiotic Ingredients Market Outlook, By Nucleotide-Activated Saccharides (2020-2028) (US $MN)
10 Global Prebiotic Ingredients Market Outlook, By Soy Oligosaccharides (2020-2028) (US $MN)
11 Global Prebiotic Ingredients Market Outlook, By Polydextrose (2020-2028) (US $MN)
12 Global Prebiotic Ingredients Market Outlook, By Brand (2020-2028) (US $MN)
13 Global Prebiotic Ingredients Market Outlook, By Domo Vivinal GOS (2020-2028) (US $MN)
14 Global Prebiotic Ingredients Market Outlook, By Fibregum (2020-2028) (US $MN)
15 Global Prebiotic Ingredients Market Outlook, By Frutafit (2020-2028) (US $MN)
16 Global Prebiotic Ingredients Market Outlook, By Frutalose (2020-2028) (US $MN)
17 Global Prebiotic Ingredients Market Outlook, By Nutraflora (2020-2028) (US $MN)
18 Global Prebiotic Ingredients Market Outlook, By Oliggo-Fiber (2020-2028) (US $MN)
19 Global Prebiotic Ingredients Market Outlook, By Orafti HPX (2020-2028) (US $MN)
20 Global Prebiotic Ingredients Market Outlook, By Osmoaid (2020-2028) (US $MN)
21 Global Prebiotic Ingredients Market Outlook, By Source (2020-2028) (US $MN)
22 Global Prebiotic Ingredients Market Outlook, By Roots (2020-2028) (US $MN)
23 Global Prebiotic Ingredients Market Outlook, By Grains (2020-2028) (US $MN)
24 Global Prebiotic Ingredients Market Outlook, By Vegetables (2020-2028) (US $MN)
25 Global Prebiotic Ingredients Market Outlook, By Fruit Trunk or Stem (2020-2028) (US $MN)
26 Global Prebiotic Ingredients Market Outlook, By Bacterial Activity (2020-2028) (US $MN)
27 Global Prebiotic Ingredients Market Outlook, By Bifidobacteria (2020-2028) (US $MN)
28 Global Prebiotic Ingredients Market Outlook, By Lactic Acid Bacteria (2020-2028) (US $MN)
29 Global Prebiotic Ingredients Market Outlook, By Functionality (2020-2028) (US $MN)
30 Global Prebiotic Ingredients Market Outlook, By Gut Health (2020-2028) (US $MN)
31 Global Prebiotic Ingredients Market Outlook, By Cardiovascular Health (2020-2028) (US $MN)
32 Global Prebiotic Ingredients Market Outlook, By Bone Health (2020-2028) (US $MN)
33 Global Prebiotic Ingredients Market Outlook, By Immunity (2020-2028) (US $MN)
34 Global Prebiotic Ingredients Market Outlook, By Weight Management (2020-2028) (US $MN)
35 Global Prebiotic Ingredients Market Outlook, By Application (2020-2028) (US $MN)
36 Global Prebiotic Ingredients Market Outlook, By Dietary Supplements (2020-2028) (US $MN)
37 Global Prebiotic Ingredients Market Outlook, By Functional Food and Beverage (2020-2028) (US $MN)
38 Global Prebiotic Ingredients Market Outlook, By Infant Formula and Baby Food (2020-2028) (US $MN)
39 Global Prebiotic Ingredients Market Outlook, By Animal Feed (2020-2028) (US $MN)
40 Global Prebiotic Ingredients Market Outlook, By Ruminant (2020-2028) (US $MN)
41 Global Prebiotic Ingredients Market Outlook, By Poultry (2020-2028) (US $MN)
42 Global Prebiotic Ingredients Market Outlook, By Swine (2020-2028) (US $MN)
43 Global Prebiotic Ingredients Market Outlook, By Aquaculture (2020-2028) (US $MN)
44 Global Prebiotic Ingredients Market Outlook, By Bakery and Confectionery (2020-2028) (US $MN)
45 Global Prebiotic Ingredients Market Outlook, By Breakfast Cereal (2020-2028) (US $MN)
46 Global Prebiotic Ingredients Market Outlook, By Clinical Nutrition (2020-2028) (US $MN)
47 Global Prebiotic Ingredients Market Outlook, By Dairy and Frozen Desserts (2020-2028) (US $MN)
48 Global Prebiotic Ingredients Market Outlook, By Oil And Fats (2020-2028) (US $MN)
49 Global Prebiotic Ingredients Market Outlook, By Sweet and Savory Snacks (2020-2028) (US $MN)
50 Global Prebiotic Ingredients Market Outlook, By End User (2020-2028) (US $MN)
51 Global Prebiotic Ingredients Market Outlook, By Animal (2020-2028) (US $MN)
52 Global Prebiotic Ingredients Market Outlook, By Human (2020-2028) (US $MN)
Note- Tables for North America, Europe, APAC, South America, and Middle East & Africa Regions are also represented in the same manner as above.
List of Figures
RESEARCH METHODOLOGY

We at ‘Stratistics’ opt for an extensive research approach which involves data mining, data validation, and data analysis. The various research sources include in-house repository, secondary research, competitor’s sources, social media research, client internal data, and primary research.
Our team of analysts prefers the most reliable and authenticated data sources in order to perform the comprehensive literature search. With access to most of the authenticated data bases our team highly considers the best mix of information through various sources to obtain extensive and accurate analysis.
Each report takes an average time of a month and a team of 4 industry analysts. The time may vary depending on the scope and data availability of the desired market report. The various parameters used in the market assessment are standardized in order to enhance the data accuracy.
Data Mining
The data is collected from several authenticated, reliable, paid and unpaid sources and is filtered depending on the scope & objective of the research. Our reports repository acts as an added advantage in this procedure. Data gathering from the raw material suppliers, distributors and the manufacturers is performed on a regular basis, this helps in the comprehensive understanding of the products value chain. Apart from the above mentioned sources the data is also collected from the industry consultants to ensure the objective of the study is in the right direction.
Market trends such as technological advancements, regulatory affairs, market dynamics (Drivers, Restraints, Opportunities and Challenges) are obtained from scientific journals, market related national & international associations and organizations.
Data Analysis
From the data that is collected depending on the scope & objective of the research the data is subjected for the analysis. The critical steps that we follow for the data analysis include:
- Product Lifecycle Analysis
- Competitor analysis
- Risk analysis
- Porters Analysis
- PESTEL Analysis
- SWOT Analysis
The data engineering is performed by the core industry experts considering both the Marketing Mix Modeling and the Demand Forecasting. The marketing mix modeling makes use of multiple-regression techniques to predict the optimal mix of marketing variables. Regression factor is based on a number of variables and how they relate to an outcome such as sales or profits.
Data Validation
The data validation is performed by the exhaustive primary research from the expert interviews. This includes telephonic interviews, focus groups, face to face interviews, and questionnaires to validate our research from all aspects. The industry experts we approach come from the leading firms, involved in the supply chain ranging from the suppliers, distributors to the manufacturers and consumers so as to ensure an unbiased analysis.
We are in touch with more than 15,000 industry experts with the right mix of consultants, CEO's, presidents, vice presidents, managers, experts from both supply side and demand side, executives and so on.
The data validation involves the primary research from the industry experts belonging to:
- Leading Companies
- Suppliers & Distributors
- Manufacturers
- Consumers
- Industry/Strategic Consultants
Apart from the data validation the primary research also helps in performing the fill gap research, i.e. providing solutions for the unmet needs of the research which helps in enhancing the reports quality.
For more details about research methodology, kindly write to us at info@strategymrc.com
Frequently Asked Questions
In case of any queries regarding this report, you can contact the customer service by filing the “Inquiry Before Buy” form available on the right hand side. You may also contact us through email: info@strategymrc.com or phone: +1-301-202-5929
Yes, the samples are available for all the published reports. You can request them by filling the “Request Sample” option available in this page.
Yes, you can request a sample with your specific requirements. All the customized samples will be provided as per the requirement with the real data masked.
All our reports are available in Digital PDF format. In case if you require them in any other formats, such as PPT, Excel etc you can submit a request through “Inquiry Before Buy” form available on the right hand side. You may also contact us through email: info@strategymrc.com or phone: +1-301-202-5929
We offer a free 15% customization with every purchase. This requirement can be fulfilled for both pre and post sale. You may send your customization requirements through email at info@strategymrc.com or call us on +1-301-202-5929.
We have 3 different licensing options available in electronic format.
- Single User Licence: Allows one person, typically the buyer, to have access to the ordered product. The ordered product cannot be distributed to anyone else.
- 2-5 User Licence: Allows the ordered product to be shared among a maximum of 5 people within your organisation.
- Corporate License: Allows the product to be shared among all employees of your organisation regardless of their geographical location.
All our reports are typically be emailed to you as an attachment.
To order any available report you need to register on our website. The payment can be made either through CCAvenue or PayPal payments gateways which accept all international cards.
We extend our support to 6 months post sale. A post sale customization is also provided to cover your unmet needs in the report.
Request Customization
We provide a free 15% customization on every purchase. This requirement can be fulfilled for both pre and post sale. You may send your customization requirements through email at info@strategymrc.com or call us on +1-301-202-5929.
Note: This customization is absolutely free until it falls under the 15% bracket. If your requirement exceeds this a feasibility check will be performed. Post that, a quote will be provided along with the timelines.
WHY CHOOSE US ?

Assured Quality
Best in class reports with high standard of research integrity

24X7 Research Support
Continuous support to ensure the best customer experience.

Free Customization
Adding more values to your product of interest.

Safe & Secure Access
Providing a secured environment for all online transactions.

Trusted by 600+ Brands
Serving the most reputed brands across the world.