
Printed Signage Market
Printed Signage Market Forecasts to 2028 - Global Analysis By Type (Backlit Displays, Banner and Backdrop, Billboards and Other Types), Print Technology (Inkjet, Screen, Sheetfed and Other Print Technologies), Application (Outdoor and Indoor), End User and Geography

|
Years Covered |
2020-2028 |
|
Estimated Year Value (2022) |
US $41.67 MN |
|
Projected Year Value (2028) |
US $47.43 MN |
|
CAGR (2022 - 2028) |
2.18% |
|
Regions Covered |
North America, Europe, Asia Pacific, South America, and Middle East & Africa |
|
Countries Covered |
US, Canada, Mexico, Germany, UK, Italy, France, Spain, Japan, China, India, Australia, New Zealand, South Korea, Rest of Asia Pacific, South America, Argentina, Brazil, Chile, Middle East & Africa, Saudi Arabia, UAE, Qatar, and South Africa |
|
Largest Market |
Europe |
|
Fastest Growing Market |
Asia Pacific |
According to Stratistics MRC, the Global Printed Signage Market is accounted for $41.67 million in 2022 and is expected to reach $47.43 million by 2028 growing at a CAGR of 2.18% during the forecast period. Printed signage is one of the most extensively utilised types of signage solutions around the world. It is mostly used to market and advertise products in order to attract consumers and broaden their knowledge about the availability and features via billboards and backlit displays, among other things. Historically, printed signage has been effective in attracting attention and keeping customers interested. This helps businesses spread knowledge in the brief amount of time before a customer leaves their store.
According to the Malaysia Advertisers Association, out-of-home (OOH) advertising spending in Malaysia has been steadily increasing since 2012 and was expected to account for 19% of overall advertising spending in 2021.
Market Dynamics:
Driver:
Cost-effectiveness
The market's expansion is primarily driven by cost-effectiveness, since it provides affordable and effective signage solutions for a variety of sectors. The main factors assisting the printed signage market to endure in the face of fierce competition from the rising digital signage are the low deployment costs and longer lifespan of these types of signs. The convenience of deployment without the requirement for additional maintenance expenses is the major factor driving most organisations and companies to choose printed signage solutions.
Restraint:
Availability of substitute products
One of the main restraints on the growth of the global market for digitally printed wallpaper is the increased accessibility of replacement products like paint and coating. Many paint and coating producers are making products that are heat-resistant, water-resistant, corrosion-resistant, and environmentally friendly. Additionally, the development of cutting-edge technology and intense competition among paint and coating producers could restrain the global market for printed wallpaper.
Opportunity:
Growing usage of printed signage
The market for printed signage is expanding primarily due to an increase in the use of printed signage over digital signage in shopping centres, retail establishments, and other locations. Market expansion is once again being driven by ease of deployment without the requirement for additional maintenance expenses. Additionally, the market is undergoing a number of merger and acquisition operations, which are anticipated to provide significant growth potential throughout the projected period.
Threat:
Fluctuations in the prices
The expansion pace of the market would be further slowed by fluctuations in raw material prices. Additionally, the expanding use of digital signage and the digitization of economies will impede market growth. The COVID-19 virus will accelerate current trends in online broadcasting and advertising, slowing the rate of market expansion.
Covid-19 Impact
The COVID-19 epidemic has caused economic havoc in small, medium, and large-scale companies around the world. Industry losses and global supply chain and manufacturing operations disruptions are additional effects of the global government's lockdown. As a result of the fluctuating demand from different end-user sectors, the printed signage market has experienced mixed results. Printed signage has seen a considerable reduction in the majority of end-user sectors.
The sheetfed segment is expected to be the largest during the forecast period
The sheetfed segment is estimated to have a lucrative growth, due to the increasing investment by vendors on sheetfed presses. In August 2021, for instance, Yintong Corporation contracted with China Print to buy 56 multicolor RMGT 920 series sheetfed presses, which will be supplied and installed over the following three years. RMGT's Chinese distributor, Beijing Jia He Ding Xin Technology & Business, also known as Dinga, and Yintong, an online supplier of print or a web to print company, signed the agreement for all 56 presses at China Print 2021.
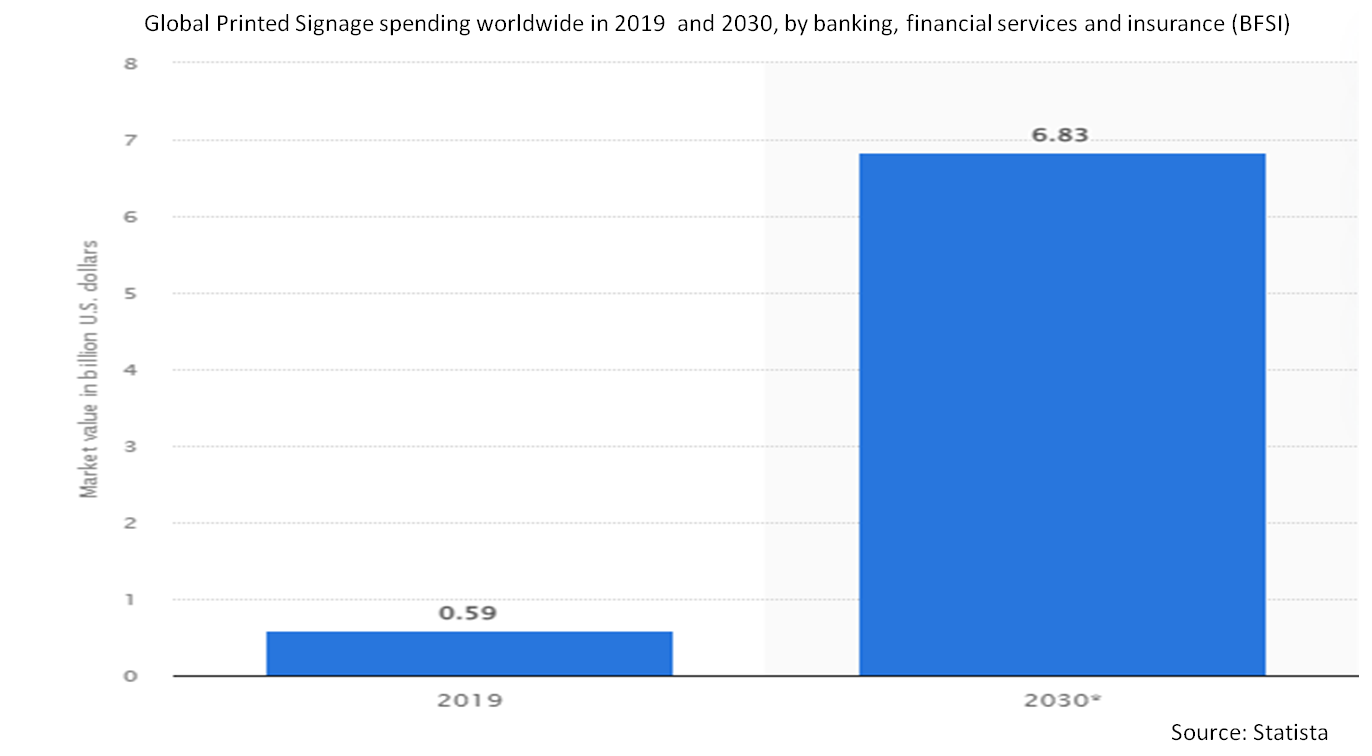
The banking, financial services and insurance (BFSI) segment is expected to have the highest CAGR during the forecast period
The banking, financial services and insurance (BFSI) segment is anticipated to witness the fastest CAGR growth during the forecast period. The banking and financial sector is one of the world's largest advertisers. The majority of businesses employ this technique to facilitate quick client conversion and support digital initiatives. For instance, American Express stands out among the big US financial institutions as having the highest advertising and marketing spend, at over USD 3.5 billion in fiscal 2020. For the sole purpose of acquiring new cards, it spent USD 1 billion in the fourth quarter of last year.
Region with highest share:
Europe is projected to hold the largest market share during the forecast period owing to the increasing importance of dedicated product suppliers and growing demand from the retail industry. According to the Advertising Association (UK) Report, UK advertisement spending would increase by 24.8% the current year to EUR 29.3 billion. This month's data outperforms July's forecast (+18.2 percent) by 6.6% points, giving it the highest yearly increase on record.
Region with highest CAGR:
Asia Pacific is projected to have the highest CAGR over the forecast period, owing to There are several key factors that influence market growth, including the availability of raw materials, an ever-growing population base, the growth and expansion of different end user verticals, the rising introduction of new and innovative products, the growth of functions in retail stores, corporate offices, hospitals, and hotels, and increased personal disposable income.

Key players in the market
Some of the key players profiled in the Printed Signage Market include 3A Composites Holding AG, L&H Sign Company, Inc, Lintec Europe B.V., Avery Dennison Corporation, EhKo Sign Industries Kft., Orafol Europe GmbH, Kelly Signs and Graphics, IGEPA group GmbH & Co. KG, Identity Holdings Ltd., Signs Express Ltd., Spandex Ltd, Southwest Printing, Rgla Solutions
Key Developments:
In April 2022, 3A Composites has signed a contract to become a 25% shareholder of Swedish International AB through a direct capital increase while strengthening its product portfolio in the display business with Sweden's natural fiber board production facility. Headquartered in Katrineholm, Sweden, Swedboard International AB is an innovative company that manufactures and sells eco-friendly boards for the graphics display industry.
In April 2021, ORAFOL Group acquired NUPRO Advanced TPU Films in South Deerfield, Massachusetts, United States. The partnership will allow ORAFOL and NUPRO to further grow their core businesses by expanding production operations and capabilities.
Types Covered:
• Backlit Displays
• Banner and Backdrop
• Billboards
• Corporate Graphics, Exhibitions, and Trade Shows
• Pop Display
• Other Types
Print Technologies Covered:
• Inkjet
• Screen
• Sheetfed
• Other Print Technologies
Applications Covered:
• Outdoor
• Indoor
End Users Covered:
• Introduction
• Banking, Financial Services and Insurance (BFSI)
• Healthcare
• Retail
• Transportation and Logistics
• Other End-user
Regions Covered:
• North America
o US
o Canada
o Mexico
• Europe
o Germany
o UK
o Italy
o France
o Spain
o Rest of Europe
• Asia Pacific
o Japan
o China
o India
o Australia
o New Zealand
o South Korea
o Rest of Asia Pacific
• South America
o Argentina
o Brazil
o Chile
o Rest of South America
• Middle East & Africa
o Saudi Arabia
o UAE
o Qatar
o South Africa
o Rest of Middle East & Africa
What our report offers:
- Market share assessments for the regional and country-level segments
- Strategic recommendations for the new entrants
- Covers Market data for the years 2020, 2021, 2022, 2025, and 2028
- Market Trends (Drivers, Constraints, Opportunities, Threats, Challenges, Investment Opportunities, and recommendations)
- Strategic recommendations in key business segments based on the market estimations
- Competitive landscaping mapping the key common trends
- Company profiling with detailed strategies, financials, and recent developments
- Supply chain trends mapping the latest technological advancements
Free Customization Offerings:
All the customers of this report will be entitled to receive one of the following free customization options:
• Company Profiling
o Comprehensive profiling of additional market players (up to 3)
o SWOT Analysis of key players (up to 3)
• Regional Segmentation
o Market estimations, Forecasts and CAGR of any prominent country as per the client's interest (Note: Depends on feasibility check)
• Competitive Benchmarking
o Benchmarking of key players based on product portfolio, geographical presence, and strategic alliances
Table of Contents
1 Executive Summary
2 Preface
2.1 Abstract
2.2 Stake Holders
2.3 Research Scope
2.4 Research Methodology
2.4.1 Data Mining
2.4.2 Data Analysis
2.4.3 Data Validation
2.4.4 Research Approach
2.5 Research Sources
2.5.1 Primary Research Sources
2.5.2 Secondary Research Sources
2.5.3 Assumptions
3 Market Trend Analysis
3.1 Introduction
3.2 Drivers
3.3 Restraints
3.4 Opportunities
3.5 Threats
3.6 Application Analysis
3.7 End User Analysis
3.8 Emerging Markets
3.9 Impact of Covid-19
4 Porters Five Force Analysis
4.1 Bargaining power of suppliers
4.2 Bargaining power of buyers
4.3 Threat of substitutes
4.4 Threat of new entrants
4.5 Competitive rivalry
5 Global Printed Signage Market, By Type
5.1 Introduction
5.2 Backlit Displays
5.3 Banner and Backdrop
5.4 Billboards
5.5 Corporate Graphics, Exhibitions, and Trade Shows
5.6 Pop Display
5.7 Other Types
6 Global Printed Signage Market, By Print Technology
6.1 Introduction
6.2 Inkjet
6.3 Screen
6.4 Sheetfed
6.5 Other Print Technologies
7 Global Printed Signage Market, By Application
7.1 Introduction
7.2 Outdoor
7.3 Indoor
8 Global Printed Signage Market, By End User
8.1 Introduction
8.2 Banking, Financial Services and Insurance (BFSI)
8.3 Healthcare
8.4 Retail
8.5 Transportation and Logistics
8.6 Other End-Users
9 Global Printed Signage Market, By Geography
9.1 Introduction
9.2 North America
9.2.1 US
9.2.2 Canada
9.2.3 Mexico
9.3 Europe
9.3.1 Germany
9.3.2 UK
9.3.3 Italy
9.3.4 France
9.3.5 Spain
9.3.6 Rest of Europe
9.4 Asia Pacific
9.4.1 Japan
9.4.2 China
9.4.3 India
9.4.4 Australia
9.4.5 New Zealand
9.4.6 South Korea
9.4.7 Rest of Asia Pacific
9.5 South America
9.5.1 Argentina
9.5.2 Brazil
9.5.3 Chile
9.5.4 Rest of South America
9.6 Middle East & Africa
9.6.1 Saudi Arabia
9.6.2 UAE
9.6.3 Qatar
9.6.4 South Africa
9.6.5 Rest of Middle East & Africa
10 Key Developments
10.1 Agreements, Partnerships, Collaborations and Joint Ventures
10.2 Acquisitions & Mergers
10.3 New Product Launch
10.4 Expansions
10.5 Other Key Strategies
11 Company Profiling
11.1 3A Composites Holding AG
11.2 L&H Sign Company, Inc
11.3 Lintec Europe B.V.
11.4 Avery Dennison Corporation
11.5 EhKo Sign Industries Kft.
11.6 Orafol Europe GmbH
11.7 Kelly Signs and Graphics
11.8 IGEPA group GmbH & Co. KG
11.9 Identity Holdings Ltd.
11.10 Signs Express Ltd.
11.11 Spandex Ltd
11.12 Southwest Printing
11.13 Rgla Solutions
List of Tables
1 Global Printed Signage Market Outlook, By Region (2020-2028) ($MN)
2 Global Printed Signage Market Outlook, By Type (2020-2028) ($MN)
3 Global Printed Signage Market Outlook, By Backlit Displays (2020-2028) ($MN)
4 Global Printed Signage Market Outlook, By Banner and Backdrop (2020-2028) ($MN)
5 Global Printed Signage Market Outlook, By Billboards (2020-2028) ($MN)
6 Global Printed Signage Market Outlook, By Corporate Graphics, Exhibitions, and Trade Shows (2020-2028) ($MN)
7 Global Printed Signage Market Outlook, By Pop Display (2020-2028) ($MN)
8 Global Printed Signage Market Outlook, By Other Types (2020-2028) ($MN)
9 Global Printed Signage Market Outlook, By Print Technology (2020-2028) ($MN)
10 Global Printed Signage Market Outlook, By Inkjet (2020-2028) ($MN)
11 Global Printed Signage Market Outlook, By Screen (2020-2028) ($MN)
12 Global Printed Signage Market Outlook, By Sheetfed (2020-2028) ($MN)
13 Global Printed Signage Market Outlook, By Other Print Technologies (2020-2028) ($MN)
14 Global Printed Signage Market Outlook, By Application (2020-2028) ($MN)
15 Global Printed Signage Market Outlook, By Outdoor (2020-2028) ($MN)
16 Global Printed Signage Market Outlook, By Indoor (2020-2028) ($MN)
17 Global Printed Signage Market Outlook, By End User (2020-2028) ($MN)
18 Global Printed Signage Market Outlook, By Banking, Financial Services and Insurance (BFSI) (2020-2028) ($MN)
19 Global Printed Signage Market Outlook, By Healthcare (2020-2028) ($MN)
20 Global Printed Signage Market Outlook, By Retail (2020-2028) ($MN)
21 Global Printed Signage Market Outlook, By Transportation and Logistics (2020-2028) ($MN)
22 Global Printed Signage Market Outlook, By Other End-Users (2020-2028) ($MN)
23 North America Printed Signage Market Outlook, By Country (2020-2028) ($MN)
24 North America Printed Signage Market Outlook, By Type (2020-2028) ($MN)
25 North America Printed Signage Market Outlook, By Backlit Displays (2020-2028) ($MN)
26 North America Printed Signage Market Outlook, By Banner and Backdrop (2020-2028) ($MN)
27 North America Printed Signage Market Outlook, By Billboards (2020-2028) ($MN)
28 North America Printed Signage Market Outlook, By Corporate Graphics, Exhibitions, and Trade Shows (2020-2028) ($MN)
29 North America Printed Signage Market Outlook, By Pop Display (2020-2028) ($MN)
30 North America Printed Signage Market Outlook, By Other Types (2020-2028) ($MN)
31 North America Printed Signage Market Outlook, By Print Technology (2020-2028) ($MN)
32 North America Printed Signage Market Outlook, By Inkjet (2020-2028) ($MN)
33 North America Printed Signage Market Outlook, By Screen (2020-2028) ($MN)
34 North America Printed Signage Market Outlook, By Sheetfed (2020-2028) ($MN)
35 North America Printed Signage Market Outlook, By Other Print Technologies (2020-2028) ($MN)
36 North America Printed Signage Market Outlook, By Application (2020-2028) ($MN)
37 North America Printed Signage Market Outlook, By Outdoor (2020-2028) ($MN)
38 North America Printed Signage Market Outlook, By Indoor (2020-2028) ($MN)
39 North America Printed Signage Market Outlook, By End User (2020-2028) ($MN)
40 North America Printed Signage Market Outlook, By Banking, Financial Services and Insurance (BFSI) (2020-2028) ($MN)
41 North America Printed Signage Market Outlook, By Healthcare (2020-2028) ($MN)
42 North America Printed Signage Market Outlook, By Retail (2020-2028) ($MN)
43 North America Printed Signage Market Outlook, By Transportation and Logistics (2020-2028) ($MN)
44 North America Printed Signage Market Outlook, By Other End-Users (2020-2028) ($MN)
45 Europe Printed Signage Market Outlook, By Country (2020-2028) ($MN)
46 Europe Printed Signage Market Outlook, By Type (2020-2028) ($MN)
47 Europe Printed Signage Market Outlook, By Backlit Displays (2020-2028) ($MN)
48 Europe Printed Signage Market Outlook, By Banner and Backdrop (2020-2028) ($MN)
49 Europe Printed Signage Market Outlook, By Billboards (2020-2028) ($MN)
50 Europe Printed Signage Market Outlook, By Corporate Graphics, Exhibitions, and Trade Shows (2020-2028) ($MN)
51 Europe Printed Signage Market Outlook, By Pop Display (2020-2028) ($MN)
52 Europe Printed Signage Market Outlook, By Other Types (2020-2028) ($MN)
53 Europe Printed Signage Market Outlook, By Print Technology (2020-2028) ($MN)
54 Europe Printed Signage Market Outlook, By Inkjet (2020-2028) ($MN)
55 Europe Printed Signage Market Outlook, By Screen (2020-2028) ($MN)
56 Europe Printed Signage Market Outlook, By Sheetfed (2020-2028) ($MN)
57 Europe Printed Signage Market Outlook, By Other Print Technologies (2020-2028) ($MN)
58 Europe Printed Signage Market Outlook, By Application (2020-2028) ($MN)
59 Europe Printed Signage Market Outlook, By Outdoor (2020-2028) ($MN)
60 Europe Printed Signage Market Outlook, By Indoor (2020-2028) ($MN)
61 Europe Printed Signage Market Outlook, By End User (2020-2028) ($MN)
62 Europe Printed Signage Market Outlook, By Banking, Financial Services and Insurance (BFSI) (2020-2028) ($MN)
63 Europe Printed Signage Market Outlook, By Healthcare (2020-2028) ($MN)
64 Europe Printed Signage Market Outlook, By Retail (2020-2028) ($MN)
65 Europe Printed Signage Market Outlook, By Transportation and Logistics (2020-2028) ($MN)
66 Europe Printed Signage Market Outlook, By Other End-Users (2020-2028) ($MN)
67 Asia Pacific Printed Signage Market Outlook, By Country (2020-2028) ($MN)
68 Asia Pacific Printed Signage Market Outlook, By Type (2020-2028) ($MN)
69 Asia Pacific Printed Signage Market Outlook, By Backlit Displays (2020-2028) ($MN)
70 Asia Pacific Printed Signage Market Outlook, By Banner and Backdrop (2020-2028) ($MN)
71 Asia Pacific Printed Signage Market Outlook, By Billboards (2020-2028) ($MN)
72 Asia Pacific Printed Signage Market Outlook, By Corporate Graphics, Exhibitions, and Trade Shows (2020-2028) ($MN)
73 Asia Pacific Printed Signage Market Outlook, By Pop Display (2020-2028) ($MN)
74 Asia Pacific Printed Signage Market Outlook, By Other Types (2020-2028) ($MN)
75 Asia Pacific Printed Signage Market Outlook, By Print Technology (2020-2028) ($MN)
76 Asia Pacific Printed Signage Market Outlook, By Inkjet (2020-2028) ($MN)
77 Asia Pacific Printed Signage Market Outlook, By Screen (2020-2028) ($MN)
78 Asia Pacific Printed Signage Market Outlook, By Sheetfed (2020-2028) ($MN)
79 Asia Pacific Printed Signage Market Outlook, By Other Print Technologies (2020-2028) ($MN)
80 Asia Pacific Printed Signage Market Outlook, By Application (2020-2028) ($MN)
81 Asia Pacific Printed Signage Market Outlook, By Outdoor (2020-2028) ($MN)
82 Asia Pacific Printed Signage Market Outlook, By Indoor (2020-2028) ($MN)
83 Asia Pacific Printed Signage Market Outlook, By End User (2020-2028) ($MN)
84 Asia Pacific Printed Signage Market Outlook, By Banking, Financial Services and Insurance (BFSI) (2020-2028) ($MN)
85 Asia Pacific Printed Signage Market Outlook, By Healthcare (2020-2028) ($MN)
86 Asia Pacific Printed Signage Market Outlook, By Retail (2020-2028) ($MN)
87 Asia Pacific Printed Signage Market Outlook, By Transportation and Logistics (2020-2028) ($MN)
88 Asia Pacific Printed Signage Market Outlook, By Other End-Users (2020-2028) ($MN)
89 South America Printed Signage Market Outlook, By Country (2020-2028) ($MN)
90 South America Printed Signage Market Outlook, By Type (2020-2028) ($MN)
91 South America Printed Signage Market Outlook, By Backlit Displays (2020-2028) ($MN)
92 South America Printed Signage Market Outlook, By Banner and Backdrop (2020-2028) ($MN)
93 South America Printed Signage Market Outlook, By Billboards (2020-2028) ($MN)
94 South America Printed Signage Market Outlook, By Corporate Graphics, Exhibitions, and Trade Shows (2020-2028) ($MN)
95 South America Printed Signage Market Outlook, By Pop Display (2020-2028) ($MN)
96 South America Printed Signage Market Outlook, By Other Types (2020-2028) ($MN)
97 South America Printed Signage Market Outlook, By Print Technology (2020-2028) ($MN)
98 South America Printed Signage Market Outlook, By Inkjet (2020-2028) ($MN)
99 South America Printed Signage Market Outlook, By Screen (2020-2028) ($MN)
100 South America Printed Signage Market Outlook, By Sheetfed (2020-2028) ($MN)
101 South America Printed Signage Market Outlook, By Other Print Technologies (2020-2028) ($MN)
102 South America Printed Signage Market Outlook, By Application (2020-2028) ($MN)
103 South America Printed Signage Market Outlook, By Outdoor (2020-2028) ($MN)
104 South America Printed Signage Market Outlook, By Indoor (2020-2028) ($MN)
105 South America Printed Signage Market Outlook, By End User (2020-2028) ($MN)
106 South America Printed Signage Market Outlook, By Banking, Financial Services and Insurance (BFSI) (2020-2028) ($MN)
107 South America Printed Signage Market Outlook, By Healthcare (2020-2028) ($MN)
108 South America Printed Signage Market Outlook, By Retail (2020-2028) ($MN)
109 South America Printed Signage Market Outlook, By Transportation and Logistics (2020-2028) ($MN)
110 South America Printed Signage Market Outlook, By Other End-Users (2020-2028) ($MN)
111 Middle East & Africa Printed Signage Market Outlook, By Country (2020-2028) ($MN)
112 Middle East & Africa Printed Signage Market Outlook, By Type (2020-2028) ($MN)
113 Middle East & Africa Printed Signage Market Outlook, By Backlit Displays (2020-2028) ($MN)
114 Middle East & Africa Printed Signage Market Outlook, By Banner and Backdrop (2020-2028) ($MN)
115 Middle East & Africa Printed Signage Market Outlook, By Billboards (2020-2028) ($MN)
116 Middle East & Africa Printed Signage Market Outlook, By Corporate Graphics, Exhibitions, and Trade Shows (2020-2028) ($MN)
117 Middle East & Africa Printed Signage Market Outlook, By Pop Display (2020-2028) ($MN)
118 Middle East & Africa Printed Signage Market Outlook, By Other Types (2020-2028) ($MN)
119 Middle East & Africa Printed Signage Market Outlook, By Print Technology (2020-2028) ($MN)
120 Middle East & Africa Printed Signage Market Outlook, By Inkjet (2020-2028) ($MN)
121 Middle East & Africa Printed Signage Market Outlook, By Screen (2020-2028) ($MN)
122 Middle East & Africa Printed Signage Market Outlook, By Sheetfed (2020-2028) ($MN)
123 Middle East & Africa Printed Signage Market Outlook, By Other Print Technologies (2020-2028) ($MN)
124 Middle East & Africa Printed Signage Market Outlook, By Application (2020-2028) ($MN)
125 Middle East & Africa Printed Signage Market Outlook, By Outdoor (2020-2028) ($MN)
126 Middle East & Africa Printed Signage Market Outlook, By Indoor (2020-2028) ($MN)
127 Middle East & Africa Printed Signage Market Outlook, By End User (2020-2028) ($MN)
128 Middle East & Africa Printed Signage Market Outlook, By Banking, Financial Services and Insurance (BFSI) (2020-2028) ($MN)
129 Middle East & Africa Printed Signage Market Outlook, By Healthcare (2020-2028) ($MN)
130 Middle East & Africa Printed Signage Market Outlook, By Retail (2020-2028) ($MN)
131 Middle East & Africa Printed Signage Market Outlook, By Transportation and Logistics (2020-2028) ($MN)
132 Middle East & Africa Printed Signage Market Outlook, By Other End-Users (2020-2028) ($MN)
List of Figures
RESEARCH METHODOLOGY

We at ‘Stratistics’ opt for an extensive research approach which involves data mining, data validation, and data analysis. The various research sources include in-house repository, secondary research, competitor’s sources, social media research, client internal data, and primary research.
Our team of analysts prefers the most reliable and authenticated data sources in order to perform the comprehensive literature search. With access to most of the authenticated data bases our team highly considers the best mix of information through various sources to obtain extensive and accurate analysis.
Each report takes an average time of a month and a team of 4 industry analysts. The time may vary depending on the scope and data availability of the desired market report. The various parameters used in the market assessment are standardized in order to enhance the data accuracy.
Data Mining
The data is collected from several authenticated, reliable, paid and unpaid sources and is filtered depending on the scope & objective of the research. Our reports repository acts as an added advantage in this procedure. Data gathering from the raw material suppliers, distributors and the manufacturers is performed on a regular basis, this helps in the comprehensive understanding of the products value chain. Apart from the above mentioned sources the data is also collected from the industry consultants to ensure the objective of the study is in the right direction.
Market trends such as technological advancements, regulatory affairs, market dynamics (Drivers, Restraints, Opportunities and Challenges) are obtained from scientific journals, market related national & international associations and organizations.
Data Analysis
From the data that is collected depending on the scope & objective of the research the data is subjected for the analysis. The critical steps that we follow for the data analysis include:
- Product Lifecycle Analysis
- Competitor analysis
- Risk analysis
- Porters Analysis
- PESTEL Analysis
- SWOT Analysis
The data engineering is performed by the core industry experts considering both the Marketing Mix Modeling and the Demand Forecasting. The marketing mix modeling makes use of multiple-regression techniques to predict the optimal mix of marketing variables. Regression factor is based on a number of variables and how they relate to an outcome such as sales or profits.
Data Validation
The data validation is performed by the exhaustive primary research from the expert interviews. This includes telephonic interviews, focus groups, face to face interviews, and questionnaires to validate our research from all aspects. The industry experts we approach come from the leading firms, involved in the supply chain ranging from the suppliers, distributors to the manufacturers and consumers so as to ensure an unbiased analysis.
We are in touch with more than 15,000 industry experts with the right mix of consultants, CEO's, presidents, vice presidents, managers, experts from both supply side and demand side, executives and so on.
The data validation involves the primary research from the industry experts belonging to:
- Leading Companies
- Suppliers & Distributors
- Manufacturers
- Consumers
- Industry/Strategic Consultants
Apart from the data validation the primary research also helps in performing the fill gap research, i.e. providing solutions for the unmet needs of the research which helps in enhancing the reports quality.
For more details about research methodology, kindly write to us at info@strategymrc.com
Frequently Asked Questions
In case of any queries regarding this report, you can contact the customer service by filing the “Inquiry Before Buy” form available on the right hand side. You may also contact us through email: info@strategymrc.com or phone: +1-301-202-5929
Yes, the samples are available for all the published reports. You can request them by filling the “Request Sample” option available in this page.
Yes, you can request a sample with your specific requirements. All the customized samples will be provided as per the requirement with the real data masked.
All our reports are available in Digital PDF format. In case if you require them in any other formats, such as PPT, Excel etc you can submit a request through “Inquiry Before Buy” form available on the right hand side. You may also contact us through email: info@strategymrc.com or phone: +1-301-202-5929
We offer a free 15% customization with every purchase. This requirement can be fulfilled for both pre and post sale. You may send your customization requirements through email at info@strategymrc.com or call us on +1-301-202-5929.
We have 3 different licensing options available in electronic format.
- Single User Licence: Allows one person, typically the buyer, to have access to the ordered product. The ordered product cannot be distributed to anyone else.
- 2-5 User Licence: Allows the ordered product to be shared among a maximum of 5 people within your organisation.
- Corporate License: Allows the product to be shared among all employees of your organisation regardless of their geographical location.
All our reports are typically be emailed to you as an attachment.
To order any available report you need to register on our website. The payment can be made either through CCAvenue or PayPal payments gateways which accept all international cards.
We extend our support to 6 months post sale. A post sale customization is also provided to cover your unmet needs in the report.
Request Customization
We offer complimentary customization of up to 15% with every purchase. To share your customization requirements, feel free to email us at info@strategymrc.com or call us on +1-301-202-5929. .
Please Note: Customization within the 15% threshold is entirely free of charge. If your request exceeds this limit, we will conduct a feasibility assessment. Following that, a detailed quote and timeline will be provided.
WHY CHOOSE US ?

Assured Quality
Best in class reports with high standard of research integrity

24X7 Research Support
Continuous support to ensure the best customer experience.

Free Customization
Adding more values to your product of interest.

Safe & Secure Access
Providing a secured environment for all online transactions.

Trusted by 600+ Brands
Serving the most reputed brands across the world.