
Produced Water Treatment Market
Produced Water Treatment Market Forecasts to 2030 - Global Analysis By Treatment Type (Reverse Osmosis/Membrane Treatment, Chemical Treatment, Physical Treatment, Biological Treatment and Other Treatment Types), Location, Application and By Geography

|
Years Covered |
2021-2030 |
|
Estimated Year Value (2023) |
US $8.1 BN |
|
Projected Year Value (2030) |
US $15.5 BN |
|
CAGR (2023 - 2030) |
9.8% |
|
Regions Covered |
North America, Europe, Asia Pacific, South America, and Middle East & Africa |
|
Countries Covered |
US, Canada, Mexico, Germany, UK, Italy, France, Spain, Japan, China, India, Australia, New Zealand, South Korea, Rest of Asia Pacific, South America, Argentina, Brazil, Chile, Middle East & Africa, Saudi Arabia, UAE, Qatar, and South Africa |
|
Largest Market |
Asia Pacific |
|
Highest Growing Market |
North America |
According to Stratistics MRC, the Global Produced Water Treatment Market is accounted for $8.1 billion in 2023 and is expected to reach $15.5 billion by 2030 growing at a CAGR of 9.8% during the forecast period. Produced water treatment involves removing contaminants from water extracted during oil and gas production. It employs various methods such as chemical treatment, filtration, and separation techniques like gravity settling, flotation, and membrane processes. Initial separation separates oil from water, followed by further treatment to reduce pollutants like suspended solids, dissolved metals, and hydrocarbons to acceptable levels for discharge or reuse. The treated water can then be discharged safely into the environment or reused within the production process, minimizing environmental impact and conserving water resources.
According to the United Nations, by 2030, approximately 700 million people could be affected by the intense water scarcity. Hence, the installation of produced water treatment solutions at the onshore as well as offshore locations is likely to rise over the forecast period.
Market Dynamics:
Driver:
Growing demand for oil and gas
The increased demand for treatment solutions may drive innovation and technological advancements in the produced water treatment sector. Companies may invest more in research and development to create more efficient, cost-effective, and environmentally friendly treatment technologies to meet the evolving needs of the industry. Companies may invest more in research and development to create more efficient, cost-effective, and environmentally friendly treatment technologies to meet the evolving needs of the industry.
Restraint:
Stringent regulations regarding the discharge or reuse of treated water
Stringent regulations often require the implementation of more advanced treatment technologies and processes to meet strict discharge or reuse standards. This can significantly increase the costs associated with produced water treatment for oil and gas companies. Higher compliance costs may deter some companies from investing in new projects or expanding existing operations. This uncertainty can lead to a slowdown in market growth as companies adopt a wait-and-see approach.
Opportunity:
Growing water scarcity in many parts of the world
As freshwater sources become scarce, there is a growing need to recycle and reuse water, including produced water from oil and gas operations. This can lead to an increased demand for produced water treatment technologies that can effectively treat produced water to meet the required quality standards for reuse in various industrial or agricultural applications. Companies operating in regions facing water scarcity may invest more in advanced treatment technologies to treat produced water for reuse, creating opportunities for growth and innovation in the market.
Threat:
Substantial initial investment
Oil and gas operators may be reluctant to invest in produced water treatment technologies due to the substantial upfront costs involved. Instead, they may opt for cheaper disposal methods such as underground injection or discharge, even if they are less environmentally friendly. This can slow down the adoption of produced water treatment solutions and hinder market growth.
Covid-19 Impact
The demand for oil keeps staying low all through the continuing COVID-19 pandemic. This is inflicting ripple consequences for commercial enterprise activities with inside the produced water treatment marketplace. During the time of lockdown in major parts of the world, the manufacturing units went down as the workers were not available for the work due to the fear of getting infected which led to the shortage of the inventories. Global vaccination and implementation of guidelines help the market to stand back on its legs as oil and gas market is also picking it pace back which will help produced water treatment market to grow significantly.
The reverse osmosis/membrane treatment segment is expected to be the largest during the forecast period
The reverse osmosis/membrane treatment segment is estimated to have a lucrative growth, due to reverse osmosis membranes effectively remove contaminants, including oil, salts, and chemicals, producing high-quality treated water suitable for reuse or environmentally responsible disposal. This advanced technology has spurred market growth by addressing regulatory compliance, mitigating environmental impact, and promoting water reuse, particularly in water-stressed regions like the Asia Pacific.
The industrial processes segment is expected to have the highest CAGR during the forecast period
The industrial processes segment is anticipated to witness the highest CAGR growth during the forecast period, owing to the demand for effective treatment solutions escalates as industries, including oil and gas, mining, and manufacturing, seek to comply with stringent environmental regulations and address sustainability concerns. This drives innovation and adoption of advanced treatment technologies like filtration, separation, and chemical processes. Moreover, as industries recognize the value of water reuse and conservation, the market for produced water treatment experiences further growth.
Region with largest share:
Asia Pacific is projected to hold the largest market share during the forecast period owing to the significant producer of oil and gas, with countries like China, India, Malaysia, Indonesia, and Australia having substantial reserves and active extraction activities. The increase in oil and gas production leads to a higher volume of produced water that needs treatment. Further water scarcity is a pressing issue in many parts of Asia Pacific. Treating produced water for reuse in industrial processes or for other purposes can help alleviate water scarcity concerns, driving the adoption of produced water treatment solutions.
Region with highest CAGR:
North America is projected to have the highest CAGR over the forecast period, owing to strong presence of crude oil reserves in the U.S. and Canada is expected to increase the usage of water management services. Primarily, the region's booming oil and gas industry, particularly in the U.S. and Canada, generates substantial volumes of produced water as a byproduct of extraction processes. This abundance of produced water necessitates efficient treatment solutions to meet stringent environmental regulations and ensure compliance. Moreover, increasing concerns over water scarcity and contamination further emphasize the importance of treating produced water before disposal or reuse.

Key players in the market
Some of the key players in the Produced Water Treatment Market include Alderley plc, Baker Hughes, Cannon Artes S.p.A., CETCO, Ecolab, Ecosphere Technologies, Inc, EMIT Group, Enviro-Tech Systems, Filtra Systems, Frames, Halliburton Company,Mineral Technologies, Inc., Ovivo, Pentair, ProSep, Schlumberger Limited, TechipFMC plc, Veolia Environnement S.A. and Weatherford International
Key Developments:
In April 2024, Baker Hughes to Supply Electric-driven Liquefaction Technology for Cedar LNG Project, the Cedar LNG project brings together the Haisla Nation and Pembina Pipeline Corporation (Pembina) to develop the Haisla Nation-led project.
In March 2024, Data from a global study commissioned by Ecolab, a global sustainability leader offering water solutions and services, and conducted in partnership with Morning Consult, has revealed that the level and immediacy of clean and safe water concerns varies across generations.
In November 2023, Baker Hughes Launches New Reinforced Thermoplastic Pipe Technology. The PythonPipe portfolio consists of American Petroleum Institute 15s qualified, flexible and non-metallic RTP with an extensive selection of sizes, materials and liner options.
Treatment Types Covered:
• Reverse Osmosis/Membrane Treatment
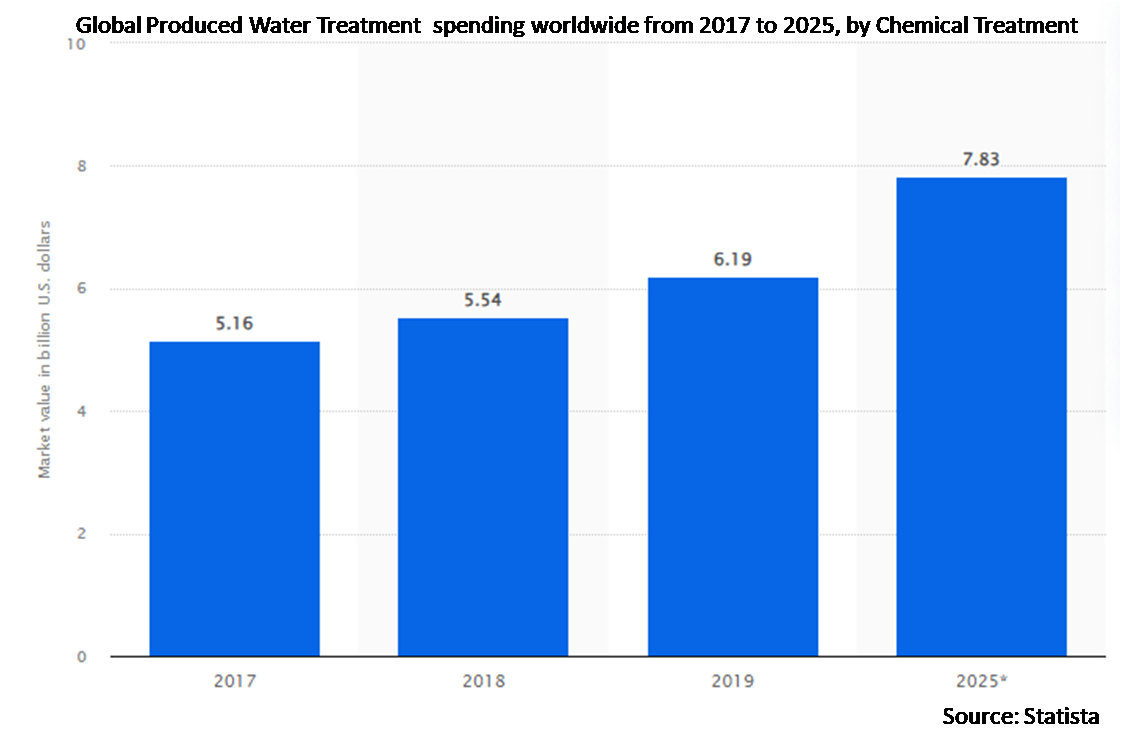
• Chemical Treatment
• Physical Treatment
• Biological Treatment
• Other Treatment Types
Locations Covered:
• Onshore
• Offshore
Applications Covered:
• Oil & Gas Industry
• Power Generation Industry
• Agriculture & Irrigation
• Industrial Processes
• Environmental Remediation
• Other Applications
Regions Covered:
• North America
o US
o Canada
o Mexico
• Europe
o Germany
o UK
o Italy
o France
o Spain
o Rest of Europe
• Asia Pacific
o Japan
o China
o India
o Australia
o New Zealand
o South Korea
o Rest of Asia Pacific
• South America
o Argentina
o Brazil
o Chile
o Rest of South America
• Middle East & Africa
o Saudi Arabia
o UAE
o Qatar
o South Africa
o Rest of Middle East & Africa
What our report offers:
- Market share assessments for the regional and country-level segments
- Strategic recommendations for the new entrants
- Covers Market data for the years 2021, 2022, 2023, 2026, and 2030
- Market Trends (Drivers, Constraints, Opportunities, Threats, Challenges, Investment Opportunities, and recommendations)
- Strategic recommendations in key business segments based on the market estimations
- Competitive landscaping mapping the key common trends
- Company profiling with detailed strategies, financials, and recent developments
- Supply chain trends mapping the latest technological advancements
Free Customization Offerings:
All the customers of this report will be entitled to receive one of the following free customization options:
• Company Profiling
o Comprehensive profiling of additional market players (up to 3)
o SWOT Analysis of key players (up to 3)
• Regional Segmentation
o Market estimations, Forecasts and CAGR of any prominent country as per the client's interest (Note: Depends on feasibility check)
• Competitive Benchmarking
o Benchmarking of key players based on product portfolio, geographical presence, and strategic alliances
Table of Contents
1 Executive Summary
2 Preface
2.1 Abstract
2.2 Stake Holders
2.3 Research Scope
2.4 Research Methodology
2.4.1 Data Mining
2.4.2 Data Analysis
2.4.3 Data Validation
2.4.4 Research Approach
2.5 Research Sources
2.5.1 Primary Research Sources
2.5.2 Secondary Research Sources
2.5.3 Assumptions
3 Market Trend Analysis
3.1 Introduction
3.2 Drivers
3.3 Restraints
3.4 Opportunities
3.5 Threats
3.6 Application Analysis
3.7 Emerging Markets
3.8 Impact of Covid-19
4 Porters Five Force Analysis
4.1 Bargaining power of suppliers
4.2 Bargaining power of buyers
4.3 Threat of substitutes
4.4 Threat of new entrants
4.5 Competitive rivalry
5 Global Produced Water Treatment Market, By Treatment Type
5.1 Introduction
5.2 Reverse Osmosis/Membrane Treatment
5.3 Chemical Treatment
5.4 Physical Treatment
5.5 Biological Treatment
5.6 Other Treatment Types
6 Global Produced Water Treatment Market, By Location
6.1 Introduction
6.2 Onshore
6.3 Offshore
7 Global Produced Water Treatment Market, By Application
7.1 Introduction
7.2 Oil & Gas Industry
7.3 Power Generation Industry
7.4 Agriculture & Irrigation
7.5 Industrial Processes
7.6 Environmental Remediation
7.7 Other Applications
8 Global Produced Water Treatment Market, By Geography
8.1 Introduction
8.2 North America
8.2.1 US
8.2.2 Canada
8.2.3 Mexico
8.3 Europe
8.3.1 Germany
8.3.2 UK
8.3.3 Italy
8.3.4 France
8.3.5 Spain
8.3.6 Rest of Europe
8.4 Asia Pacific
8.4.1 Japan
8.4.2 China
8.4.3 India
8.4.4 Australia
8.4.5 New Zealand
8.4.6 South Korea
8.4.7 Rest of Asia Pacific
8.5 South America
8.5.1 Argentina
8.5.2 Brazil
8.5.3 Chile
8.5.4 Rest of South America
8.6 Middle East & Africa
8.6.1 Saudi Arabia
8.6.2 UAE
8.6.3 Qatar
8.6.4 South Africa
8.6.5 Rest of Middle East & Africa
9 Key Developments
9.1 Agreements, Partnerships, Collaborations and Joint Ventures
9.2 Acquisitions & Mergers
9.3 New Product Launch
9.4 Expansions
9.5 Other Key Strategies
10 Company Profiling
10.1 Alderley plc
10.2 Baker Hughes
10.3 Cannon Artes S.p.A.
10.4 CETCO
10.5 Ecolab
10.6 Ecosphere Technologies, Inc
10.7 EMIT Group
10.8 Enviro-Tech Systems
10.9 Filtra Systems
10.10 Frames
10.11 Halliburton Company
10.12 Mineral Technologies, Inc.
10.13 Ovivo
10.14 Pentair
10.15 ProSep
10.16 Schlumberger Limited
10.17 TechipFMC plc
10.18 Veolia Environnement S.A.
10.19 Weatherford International
List of Tables
1 Global Produced Water Treatment Market Outlook, By Region (2021-2030) ($MN)
2 Global Produced Water Treatment Market Outlook, By Treatment Type (2021-2030) ($MN)
3 Global Produced Water Treatment Market Outlook, By Reverse Osmosis/Membrane Treatment (2021-2030) ($MN)
4 Global Produced Water Treatment Market Outlook, By Chemical Treatment (2021-2030) ($MN)
5 Global Produced Water Treatment Market Outlook, By Physical Treatment (2021-2030) ($MN)
6 Global Produced Water Treatment Market Outlook, By Biological Treatment (2021-2030) ($MN)
7 Global Produced Water Treatment Market Outlook, By Other Treatment Types (2021-2030) ($MN)
8 Global Produced Water Treatment Market Outlook, By Location (2021-2030) ($MN)
9 Global Produced Water Treatment Market Outlook, By Onshore (2021-2030) ($MN)
10 Global Produced Water Treatment Market Outlook, By Offshore (2021-2030) ($MN)
11 Global Produced Water Treatment Market Outlook, By Application (2021-2030) ($MN)
12 Global Produced Water Treatment Market Outlook, By Oil & Gas Industry (2021-2030) ($MN)
13 Global Produced Water Treatment Market Outlook, By Power Generation Industry (2021-2030) ($MN)
14 Global Produced Water Treatment Market Outlook, By Agriculture & Irrigation (2021-2030) ($MN)
15 Global Produced Water Treatment Market Outlook, By Industrial Processes (2021-2030) ($MN)
16 Global Produced Water Treatment Market Outlook, By Environmental Remediation (2021-2030) ($MN)
17 Global Produced Water Treatment Market Outlook, By Other Applications (2021-2030) ($MN)
18 North America Produced Water Treatment Market Outlook, By Country (2021-2030) ($MN)
19 North America Produced Water Treatment Market Outlook, By Treatment Type (2021-2030) ($MN)
20 North America Produced Water Treatment Market Outlook, By Reverse Osmosis/Membrane Treatment (2021-2030) ($MN)
21 North America Produced Water Treatment Market Outlook, By Chemical Treatment (2021-2030) ($MN)
22 North America Produced Water Treatment Market Outlook, By Physical Treatment (2021-2030) ($MN)
23 North America Produced Water Treatment Market Outlook, By Biological Treatment (2021-2030) ($MN)
24 North America Produced Water Treatment Market Outlook, By Other Treatment Types (2021-2030) ($MN)
25 North America Produced Water Treatment Market Outlook, By Location (2021-2030) ($MN)
26 North America Produced Water Treatment Market Outlook, By Onshore (2021-2030) ($MN)
27 North America Produced Water Treatment Market Outlook, By Offshore (2021-2030) ($MN)
28 North America Produced Water Treatment Market Outlook, By Application (2021-2030) ($MN)
29 North America Produced Water Treatment Market Outlook, By Oil & Gas Industry (2021-2030) ($MN)
30 North America Produced Water Treatment Market Outlook, By Power Generation Industry (2021-2030) ($MN)
31 North America Produced Water Treatment Market Outlook, By Agriculture & Irrigation (2021-2030) ($MN)
32 North America Produced Water Treatment Market Outlook, By Industrial Processes (2021-2030) ($MN)
33 North America Produced Water Treatment Market Outlook, By Environmental Remediation (2021-2030) ($MN)
34 North America Produced Water Treatment Market Outlook, By Other Applications (2021-2030) ($MN)
35 Europe Produced Water Treatment Market Outlook, By Country (2021-2030) ($MN)
36 Europe Produced Water Treatment Market Outlook, By Treatment Type (2021-2030) ($MN)
37 Europe Produced Water Treatment Market Outlook, By Reverse Osmosis/Membrane Treatment (2021-2030) ($MN)
38 Europe Produced Water Treatment Market Outlook, By Chemical Treatment (2021-2030) ($MN)
39 Europe Produced Water Treatment Market Outlook, By Physical Treatment (2021-2030) ($MN)
40 Europe Produced Water Treatment Market Outlook, By Biological Treatment (2021-2030) ($MN)
41 Europe Produced Water Treatment Market Outlook, By Other Treatment Types (2021-2030) ($MN)
42 Europe Produced Water Treatment Market Outlook, By Location (2021-2030) ($MN)
43 Europe Produced Water Treatment Market Outlook, By Onshore (2021-2030) ($MN)
44 Europe Produced Water Treatment Market Outlook, By Offshore (2021-2030) ($MN)
45 Europe Produced Water Treatment Market Outlook, By Application (2021-2030) ($MN)
46 Europe Produced Water Treatment Market Outlook, By Oil & Gas Industry (2021-2030) ($MN)
47 Europe Produced Water Treatment Market Outlook, By Power Generation Industry (2021-2030) ($MN)
48 Europe Produced Water Treatment Market Outlook, By Agriculture & Irrigation (2021-2030) ($MN)
49 Europe Produced Water Treatment Market Outlook, By Industrial Processes (2021-2030) ($MN)
50 Europe Produced Water Treatment Market Outlook, By Environmental Remediation (2021-2030) ($MN)
51 Europe Produced Water Treatment Market Outlook, By Other Applications (2021-2030) ($MN)
52 Asia Pacific Produced Water Treatment Market Outlook, By Country (2021-2030) ($MN)
53 Asia Pacific Produced Water Treatment Market Outlook, By Treatment Type (2021-2030) ($MN)
54 Asia Pacific Produced Water Treatment Market Outlook, By Reverse Osmosis/Membrane Treatment (2021-2030) ($MN)
55 Asia Pacific Produced Water Treatment Market Outlook, By Chemical Treatment (2021-2030) ($MN)
56 Asia Pacific Produced Water Treatment Market Outlook, By Physical Treatment (2021-2030) ($MN)
57 Asia Pacific Produced Water Treatment Market Outlook, By Biological Treatment (2021-2030) ($MN)
58 Asia Pacific Produced Water Treatment Market Outlook, By Other Treatment Types (2021-2030) ($MN)
59 Asia Pacific Produced Water Treatment Market Outlook, By Location (2021-2030) ($MN)
60 Asia Pacific Produced Water Treatment Market Outlook, By Onshore (2021-2030) ($MN)
61 Asia Pacific Produced Water Treatment Market Outlook, By Offshore (2021-2030) ($MN)
62 Asia Pacific Produced Water Treatment Market Outlook, By Application (2021-2030) ($MN)
63 Asia Pacific Produced Water Treatment Market Outlook, By Oil & Gas Industry (2021-2030) ($MN)
64 Asia Pacific Produced Water Treatment Market Outlook, By Power Generation Industry (2021-2030) ($MN)
65 Asia Pacific Produced Water Treatment Market Outlook, By Agriculture & Irrigation (2021-2030) ($MN)
66 Asia Pacific Produced Water Treatment Market Outlook, By Industrial Processes (2021-2030) ($MN)
67 Asia Pacific Produced Water Treatment Market Outlook, By Environmental Remediation (2021-2030) ($MN)
68 Asia Pacific Produced Water Treatment Market Outlook, By Other Applications (2021-2030) ($MN)
69 South America Produced Water Treatment Market Outlook, By Country (2021-2030) ($MN)
70 South America Produced Water Treatment Market Outlook, By Treatment Type (2021-2030) ($MN)
71 South America Produced Water Treatment Market Outlook, By Reverse Osmosis/Membrane Treatment (2021-2030) ($MN)
72 South America Produced Water Treatment Market Outlook, By Chemical Treatment (2021-2030) ($MN)
73 South America Produced Water Treatment Market Outlook, By Physical Treatment (2021-2030) ($MN)
74 South America Produced Water Treatment Market Outlook, By Biological Treatment (2021-2030) ($MN)
75 South America Produced Water Treatment Market Outlook, By Other Treatment Types (2021-2030) ($MN)
76 South America Produced Water Treatment Market Outlook, By Location (2021-2030) ($MN)
77 South America Produced Water Treatment Market Outlook, By Onshore (2021-2030) ($MN)
78 South America Produced Water Treatment Market Outlook, By Offshore (2021-2030) ($MN)
79 South America Produced Water Treatment Market Outlook, By Application (2021-2030) ($MN)
80 South America Produced Water Treatment Market Outlook, By Oil & Gas Industry (2021-2030) ($MN)
81 South America Produced Water Treatment Market Outlook, By Power Generation Industry (2021-2030) ($MN)
82 South America Produced Water Treatment Market Outlook, By Agriculture & Irrigation (2021-2030) ($MN)
83 South America Produced Water Treatment Market Outlook, By Industrial Processes (2021-2030) ($MN)
84 South America Produced Water Treatment Market Outlook, By Environmental Remediation (2021-2030) ($MN)
85 South America Produced Water Treatment Market Outlook, By Other Applications (2021-2030) ($MN)
86 Middle East & Africa Produced Water Treatment Market Outlook, By Country (2021-2030) ($MN)
87 Middle East & Africa Produced Water Treatment Market Outlook, By Treatment Type (2021-2030) ($MN)
88 Middle East & Africa Produced Water Treatment Market Outlook, By Reverse Osmosis/Membrane Treatment (2021-2030) ($MN)
89 Middle East & Africa Produced Water Treatment Market Outlook, By Chemical Treatment (2021-2030) ($MN)
90 Middle East & Africa Produced Water Treatment Market Outlook, By Physical Treatment (2021-2030) ($MN)
91 Middle East & Africa Produced Water Treatment Market Outlook, By Biological Treatment (2021-2030) ($MN)
92 Middle East & Africa Produced Water Treatment Market Outlook, By Other Treatment Types (2021-2030) ($MN)
93 Middle East & Africa Produced Water Treatment Market Outlook, By Location (2021-2030) ($MN)
94 Middle East & Africa Produced Water Treatment Market Outlook, By Onshore (2021-2030) ($MN)
95 Middle East & Africa Produced Water Treatment Market Outlook, By Offshore (2021-2030) ($MN)
96 Middle East & Africa Produced Water Treatment Market Outlook, By Application (2021-2030) ($MN)
97 Middle East & Africa Produced Water Treatment Market Outlook, By Oil & Gas Industry (2021-2030) ($MN)
98 Middle East & Africa Produced Water Treatment Market Outlook, By Power Generation Industry (2021-2030) ($MN)
99 Middle East & Africa Produced Water Treatment Market Outlook, By Agriculture & Irrigation (2021-2030) ($MN)
100 Middle East & Africa Produced Water Treatment Market Outlook, By Industrial Processes (2021-2030) ($MN)
101 Middle East & Africa Produced Water Treatment Market Outlook, By Environmental Remediation (2021-2030) ($MN)
102 Middle East & Africa Produced Water Treatment Market Outlook, By Other Applications (2021-2030) ($MN)
List of Figures
RESEARCH METHODOLOGY

We at ‘Stratistics’ opt for an extensive research approach which involves data mining, data validation, and data analysis. The various research sources include in-house repository, secondary research, competitor’s sources, social media research, client internal data, and primary research.
Our team of analysts prefers the most reliable and authenticated data sources in order to perform the comprehensive literature search. With access to most of the authenticated data bases our team highly considers the best mix of information through various sources to obtain extensive and accurate analysis.
Each report takes an average time of a month and a team of 4 industry analysts. The time may vary depending on the scope and data availability of the desired market report. The various parameters used in the market assessment are standardized in order to enhance the data accuracy.
Data Mining
The data is collected from several authenticated, reliable, paid and unpaid sources and is filtered depending on the scope & objective of the research. Our reports repository acts as an added advantage in this procedure. Data gathering from the raw material suppliers, distributors and the manufacturers is performed on a regular basis, this helps in the comprehensive understanding of the products value chain. Apart from the above mentioned sources the data is also collected from the industry consultants to ensure the objective of the study is in the right direction.
Market trends such as technological advancements, regulatory affairs, market dynamics (Drivers, Restraints, Opportunities and Challenges) are obtained from scientific journals, market related national & international associations and organizations.
Data Analysis
From the data that is collected depending on the scope & objective of the research the data is subjected for the analysis. The critical steps that we follow for the data analysis include:
- Product Lifecycle Analysis
- Competitor analysis
- Risk analysis
- Porters Analysis
- PESTEL Analysis
- SWOT Analysis
The data engineering is performed by the core industry experts considering both the Marketing Mix Modeling and the Demand Forecasting. The marketing mix modeling makes use of multiple-regression techniques to predict the optimal mix of marketing variables. Regression factor is based on a number of variables and how they relate to an outcome such as sales or profits.
Data Validation
The data validation is performed by the exhaustive primary research from the expert interviews. This includes telephonic interviews, focus groups, face to face interviews, and questionnaires to validate our research from all aspects. The industry experts we approach come from the leading firms, involved in the supply chain ranging from the suppliers, distributors to the manufacturers and consumers so as to ensure an unbiased analysis.
We are in touch with more than 15,000 industry experts with the right mix of consultants, CEO's, presidents, vice presidents, managers, experts from both supply side and demand side, executives and so on.
The data validation involves the primary research from the industry experts belonging to:
- Leading Companies
- Suppliers & Distributors
- Manufacturers
- Consumers
- Industry/Strategic Consultants
Apart from the data validation the primary research also helps in performing the fill gap research, i.e. providing solutions for the unmet needs of the research which helps in enhancing the reports quality.
For more details about research methodology, kindly write to us at info@strategymrc.com
Frequently Asked Questions
In case of any queries regarding this report, you can contact the customer service by filing the “Inquiry Before Buy” form available on the right hand side. You may also contact us through email: info@strategymrc.com or phone: +1-301-202-5929
Yes, the samples are available for all the published reports. You can request them by filling the “Request Sample” option available in this page.
Yes, you can request a sample with your specific requirements. All the customized samples will be provided as per the requirement with the real data masked.
All our reports are available in Digital PDF format. In case if you require them in any other formats, such as PPT, Excel etc you can submit a request through “Inquiry Before Buy” form available on the right hand side. You may also contact us through email: info@strategymrc.com or phone: +1-301-202-5929
We offer a free 15% customization with every purchase. This requirement can be fulfilled for both pre and post sale. You may send your customization requirements through email at info@strategymrc.com or call us on +1-301-202-5929.
We have 3 different licensing options available in electronic format.
- Single User Licence: Allows one person, typically the buyer, to have access to the ordered product. The ordered product cannot be distributed to anyone else.
- 2-5 User Licence: Allows the ordered product to be shared among a maximum of 5 people within your organisation.
- Corporate License: Allows the product to be shared among all employees of your organisation regardless of their geographical location.
All our reports are typically be emailed to you as an attachment.
To order any available report you need to register on our website. The payment can be made either through CCAvenue or PayPal payments gateways which accept all international cards.
We extend our support to 6 months post sale. A post sale customization is also provided to cover your unmet needs in the report.
Request Customization
We offer complimentary customization of up to 15% with every purchase. To share your customization requirements, feel free to email us at info@strategymrc.com or call us on +1-301-202-5929. .
Please Note: Customization within the 15% threshold is entirely free of charge. If your request exceeds this limit, we will conduct a feasibility assessment. Following that, a detailed quote and timeline will be provided.
WHY CHOOSE US ?

Assured Quality
Best in class reports with high standard of research integrity

24X7 Research Support
Continuous support to ensure the best customer experience.

Free Customization
Adding more values to your product of interest.

Safe & Secure Access
Providing a secured environment for all online transactions.

Trusted by 600+ Brands
Serving the most reputed brands across the world.