
Product Lifecycle Management Platforms Market
Product Lifecycle Management Platforms Market Forecasts to 2034 - Global Analysis By Access Mode (Web-Based Platforms, Mobile-Based Platforms, Desktop-Based Platforms, Other Access Modes), Deployment Mode, Organization Size, Application, End User and By Geography

|
Years Covered |
2023-2034 |
|
Estimated Year Value (2026) |
US $38.5 BN |
|
Projected Year Value (2034) |
US $76.2 BN |
|
CAGR (2026-2034) |
8.9% |
|
Regions Covered |
North America, Europe, Asia Pacific, South America, and Rest of the World (RoW) |
|
Countries Covered |
United States, Canada, Mexico, United Kingdom, Germany, France, Italy, Spain, Netherlands, Belgium, Sweden, Switzerland, Poland, Rest of Europe, China, Japan, India, South Korea, Australia, Indonesia, Thailand, Malaysia, Singapore, Vietnam, Rest of Asia Pacific, Brazil, Argentina, Colombia, Chile, Peru, Rest of South America, Saudi Arabia, United Arab Emirates, Qatar, Israel, Rest of Middle East, South Africa, Egypt, Morocco, and Rest of Africa. |
|
Largest Market |
North America |
|
Highest Growing Market |
Asia Pacific |
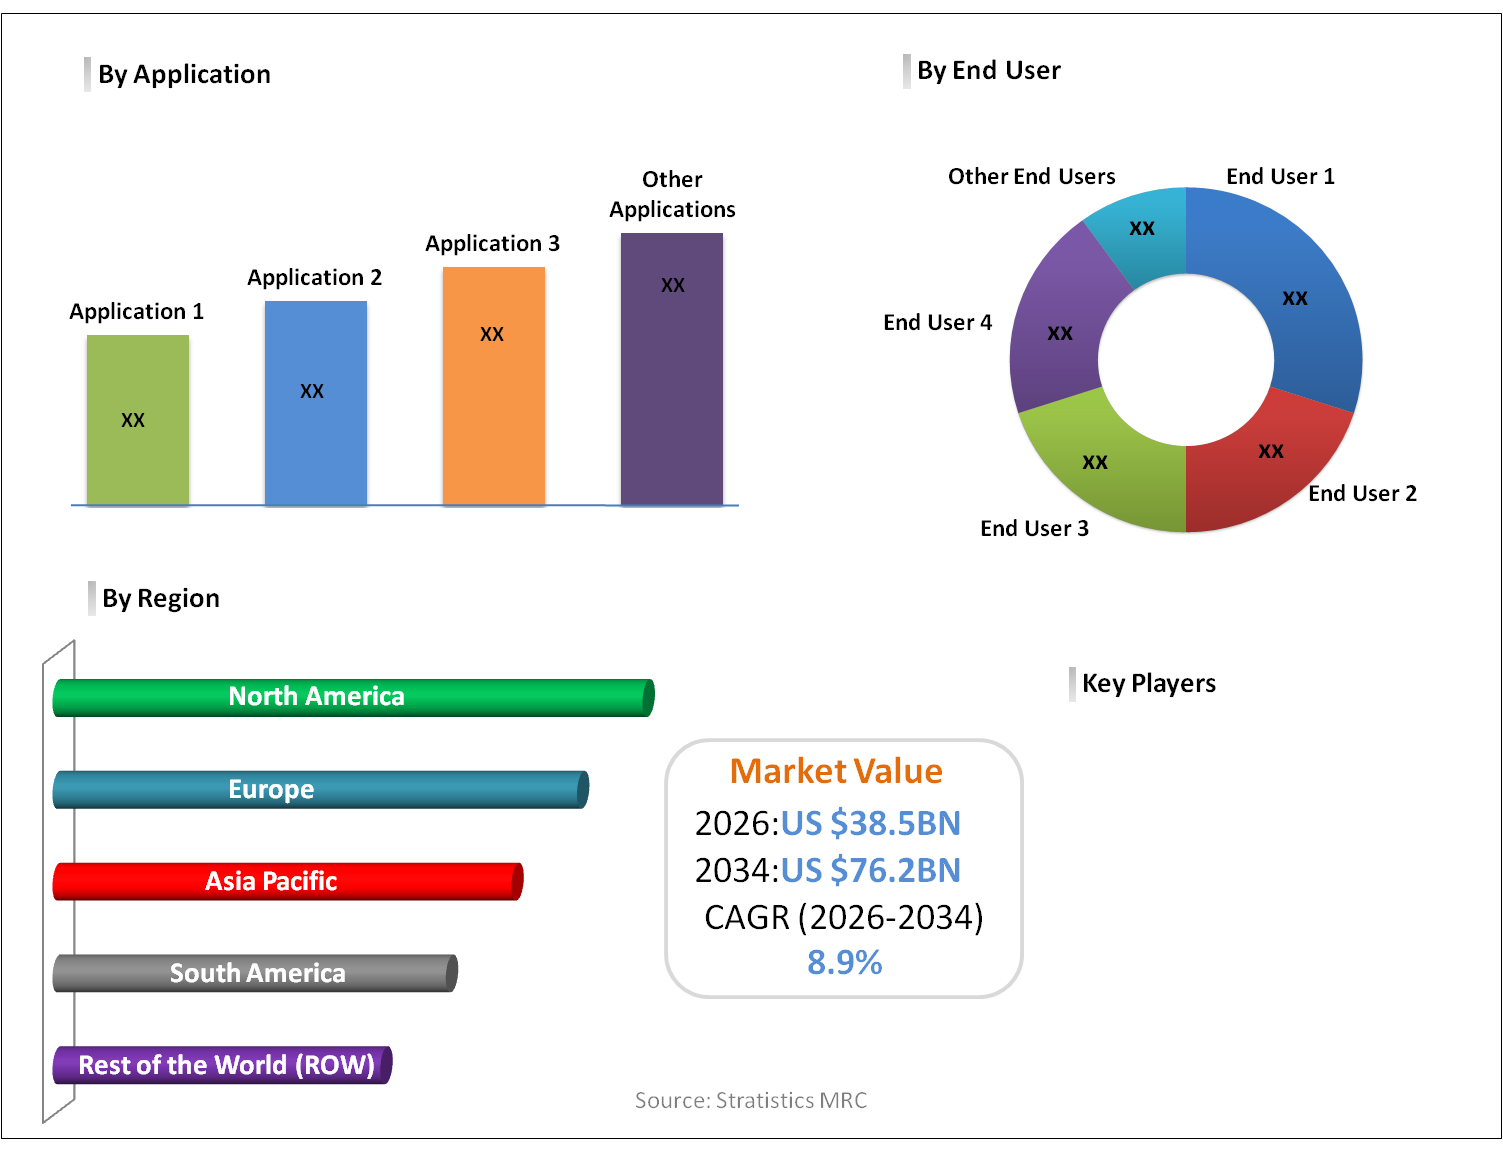
According to Stratistics MRC, the Global Product Lifecycle Management Platforms Market is accounted for $38.50 billion in 2026 and is expected to reach $76.20 billion by 2034 growing at a CAGR of 8.9% during the forecast period. Product Lifecycle Management (PLM) Platforms are digital software solutions that manage a product’s entire lifecycle from concept and design to manufacturing, distribution, and end-of-life. These platforms integrate data, processes, and stakeholders across departments to improve collaboration, efficiency, and innovation. PLM systems support functions such as product design, engineering changes, compliance, quality management, and supply chain coordination. Increasingly, they incorporate advanced technologies like cloud computing, AI, and analytics. Widely used across industries including manufacturing, automotive, healthcare, and consumer goods, PLM platforms help organizations reduce time-to-market, optimize costs, and enhance product performance.
Market Dynamics:
Driver:
Growing adoption of digital transformation
Organizations are leveraging PLM solutions to streamline product development, enhance collaboration, and improve operational efficiency. The integration of advanced technologies such as cloud computing, IoT, and AI is further boosting PLM adoption. These platforms enable real-time data sharing, which is propelling faster decision-making and innovation cycles. Enterprises are focusing on digital thread and digital twin capabilities, fostering seamless product lifecycle visibility. As companies prioritize agility and efficiency, the demand for PLM platforms continues to grow significantly.
Restraint:
High implementation and integration costs
Initial investment in software licensing, infrastructure, and customization can be substantial, which constrains adoption. Additionally, integrating PLM solutions with legacy systems is complex and often requires skilled expertise. The need for continuous maintenance, upgrades, and training further increases the total cost of ownership. These financial and technical challenges can hinder organizations from adopting PLM platforms at scale. As a result, cost-related concerns continue to act as a major restraint in the market.
Opportunity:
Expansion in manufacturing and automotive sectors
Increasing product complexity and the need for faster time-to-market are propelling the adoption of advanced PLM solutions. These industries are leveraging PLM platforms to manage design, engineering, and production processes more efficiently. The shift toward smart manufacturing and Industry 4.0 is further boosting the demand for integrated lifecycle management systems. PLM solutions are also fostering innovation in electric vehicles and connected products. As industrial sectors continue to modernize, PLM adoption is expected to expand significantly.
Threat:
Cybersecurity risks in cloud platforms
Sensitive product data stored on cloud systems is vulnerable to breaches, unauthorized access, and cyberattacks. These security concerns can degrade user trust and limit the adoption of cloud-based solutions. Organizations are required to invest heavily in advanced security measures, which adds to operational complexity. Regulatory compliance and data protection requirements further constrain platform deployment. As cyber threats continue to evolve, security risks remain a critical challenge for PLM providers.
Covid-19 Impact:
The COVID-19 pandemic accelerated the adoption of digital tools, significantly boosting the demand for PLM platforms. With remote work becoming the norm, organizations relied on PLM solutions to ensure continuity in product development processes. The pandemic highlighted the importance of cloud-based collaboration, propelling digital transformation initiatives. However, disruptions in supply chains and budget constraints temporarily hindered investments in new software deployments. Companies increasingly focused on cost optimization and operational resilience during this period. Overall, COVID-19 fostered long-term adoption of PLM platforms as businesses adapted to new working models.
The web-based platforms segment is expected to be the largest during the forecast period
The web-based platforms segment is expected to account for the largest market share during the forecast period as organizations increasingly prefer cloud-enabled and browser-based solutions. These platforms offer flexibility, scalability, and ease of access, which is boosting their adoption across enterprises. The ability to enable real-time collaboration across geographically dispersed teams is accelerating their deployment. Lower infrastructure requirements compared to on-premise solutions are also propelling demand. Web-based platforms support seamless updates and integration, fostering operational efficiency. As businesses shift toward cloud-first strategies, this segment is expected to dominate the market.
The electronics & semiconductors segment is expected to have the highest CAGR during the forecast period
Over the forecast period, the electronics & semiconductors segment is predicted to witness the highest growth rate due to increasing product complexity and rapid innovation cycles. The need to manage intricate designs and ensure regulatory compliance is accelerating PLM adoption in this sector. Short product lifecycles and high competition are propelling companies to adopt efficient lifecycle management solutions. PLM platforms enable better collaboration across design, manufacturing, and supply chain teams, boosting productivity. The rise of advanced technologies such as 5G, IoT, and AI is further fostering demand for PLM systems. As the semiconductor industry expands, PLM adoption is expected to grow rapidly.
Region with largest share:
During the forecast period, the North America region is expected to hold the largest market share owing to strong technological infrastructure and early adoption of advanced software solutions. The presence of major PLM vendors and a highly developed industrial base is boosting market growth. Companies in the region are investing heavily in digital transformation initiatives, accelerating PLM adoption. High demand from aerospace, automotive, and manufacturing sectors is propelling the use of lifecycle management platforms. Additionally, strong R&D capabilities and innovation ecosystems are fostering market expansion. Supportive regulatory frameworks and technological advancements continue to strengthen North America's dominance.
Region with highest CAGR:
Over the forecast period, the Asia Pacific region is anticipated to exhibit the highest CAGR as rapid industrialization and digitalization are accelerating PLM adoption. Emerging economies such as China, India, and Japan are witnessing significant growth in manufacturing and automotive sectors. Increasing investments in smart factories and Industry 4.0 initiatives are boosting demand for PLM platforms. The expansion of electronics and semiconductor industries is further propelling market growth. Government initiatives supporting digital infrastructure and innovation are fostering adoption across industries. As businesses modernize operations, Asia Pacific is expected to emerge as the fastest-growing region.

Key players in the market
Some of the key players in Product Lifecycle Management Platforms Market include Siemens AG, Dassault Systèmes SE, PTC Inc., Autodesk, Inc., Oracle Corporation, SAP SE, IBM Corporation, Microsoft Corporation, Aras Corporation, Arena Solutions, Inc., Centric Software, Inc., Ansys, Inc., Altair Engineering Inc., Hexagon AB and Infor, Inc.
Key Developments:
In November 2025, Siemens entered a strategic collaboration with Schaeffler to establish industry standards for digital twin data exchange. The partnership focuses on creating open data models that allow seamless transfer of product lifecycle information between different PLM systems across the supply chain.
In March 2025, Dassault Systèmes acquired a specialized software company focused on battery cell electrochemistry simulation. This acquisition integrates advanced molecular modeling into the 3DEXPERIENCE platform, enabling researchers to design next-generation battery materials with higher energy density and faster charging capabilities.
Access Modes Covered:
• Web-Based Platforms
• Mobile-Based Platforms
• Desktop-Based Platforms
• Other Access Modes
Deployment Modes Covered:
• Cloud-Based
• On-Premises
Organization Sizes Covered:
• Large Enterprises
• Small & Medium Enterprises (SMEs)
Applications Covered:
• Product Design & Engineering
• Simulation & Testing
• Product Data Management (PDM)
• Change & Configuration Management
• Quality & Compliance Management
• Manufacturing Process Management
• Portfolio & Program Management
• Other Applications
End Users Covered:
• Automotive & Transportation
• Aerospace & Defense
• Industrial Machinery & Equipment
• Electronics & Semiconductors
• Consumer Goods & Retail
• Construction & Infrastructure
• Other End Users
Regions Covered:
• North America
o United States
o Canada
o Mexico
• Europe
o United Kingdom
o Germany
o France
o Italy
o Spain
o Netherlands
o Belgium
o Sweden
o Switzerland
o Poland
o Rest of Europe
• Asia Pacific
o China
o Japan
o India
o South Korea
o Australia
o Indonesia
o Thailand
o Malaysia
o Singapore
o Vietnam
o Rest of Asia Pacific
• South America
o Brazil
o Argentina
o Colombia
o Chile
o Peru
o Rest of South America
• Rest of the World (RoW)
o Middle East
§ Saudi Arabia
§ United Arab Emirates
§ Qatar
§ Israel
§ Rest of Middle East
o Africa
§ South Africa
§ Egypt
§ Morocco
§ Rest of Africa
What our report offers:
- Market share assessments for the regional and country-level segments
- Strategic recommendations for the new entrants
- Covers Market data for the years 2023, 2024, 2025, 2026, 2027, 2028, 2030, 2032 and 2034
- Market Trends (Drivers, Constraints, Opportunities, Threats, Challenges, Investment Opportunities, and recommendations)
- Strategic recommendations in key business segments based on the market estimations
- Competitive landscaping mapping the key common trends
- Company profiling with detailed strategies, financials, and recent developments
- Supply chain trends mapping the latest technological advancements
Free Customization Offerings:
All the customers of this report will be entitled to receive one of the following free customization options:
• Company Profiling
o Comprehensive profiling of additional market players (up to 3)
o SWOT Analysis of key players (up to 3)
• Regional Segmentation
o Market estimations, Forecasts and CAGR of any prominent country as per the client's interest (Note:
Depends on feasibility check)
• Competitive Benchmarking
o Benchmarking of key players based on product portfolio, geographical presence, and strategic alliances
Table of Contents
1 Executive Summary
1.1 Market Snapshot and Key Highlights
1.2 Growth Drivers, Challenges, and Opportunities
1.3 Competitive Landscape Overview
1.4 Strategic Insights and Recommendations
2 Research Framework
2.1 Study Objectives and Scope
2.2 Stakeholder Analysis
2.3 Research Assumptions and Limitations
2.4 Research Methodology
2.4.1 Data Collection (Primary and Secondary)
2.4.2 Data Modeling and Estimation Techniques
2.4.3 Data Validation and Triangulation
2.4.4 Analytical and Forecasting Approach
3 Market Dynamics and Trend Analysis
3.1 Market Definition and Structure
3.2 Key Market Drivers
3.3 Market Restraints and Challenges
3.4 Growth Opportunities and Investment Hotspots
3.5 Industry Threats and Risk Assessment
3.6 Technology and Innovation Landscape
3.7 Emerging and High-Growth Markets
3.8 Regulatory and Policy Environment
3.9 Impact of COVID-19 and Recovery Outlook
4 Competitive and Strategic Assessment
4.1 Porter's Five Forces Analysis
4.1.1 Supplier Bargaining Power
4.1.2 Buyer Bargaining Power
4.1.3 Threat of Substitutes
4.1.4 Threat of New Entrants
4.1.5 Competitive Rivalry
4.2 Market Share Analysis of Key Players
4.3 Product Benchmarking and Performance Comparison
5 Global Product Lifecycle Management Platforms Market, By Access Mode
5.1 Web-Based Platforms
5.2 Mobile-Based Platforms
5.3 Desktop-Based Platforms
5.4 Other Access Modes
6 Global Product Lifecycle Management Platforms Market, By Deployment Mode
6.1 Cloud-Based
6.2 On-Premises
7 Global Product Lifecycle Management Platforms Market, By Organization Size
7.1 Large Enterprises
7.2 Small & Medium Enterprises (SMEs)
8 Global Product Lifecycle Management Platforms Market, By Application
8.1 Product Design & Engineering
8.2 Simulation & Testing
8.3 Product Data Management (PDM)
8.4 Change & Configuration Management
8.5 Quality & Compliance Management
8.6 Manufacturing Process Management
8.7 Portfolio & Program Management
8.8 Other Applications
9 Global Product Lifecycle Management Platforms Market, By End User
9.1 Automotive & Transportation
9.2 Aerospace & Defense
9.3 Industrial Machinery & Equipment
9.4 Electronics & Semiconductors
9.5 Consumer Goods & Retail
9.6 Construction & Infrastructure
9.7 Other End Users
10 Global Product Lifecycle Management Platforms Market, By Geography
10.1 North America
10.1.1 United States
10.1.2 Canada
10.1.3 Mexico
10.2 Europe
10.2.1 United Kingdom
10.2.2 Germany
10.2.3 France
10.2.4 Italy
10.2.5 Spain
10.2.6 Netherlands
10.2.7 Belgium
10.2.8 Sweden
10.2.9 Switzerland
10.2.10 Poland
10.2.11 Rest of Europe
10.3 Asia Pacific
10.3.1 China
10.3.2 Japan
10.3.3 India
10.3.4 South Korea
10.3.5 Australia
10.3.6 Indonesia
10.3.7 Thailand
10.3.8 Malaysia
10.3.9 Singapore
10.3.10 Vietnam
10.3.11 Rest of Asia Pacific
10.4 South America
10.4.1 Brazil
10.4.2 Argentina
10.4.3 Colombia
10.4.4 Chile
10.4.5 Peru
10.4.6 Rest of South America
10.5 Rest of the World (RoW)
10.5.1 Middle East
10.5.1.1 Saudi Arabia
10.5.1.2 United Arab Emirates
10.5.1.3 Qatar
10.5.1.4 Israel
10.5.1.5 Rest of Middle East
10.5.2 Africa
10.5.2.1 South Africa
10.5.2.2 Egypt
10.5.2.3 Morocco
10.5.2.4 Rest of Africa
11 Strategic Market Intelligence
11.1 Industry Value Network and Supply Chain Assessment
11.2 White-Space and Opportunity Mapping
11.3 Product Evolution and Market Life Cycle Analysis
11.4 Channel, Distributor, and Go-to-Market Assessment
12 Industry Developments and Strategic Initiatives
12.1 Mergers and Acquisitions
12.2 Partnerships, Alliances, and Joint Ventures
12.3 New Product Launches and Certifications
12.4 Capacity Expansion and Investments
12.5 Other Strategic Initiatives
13 Company Profiles
13.1 Siemens AG
13.2 Dassault Systèmes SE
13.3 PTC Inc.
13.4 Autodesk, Inc.
13.5 Oracle Corporation
13.6 SAP SE
13.7 IBM Corporation
13.8 Microsoft Corporation
13.9 Aras Corporation
13.10 Arena Solutions, Inc.
13.11 Centric Software, Inc.
13.12 Ansys, Inc.
13.13 Altair Engineering Inc.
13.14 Hexagon AB
13.15 Infor, Inc.
List of Tables
1 Global Product Lifecycle Management Platforms Market Outlook, By Region (2023-2034) ($MN)
2 Global Product Lifecycle Management Platforms Market, By Access Mode (2023–2034) ($MN)
3 Global Product Lifecycle Management Platforms Market, By Web-Based Platforms (2023–2034) ($MN)
4 Global Product Lifecycle Management Platforms Market, By Mobile-Based Platforms (2023–2034) ($MN)
5 Global Product Lifecycle Management Platforms Market, By Desktop-Based Platforms (2023–2034) ($MN)
6 Global Product Lifecycle Management Platforms Market, By Other Access Modes (2023–2034) ($MN)
7 Global Product Lifecycle Management Platforms Market, By Deployment Mode (2023–2034) ($MN)
8 Global Product Lifecycle Management Platforms Market, By Cloud-Based (2023–2034) ($MN)
9 Global Product Lifecycle Management Platforms Market, By On-Premises (2023–2034) ($MN)
10 Global Product Lifecycle Management Platforms Market, By Organization Size (2023–2034) ($MN)
11 Global Product Lifecycle Management Platforms Market, By Large Enterprises (2023–2034) ($MN)
12 Global Product Lifecycle Management Platforms Market, By Small & Medium Enterprises (SMEs) (2023–2034) ($MN)
13 Global Product Lifecycle Management Platforms Market, By Application (2023–2034) ($MN)
14 Global Product Lifecycle Management Platforms Market, By Product Design & Engineering (2023–2034) ($MN)
15 Global Product Lifecycle Management Platforms Market, By Simulation & Testing (2023–2034) ($MN)
16 Global Product Lifecycle Management Platforms Market, By Product Data Management (PDM) (2023–2034) ($MN)
17 Global Product Lifecycle Management Platforms Market, By Change & Configuration Management (2023–2034) ($MN)
18 Global Product Lifecycle Management Platforms Market, By Quality & Compliance Management (2023–2034) ($MN)
19 Global Product Lifecycle Management Platforms Market, By Manufacturing Process Management (2023–2034) ($MN)
20 Global Product Lifecycle Management Platforms Market, By Portfolio & Program Management (2023–2034) ($MN)
21 Global Product Lifecycle Management Platforms Market, By Other Applications (2023–2034) ($MN)
22 Global Product Lifecycle Management Platforms Market, By End User (2023–2034) ($MN)
23 Global Product Lifecycle Management Platforms Market, By Automotive & Transportation (2023–2034) ($MN)
24 Global Product Lifecycle Management Platforms Market, By Aerospace & Defense (2023–2034) ($MN)
25 Global Product Lifecycle Management Platforms Market, By Industrial Machinery & Equipment (2023–2034) ($MN)
26 Global Product Lifecycle Management Platforms Market, By Electronics & Semiconductors (2023–2034) ($MN)
27 Global Product Lifecycle Management Platforms Market, By Consumer Goods & Retail (2023–2034) ($MN)
28 Global Product Lifecycle Management Platforms Market, By Construction & Infrastructure (2023–2034) ($MN)
29 Global Product Lifecycle Management Platforms Market, By Other End Users (2023–2034) ($MN)
Note: Tables for North America, Europe, APAC, South America, and Rest of the World (RoW) are also represented in the same manner as above.
List of Figures
RESEARCH METHODOLOGY

We at ‘Stratistics’ opt for an extensive research approach which involves data mining, data validation, and data analysis. The various research sources include in-house repository, secondary research, competitor’s sources, social media research, client internal data, and primary research.
Our team of analysts prefers the most reliable and authenticated data sources in order to perform the comprehensive literature search. With access to most of the authenticated data bases our team highly considers the best mix of information through various sources to obtain extensive and accurate analysis.
Each report takes an average time of a month and a team of 4 industry analysts. The time may vary depending on the scope and data availability of the desired market report. The various parameters used in the market assessment are standardized in order to enhance the data accuracy.
Data Mining
The data is collected from several authenticated, reliable, paid and unpaid sources and is filtered depending on the scope & objective of the research. Our reports repository acts as an added advantage in this procedure. Data gathering from the raw material suppliers, distributors and the manufacturers is performed on a regular basis, this helps in the comprehensive understanding of the products value chain. Apart from the above mentioned sources the data is also collected from the industry consultants to ensure the objective of the study is in the right direction.
Market trends such as technological advancements, regulatory affairs, market dynamics (Drivers, Restraints, Opportunities and Challenges) are obtained from scientific journals, market related national & international associations and organizations.
Data Analysis
From the data that is collected depending on the scope & objective of the research the data is subjected for the analysis. The critical steps that we follow for the data analysis include:
- Product Lifecycle Analysis
- Competitor analysis
- Risk analysis
- Porters Analysis
- PESTEL Analysis
- SWOT Analysis
The data engineering is performed by the core industry experts considering both the Marketing Mix Modeling and the Demand Forecasting. The marketing mix modeling makes use of multiple-regression techniques to predict the optimal mix of marketing variables. Regression factor is based on a number of variables and how they relate to an outcome such as sales or profits.
Data Validation
The data validation is performed by the exhaustive primary research from the expert interviews. This includes telephonic interviews, focus groups, face to face interviews, and questionnaires to validate our research from all aspects. The industry experts we approach come from the leading firms, involved in the supply chain ranging from the suppliers, distributors to the manufacturers and consumers so as to ensure an unbiased analysis.
We are in touch with more than 15,000 industry experts with the right mix of consultants, CEO's, presidents, vice presidents, managers, experts from both supply side and demand side, executives and so on.
The data validation involves the primary research from the industry experts belonging to:
- Leading Companies
- Suppliers & Distributors
- Manufacturers
- Consumers
- Industry/Strategic Consultants
Apart from the data validation the primary research also helps in performing the fill gap research, i.e. providing solutions for the unmet needs of the research which helps in enhancing the reports quality.
For more details about research methodology, kindly write to us at info@strategymrc.com
Frequently Asked Questions
In case of any queries regarding this report, you can contact the customer service by filing the “Inquiry Before Buy” form available on the right hand side. You may also contact us through email: info@strategymrc.com or phone: +1-301-202-5929
Yes, the samples are available for all the published reports. You can request them by filling the “Request Sample” option available in this page.
Yes, you can request a sample with your specific requirements. All the customized samples will be provided as per the requirement with the real data masked.
All our reports are available in Digital PDF format. In case if you require them in any other formats, such as PPT, Excel etc you can submit a request through “Inquiry Before Buy” form available on the right hand side. You may also contact us through email: info@strategymrc.com or phone: +1-301-202-5929
We offer a free 15% customization with every purchase. This requirement can be fulfilled for both pre and post sale. You may send your customization requirements through email at info@strategymrc.com or call us on +1-301-202-5929.
We have 3 different licensing options available in electronic format.
- Single User Licence: Allows one person, typically the buyer, to have access to the ordered product. The ordered product cannot be distributed to anyone else.
- 2-5 User Licence: Allows the ordered product to be shared among a maximum of 5 people within your organisation.
- Corporate License: Allows the product to be shared among all employees of your organisation regardless of their geographical location.
All our reports are typically be emailed to you as an attachment.
To order any available report you need to register on our website. The payment can be made either through CCAvenue or PayPal payments gateways which accept all international cards.
We extend our support to 6 months post sale. A post sale customization is also provided to cover your unmet needs in the report.
Request Customization
We offer complimentary customization of up to 15% with every purchase. To share your customization requirements, feel free to email us at info@strategymrc.com or call us on +1-301-202-5929. .
Please Note: Customization within the 15% threshold is entirely free of charge. If your request exceeds this limit, we will conduct a feasibility assessment. Following that, a detailed quote and timeline will be provided.
WHY CHOOSE US ?

Assured Quality
Best in class reports with high standard of research integrity

24X7 Research Support
Continuous support to ensure the best customer experience.

Free Customization
Adding more values to your product of interest.

Safe & Secure Access
Providing a secured environment for all online transactions.

Trusted by 600+ Brands
Serving the most reputed brands across the world.