
Propanol Market
Propanol Market Forecasts to 2028 - Global Analysis By Type (N-Propanol and Isopropanol), Purity (90%, 95%, 98%, 99% and > 99%), Packaging Type (Bottle, Drums, Can and Other Packaging Types), Application (Pigments, Fuel Additives and Other Applications), End User and By Geography

|
Years Covered |
2020-2028 |
|
Estimated Year Value (2022) |
US $3.96 BN |
|
Projected Year Value (2028) |
US $5.62 BN |
|
CAGR (2022 - 2028) |
6.0% |
|
Regions Covered |
North America, Europe, Asia Pacific, South America, and Middle East & Africa |
|
Countries Covered |
US, Canada, Mexico, Germany, UK, Italy, France, Spain, Japan, China, India, Australia, New Zealand, South Korea, Rest of Asia Pacific, South America, Argentina, Brazil, Chile, Middle East & Africa, Saudi Arabia, UAE, Qatar, and South Africa |
|
Largest Market |
Asia Pacific |
|
Highest Growing Market |
Europe |
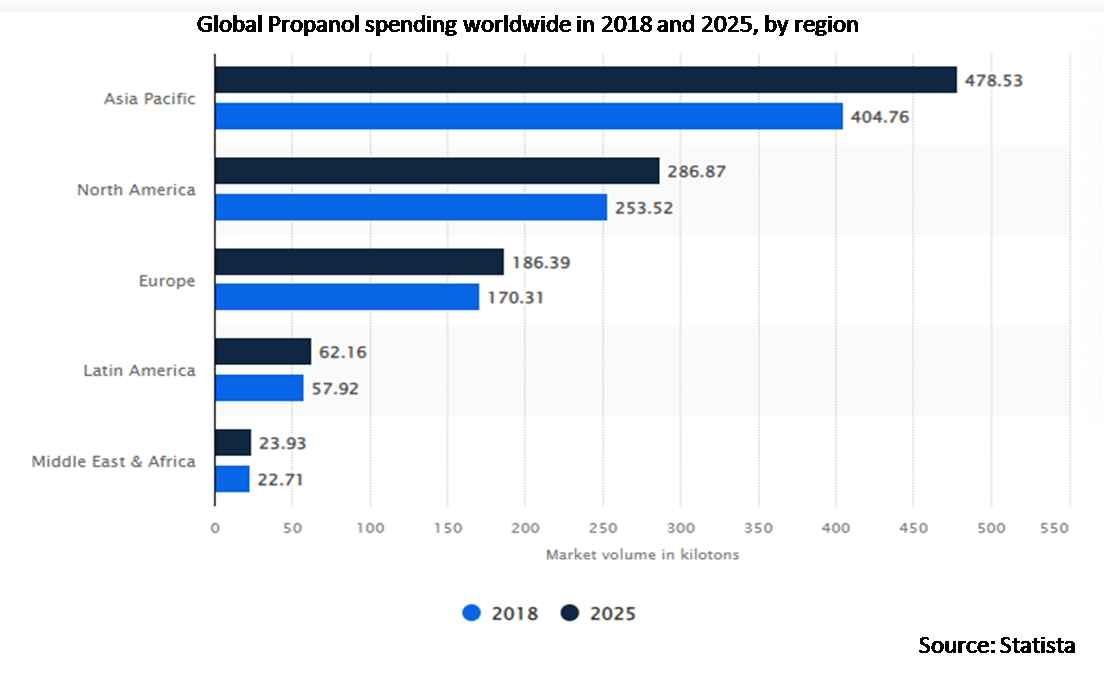
According to Stratistics MRC, the Global Propanol Market is accounted for $3.96 billion in 2022 and is expected to reach $5.62 billion by 2028 growing at a CAGR of 6.0% during the forecast period. Isopropanol and n-propanol, sometimes known as 1-propanol, are two of the most commonly seen colourless forms of alcohol. Isopropanol and n-propanol are generally employed as natural solvents in a variety of industrial applications. In addition, medium-volatile alcohol such as n-propanol is employed in the coating business to improve the drying capabilities of electro-deposition paints, alkyd resins, and baked finishes. Due to its capacity to lessen the tendency of completed products to produce foam and reduce liquid thickness, it is frequently utilised as one of the primary raw ingredients in the cosmetics sector.
Market Dynamics:
Driver:
Increasing demand for paint and coatings
The market for propanol has grown as a result of the growing demand for paint and coatings. The paints and coatings industry uses n-propanol as a solvent during production. The growing urban population in the majority of emerging regions is the cause of the growth of the building sector. The automotive industry is a further significant user of paints and coatings. The consequences of the recession are still being felt by the automotive industry, and there is not much of a demand for new vehicles. Thus, when the construction sector expands in these countries, there will be a greater demand for paints and coatings, which will ultimately drive the worldwide propanol market.
Restraint:
Shifting focus toward green solvents due to high VOC emission
Propanol market expansion is being constrained by VOC emissions and other environmental issues related to the usage of solvents based on petrochemicals. The environmental risks associated with petroleum-based solvents have prompted an increase in the use of substitutes that use less petrochemical-based solvent, such as the use of water-based paints and coatings in construction applications rather than solvent-based paints and coatings. The usage of bio & green solvents with the properties of petrochemical-based solvents and without VOCs can solve this issue.
Opportunity:
Growing demand for industrial solvents in emerging economies
The ability of solvents to combine with various solids, liquids, and gases makes them useful in industry. Solvents containing propane are frequently utilised in sectors like paint, adhesives, and pharmaceuticals. The world's developing nations are rapidly industrialising, which will offer plenty of room for expansion for propanol producers in the years to come. The propanol market in emerging nations will grow as a result of rising adhesive, paint, pharmaceutical, and other product consumption brought on by developments in the construction, automotive, healthcare, and other industries.
Threat:
Harmful effects of petrochemical-based solvents
Health risks of many kinds can be caused by exposure to propanol solvents. N-propyl alcohol or n-propanol exposure can result in a variety of symptoms, including cracking skin, sleepiness, headaches, ataxia, gastrointestinal pain, stomach cramps, nausea, vomiting, and diarrhoea. On the other hand, exposure to isopropyl alcohol can harm the brain, the liver, the kidneys, the cardiovascular system, and other organs. Isopropyl alcohol is thought to be slightly less hazardous than n-propanol. As a result, the market may face difficulties due to the negative impacts of propanol solvents.
Covid-19 Impact
The COVID-19 pandemic caused the closure of various manufacturing facilities for pharmaceuticals, food and drink, and personal care products in 2020, which had an adverse effect on the expansion of the propanol market. Raw material availability decreased as a result of the import-export supply chain disruption, which had an additional negative impact on market expansion. Additionally, it is predicted that the propanol market will return to normal circumstances in the forecast period taking into account the new normal state and the reopening of several enterprises in various regions.
The isopropanol segment is expected to be the largest during the forecast period
The isopropanol segment is estimated to have a lucrative growth. Isopropanol is utilised as a solvent in a variety of products including paints & coatings, inks, medicines, and household & personal care items since it is inexpensive and widely available. Isopropanol is increasingly being used to denaturize ethanol, which is one of the main causes fueling the demand for it. So, during the course of the projection period, the market would continue to rise as a result of the rising use of isopropanol.
The drugs segment is expected to have the highest CAGR during the forecast period
The drugs segment is anticipated to witness the fastest CAGR growth during the forecast period. The class of medications known as beta-blockers includes propanol. Drugs containing propanol often come in oral tablet, oral liquid solution, oral extended-release capsule, and Injectable forms. In very small amounts, isopropanol is used to make capsules and tablets. Propanol is used to treat a variety of conditions, including high blood pressure, irregular heartbeats, pheochromocytoma, some forms of tremors, and hypertrophic subaortic stenosis.
Region with highest share:
Asia Pacific is projected to hold the largest market share during the forecast period owing to demand for propanol and its derivatives is being driven by nations with rapid economic expansion, like China, India, and South Korea. One of the key variables influencing consumption is the increase in infrastructure spending, along with the existence of a strong pharmaceutical industry environment. Additionally, governments are attempting to enhance sanitizer manufacturing to counter the COVID 19 virus.
Region with highest CAGR:
Europe is projected to have the highest CAGR over the forecast period, owing to the use of speciality chemicals and pharmaceuticals has expanded. The demand for sanitizers is driving a rapid increase in use. Large-scale consumption of isopropyl alcohol has caused a shortage of the compounds. To successfully make isopropyl alcohol, many businesses in the area are simplifying their raw material supply.

Key players in the market
Some of the key players profiled in the Propanol Market include LG Chem Ltd., The Dow Chemical Company, Exxon Mobil Corporation, Tokuyama Corporation, BASF SE, LCY Chemical Corp., Sasol Limited, Eastman Chemical Company, Royal Dutch Shell Plc, JXTG Holdings, Inc., China National Petroleum Corporation, Mitsui Chemicals Inc., Zhejiang Xinhua Chemical Co Ltd., Oxea GMBH and ISU Chemical Co Ltd.
Key Developments:
In July 2018, OXEA GmbH inaugurated its new propanol production unit in Texas, US. The new production facility will increase the company’s North American production capacity of n-propanol by 75%.
In March 2017, Royal Dutch Shell established its new technology center in Bangalore, India. Expansion is a part of the company’s strategy to expand its R&D activities in Asia.
In August 2015, OXEA GmbH launched a new product, namely, n-propanol (biocide quality). The product is specially designed as a base material for biocidal products.
Types Covered:
• N-Propanol
• Isopropanol
Purity Covered:
• 90%
• 95%
• 98%
• 99%
• > 99%
Packaging Types Covered:
• Bottle
• Drums
• Can
• Other Packaging Types
Applications Covered:
• Pigments
• Fuel Additives
• Adhesives
• Paints and Coatings
• Food additive
• Printing Inks
• Fertilizers
• Drugs
• Dye
• Other Applications
End Users Covered:
• Building and Construction
• Personal Care
• Automotive
• Paints Agriculture
• Food and Beverage
• Pharmaceuticals
• Other End Users
Regions Covered:
• North America
o US
o Canada
o Mexico
• Europe
o Germany
o UK
o Italy
o France
o Spain
o Rest of Europe
• Asia Pacific
o Japan
o China
o India
o Australia
o New Zealand
o South Korea
o Rest of Asia Pacific
• South America
o Argentina
o Brazil
o Chile
o Rest of South America
• Middle East & Africa
o Saudi Arabia
o UAE
o Qatar
o South Africa
o Rest of Middle East & Africa
What our report offers:
- Market share assessments for the regional and country-level segments
- Strategic recommendations for the new entrants
- Covers Market data for the years 2020, 2021, 2022, 2025, and 2028
- Market Trends (Drivers, Constraints, Opportunities, Threats, Challenges, Investment Opportunities, and recommendations)
- Strategic recommendations in key business segments based on the market estimations
- Competitive landscaping mapping the key common trends
- Company profiling with detailed strategies, financials, and recent developments
- Supply chain trends mapping the latest technological advancements
Free Customization Offerings:
All the customers of this report will be entitled to receive one of the following free customization options:
• Company Profiling
o Comprehensive profiling of additional market players (up to 3)
o SWOT Analysis of key players (up to 3)
• Regional Segmentation
o Market estimations, Forecasts and CAGR of any prominent country as per the client's interest (Note: Depends on feasibility check)
• Competitive Benchmarking
o Benchmarking of key players based on product portfolio, geographical presence, and strategic alliances
Table of Contents
1 Executive Summary
2 Preface
2.1 Abstract
2.2 Stake Holders
2.3 Research Scope
2.4 Research Methodology
2.4.1 Data Mining
2.4.2 Data Analysis
2.4.3 Data Validation
2.4.4 Research Approach
2.5 Research Sources
2.5.1 Primary Research Sources
2.5.2 Secondary Research Sources
2.5.3 Assumptions
3 Market Trend Analysis
3.1 Introduction
3.2 Drivers
3.3 Restraints
3.4 Opportunities
3.5 Threats
3.6 Application Analysis
3.7 End User Analysis
3.8 Emerging Markets
3.9 Impact of Covid-19
4 Porters Five Force Analysis
4.1 Bargaining power of suppliers
4.2 Bargaining power of buyers
4.3 Threat of substitutes
4.4 Threat of new entrants
4.5 Competitive rivalry
5 Global Propanol Market, By Type
5.1 Introduction
5.2 N-Propanol
5.3 Isopropanol
6 Global Propanol Market, By Purity
6.1 Introduction
6.2 90%
6.3 95%
6.4 98%
6.5 99%
6.6 > 99%
7 Global Propanol Market, By Packaging Type
7.1 Introduction
7.2 Bottle
7.3 Drums
7.4 Can
7.5 Other Packaging Types
8 Global Propanol Market, By Application
8.1 Introduction
8.2 Pigments
8.3 Fuel Additives
8.4 Adhesives
8.5 Paints and Coatings
8.6 Food additive
8.7 Printing Inks
8.8 Fertilizers
8.8.1 Biocide
8.8.2 Pesticide
8.9 Drugs
8.10 Dye
8.11 Other Applications
9 Global Propanol Market, By End User
9.1 Introduction
9.2 Building and Construction
9.2.1 Industrial
9.2.2 Residential
9.2.3 Infrastructure
9.2.4 Commercial
9.3 Personal Care
9.3.1 Creams
9.3.2 Sanitizers
9.3.3 Soaps
9.4 Automotive
9.4.1 Heavy Commercial Vehicle
9.4.2 Commercial Vehicle
9.4.3 Passenger Cars
9.5 Agriculture
9.6 Food and Beverage
9.7 Pharmaceuticals
9.8 Other End Users
10 Global Propanol Market, By Geography
10.1 Introduction
10.2 North America
10.2.1 US
10.2.2 Canada
10.2.3 Mexico
10.3 Europe
10.3.1 Germany
10.3.2 UK
10.3.3 Italy
10.3.4 France
10.3.5 Spain
10.3.6 Rest of Europe
10.4 Asia Pacific
10.4.1 Japan
10.4.2 China
10.4.3 India
10.4.4 Australia
10.4.5 New Zealand
10.4.6 South Korea
10.4.7 Rest of Asia Pacific
10.5 South America
10.5.1 Argentina
10.5.2 Brazil
10.5.3 Chile
10.5.4 Rest of South America
10.6 Middle East & Africa
10.6.1 Saudi Arabia
10.6.2 UAE
10.6.3 Qatar
10.6.4 South Africa
10.6.5 Rest of Middle East & Africa
11 Key Developments
11.1 Agreements, Partnerships, Collaborations and Joint Ventures
11.2 Acquisitions & Mergers
11.3 New Product Launch
11.4 Expansions
11.5 Other Key Strategies
12 Company Profiling
12.1 LG Chem Ltd.
12.2 The Dow Chemical Company
12.3 Exxon Mobil Corporation
12.4 Tokuyama Corporation.
12.5 BASF SE
12.6 LCY Chemical Corp.
12.7 Sasol Limited
12.8 Eastman Chemical Company
12.9 Royal Dutch Shell Plc
12.10 JXTG Holdings, Inc.
12.11 China National Petroleum Corporation
12.12 Mitsui Chemicals Inc.
12.13 Zhejiang Xinhua Chemical Co Ltd.
12.14 Oxea GMBH
12.15 ISU Chemical Co Ltd.
List of Tables
1 Global Propanol Market Outlook, By Region (2020-2028) ($MN)
2 Global Propanol Market Outlook, By Type (2020-2028) ($MN)
3 Global Propanol Market Outlook, By N-Propanol (2020-2028) ($MN)
4 Global Propanol Market Outlook, By Isopropanol (2020-2028) ($MN)
5 Global Propanol Market Outlook, By Purity (2020-2028) ($MN)
6 Global Propanol Market Outlook, By 0.9 (2020-2028) ($MN)
7 Global Propanol Market Outlook, By 0.95 (2020-2028) ($MN)
8 Global Propanol Market Outlook, By 0.98 (2020-2028) ($MN)
9 Global Propanol Market Outlook, By 0.99 (2020-2028) ($MN)
10 Global Propanol Market Outlook, By > 99% (2020-2028) ($MN)
11 Global Propanol Market Outlook, By Packaging Type (2020-2028) ($MN)
12 Global Propanol Market Outlook, By Bottle (2020-2028) ($MN)
13 Global Propanol Market Outlook, By Drums (2020-2028) ($MN)
14 Global Propanol Market Outlook, By Can (2020-2028) ($MN)
15 Global Propanol Market Outlook, By Other Packaging Types (2020-2028) ($MN)
16 Global Propanol Market Outlook, By Application (2020-2028) ($MN)
17 Global Propanol Market Outlook, By Pigments (2020-2028) ($MN)
18 Global Propanol Market Outlook, By Fuel Additives (2020-2028) ($MN)
19 Global Propanol Market Outlook, By Adhesives (2020-2028) ($MN)
20 Global Propanol Market Outlook, By Paints and Coatings (2020-2028) ($MN)
21 Global Propanol Market Outlook, By Food additive (2020-2028) ($MN)
22 Global Propanol Market Outlook, By Printing Inks (2020-2028) ($MN)
23 Global Propanol Market Outlook, By Fertilizers (2020-2028) ($MN)
24 Global Propanol Market Outlook, By Biocide (2020-2028) ($MN)
25 Global Propanol Market Outlook, By Pesticide (2020-2028) ($MN)
26 Global Propanol Market Outlook, By Drugs (2020-2028) ($MN)
27 Global Propanol Market Outlook, By Dye (2020-2028) ($MN)
28 Global Propanol Market Outlook, By Other Applications (2020-2028) ($MN)
29 Global Propanol Market Outlook, By End User (2020-2028) ($MN)
30 Global Propanol Market Outlook, By Building and Construction (2020-2028) ($MN)
31 Global Propanol Market Outlook, By Industrial (2020-2028) ($MN)
32 Global Propanol Market Outlook, By Residential (2020-2028) ($MN)
33 Global Propanol Market Outlook, By Infrastructure (2020-2028) ($MN)
34 Global Propanol Market Outlook, By Commercial (2020-2028) ($MN)
35 Global Propanol Market Outlook, By Personal Care (2020-2028) ($MN)
36 Global Propanol Market Outlook, By Creams (2020-2028) ($MN)
37 Global Propanol Market Outlook, By Sanitizers (2020-2028) ($MN)
38 Global Propanol Market Outlook, By Soaps (2020-2028) ($MN)
39 Global Propanol Market Outlook, By Automotive (2020-2028) ($MN)
40 Global Propanol Market Outlook, By Heavy Commercial Vehicle (2020-2028) ($MN)
41 Global Propanol Market Outlook, By Commercial Vehicle (2020-2028) ($MN)
42 Global Propanol Market Outlook, By Passenger Cars (2020-2028) ($MN)
43 Global Propanol Market Outlook, By Agriculture (2020-2028) ($MN)
44 Global Propanol Market Outlook, By Food and Beverage (2020-2028) ($MN)
45 Global Propanol Market Outlook, By Pharmaceuticals (2020-2028) ($MN)
46 Global Propanol Market Outlook, By Other End Users (2020-2028) ($MN)
Note: Tables for North America, Europe, APAC, South America, and Middle East & Africa Regions are also represented in the same manner as above.
List of Figures
RESEARCH METHODOLOGY

We at ‘Stratistics’ opt for an extensive research approach which involves data mining, data validation, and data analysis. The various research sources include in-house repository, secondary research, competitor’s sources, social media research, client internal data, and primary research.
Our team of analysts prefers the most reliable and authenticated data sources in order to perform the comprehensive literature search. With access to most of the authenticated data bases our team highly considers the best mix of information through various sources to obtain extensive and accurate analysis.
Each report takes an average time of a month and a team of 4 industry analysts. The time may vary depending on the scope and data availability of the desired market report. The various parameters used in the market assessment are standardized in order to enhance the data accuracy.
Data Mining
The data is collected from several authenticated, reliable, paid and unpaid sources and is filtered depending on the scope & objective of the research. Our reports repository acts as an added advantage in this procedure. Data gathering from the raw material suppliers, distributors and the manufacturers is performed on a regular basis, this helps in the comprehensive understanding of the products value chain. Apart from the above mentioned sources the data is also collected from the industry consultants to ensure the objective of the study is in the right direction.
Market trends such as technological advancements, regulatory affairs, market dynamics (Drivers, Restraints, Opportunities and Challenges) are obtained from scientific journals, market related national & international associations and organizations.
Data Analysis
From the data that is collected depending on the scope & objective of the research the data is subjected for the analysis. The critical steps that we follow for the data analysis include:
- Product Lifecycle Analysis
- Competitor analysis
- Risk analysis
- Porters Analysis
- PESTEL Analysis
- SWOT Analysis
The data engineering is performed by the core industry experts considering both the Marketing Mix Modeling and the Demand Forecasting. The marketing mix modeling makes use of multiple-regression techniques to predict the optimal mix of marketing variables. Regression factor is based on a number of variables and how they relate to an outcome such as sales or profits.
Data Validation
The data validation is performed by the exhaustive primary research from the expert interviews. This includes telephonic interviews, focus groups, face to face interviews, and questionnaires to validate our research from all aspects. The industry experts we approach come from the leading firms, involved in the supply chain ranging from the suppliers, distributors to the manufacturers and consumers so as to ensure an unbiased analysis.
We are in touch with more than 15,000 industry experts with the right mix of consultants, CEO's, presidents, vice presidents, managers, experts from both supply side and demand side, executives and so on.
The data validation involves the primary research from the industry experts belonging to:
- Leading Companies
- Suppliers & Distributors
- Manufacturers
- Consumers
- Industry/Strategic Consultants
Apart from the data validation the primary research also helps in performing the fill gap research, i.e. providing solutions for the unmet needs of the research which helps in enhancing the reports quality.
For more details about research methodology, kindly write to us at info@strategymrc.com
Frequently Asked Questions
In case of any queries regarding this report, you can contact the customer service by filing the “Inquiry Before Buy” form available on the right hand side. You may also contact us through email: info@strategymrc.com or phone: +1-301-202-5929
Yes, the samples are available for all the published reports. You can request them by filling the “Request Sample” option available in this page.
Yes, you can request a sample with your specific requirements. All the customized samples will be provided as per the requirement with the real data masked.
All our reports are available in Digital PDF format. In case if you require them in any other formats, such as PPT, Excel etc you can submit a request through “Inquiry Before Buy” form available on the right hand side. You may also contact us through email: info@strategymrc.com or phone: +1-301-202-5929
We offer a free 15% customization with every purchase. This requirement can be fulfilled for both pre and post sale. You may send your customization requirements through email at info@strategymrc.com or call us on +1-301-202-5929.
We have 3 different licensing options available in electronic format.
- Single User Licence: Allows one person, typically the buyer, to have access to the ordered product. The ordered product cannot be distributed to anyone else.
- 2-5 User Licence: Allows the ordered product to be shared among a maximum of 5 people within your organisation.
- Corporate License: Allows the product to be shared among all employees of your organisation regardless of their geographical location.
All our reports are typically be emailed to you as an attachment.
To order any available report you need to register on our website. The payment can be made either through CCAvenue or PayPal payments gateways which accept all international cards.
We extend our support to 6 months post sale. A post sale customization is also provided to cover your unmet needs in the report.
Request Customization
We offer complimentary customization of up to 15% with every purchase. To share your customization requirements, feel free to email us at info@strategymrc.com or call us on +1-301-202-5929. .
Please Note: Customization within the 15% threshold is entirely free of charge. If your request exceeds this limit, we will conduct a feasibility assessment. Following that, a detailed quote and timeline will be provided.
WHY CHOOSE US ?

Assured Quality
Best in class reports with high standard of research integrity

24X7 Research Support
Continuous support to ensure the best customer experience.

Free Customization
Adding more values to your product of interest.

Safe & Secure Access
Providing a secured environment for all online transactions.

Trusted by 600+ Brands
Serving the most reputed brands across the world.