
Protein Bar Market
Protein Bar Market Forecasts to 2028 - Global Analysis By Source (Animal-Based and Plant-Based), Type (Meal Replacement Bars, Sports Nutrition Bars and Other Types), Distribution Channel (Convenience Stores, Mass Merchandisers and Cooling and Other Distribution Channels), Product (Low Protein (0-15 grams), Medium Protein (16-25 grams) and High Protein (Above 25 grams)), Category, Application and By Geography

|
Years Covered |
2020-2028 |
|
Estimated Year Value (2022) |
US $4.90 BN |
|
Projected Year Value (2028) |
US $7.83 BN |
|
CAGR (2022 - 2028) |
8.1% |
|
Regions Covered |
North America, Europe, Asia Pacific, South America, and Middle East & Africa |
|
Countries Covered |
US, Canada, Mexico, Germany, UK, Italy, France, Spain, Japan, China, India, Australia, New Zealand, South Korea, Rest of Asia Pacific, South America, Argentina, Brazil, Chile, Middle East & Africa, Saudi Arabia, UAE, Qatar, and South Africa |
|
Largest Market |
Asia Pacific |
|
Highest Growing Market |
North America |
According to Stratistics MRC, the Global Protein Bar Market is accounted for $4.90 billion in 2022 and is expected to reach $7.83 billion by 2028 growing at a CAGR of 8.1% during the forecast period. Protein/nutrition bars are healthy dietary items that give the body the extra protein it needs. The market for these products is rising as consumers' preferences for ready-to-eat (RTE), meal-replacing, and packaged foods expand. A major driving force behind the rising demand for these bars in the international market is the growing understanding of the advantages of health and nutrition bars, including how they can help to build and repair tissue, lower blood pressure, help people lose weight, and other benefits. Consumption of bars as a convenient and healthful snack has increased as a result of consumers' busier lifestyles.
According to Maeil Business Newspaper, in South Korea, the market for protein products including protein bars was expected to be worth KRW 336.4 billion in 2021.
Market Dynamics:
Driver:
Rising inclination toward fitness and protein diet
A recently developed food category called a protein bar has been widely used as a dietary supplement. Because its main constituent, proteins, has the capacity to help develop muscle, this simple ready-to-eat protein source is becoming more and more popular among fitness-conscious organisations. It is regarded as a suitable post-workout snack for athletes, persons active in sports, and those doing heavy-duty jobs that necessitate vigorous physical exercise. For weightlifters and athletes, consuming protein is essential to sustaining energy levels and improving performance. Therefore, it is anticipated that increased global adoption of fitness activities will boost product demand.
Restraint:
Availability of alternative products and high sugar content
Protein supplements come in a wide range of substitute items that are easily accessible on the market, including protein bars, protein powders, and protein shakes and beverages with added protein. Market expansion is anticipated to be hampered by the availability of competing goods like multivitamin bars and other snack bars that offer essential nutrition. The market for the product is also anticipated to be constrained by public awareness of the harmful health effects of artificial sweeteners and hydrogenated fats in the product.
Opportunity:
Increasing trend of on-the-go breakfast/meal items
The need for nutritious meal options is becoming more pressing as people's lifestyles change, travel distances increase, and work schedules become busier. At the same time, the market for convenience foods is expanding quickly. Because they are portable and work as an instant energy boost, nutritious bars are a viable replacement for meals because they help regulate hunger. In the 'Food & Health Survey', which was done by the International Food Information Council (IFIC) Foundation, 10% of the American population indicated that they preferred protein for energy. As a result, the demand for protein-rich bars is anticipated to increase in the near future due to the high demand for healthy foods caused by the growth in the number of health clubs.
Threat:
Strict rules and regulation
The market for protein supplements is predicted to grow in the next years as a result of factors including the rising middle-class population and the penetration of organised retail. However, the Therapeutic Goods Administration in Australia has advocated for the reclassification of supplements as therapeutic goods or medications. This development is predicted to hinder the nation's current economic expansion, which is predicted to have a negative impact on the expansion of the regional market.
Covid-19 Impact
Bars are a go-to for quick and portable eating. When the coronavirus (COVID-19) pandemic limited activities and forced many people to stay at home in 2020, sales of nutrition bars and a variety of other nutrition bars dropped precipitously. Furthermore, the COVID-19 epidemic forced the suspension or cancellation of the majority of sporting events around the world. Due to lockdown, the bulk of health clubs and fitness centres were also closed. However, during such an outbreak, the growing consumer preference for food products that improve immunity is anticipated to increase demand for wholesome & energy-efficient snack foods. The expanding trend of goods with specialised health benefits has been driven by the increased concern for health and wellbeing.
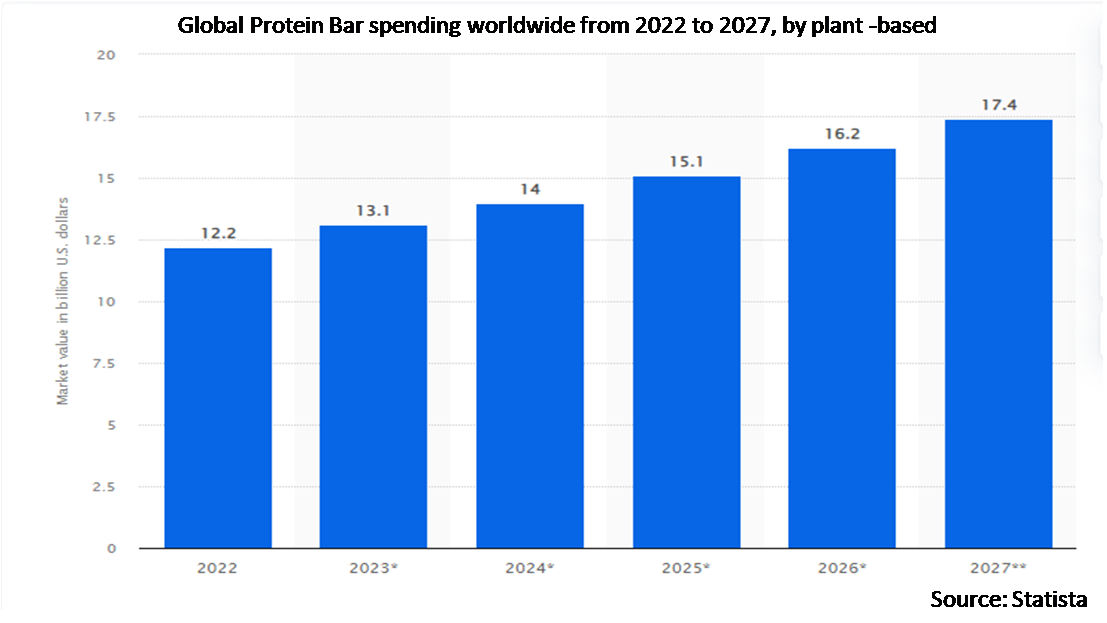
The plant-based segment is expected to be the largest during the forecast period
The plant-based segment is estimated to have a lucrative growth, as they are prepared from a variety of healthy natural nutrients, including fruit, nut butter, seeds, and others, that assist the body fight off numerous ailments. As more individuals switch to eating a plant-based diet in order to lead healthier lifestyles, the prevalence of vegetarianism around the world contributes to the product's rising demand.
The online channels segment is expected to have the highest CAGR during the forecast period
The online channels segment is anticipated to witness the highest CAGR growth during the forecast period, due to the vast number of well-known companies offering food supplements online through stores. Bar sales will continue to benefit from the e-commerce trend, which includes buying in multipacks rather than singles and the growth and development of direct-to-consumer partnerships. Additionally, enticing web marketing and deals on premium protein bars are luring customers to purchase those goods.
Region with highest share:
Asia Pacific is projected to hold the largest market share during the forecast period owing to the expanding infrastructure facilities for various conventions and brick-and-mortar establishments that have aided the market expansion in developing nations. The demand for protein bars will increase, which will have an effect on regional growth overall as protein intake becomes more well known in areas like China and India. In recent years, as Chinese consumers' awareness of healthy living has increased as a result of the epidemic, the high protein concept has served as an excellent example of the huge potential of healthy bars.
Region with highest CAGR:
North America is projected to have the highest CAGR over the forecast period, owing to the growing number of fitness aficionados and the expansion of health clubs, gyms, and fitness training facilities across North America. The American population is concentrating on improving their health, and a diet high in protein is one of the possible strategies to do this. The region's customs of between-meal snacking are thought to be responsible for the emergence of protein-enriched snacks.

Key players in the market
Some of the key players profiled in the Protein Bar Market include The Kellogg Company, Mondelez International, General Mills Inc., Amway Corp., The Simply Good Foods Company, The Bountiful Company, GNC Holdings Inc., Glanbia Plc., Clif Bar & Company, POST HOLDINGS INC., Mars, Incorporated, Tom Oliver Nutrition, Abbott, The Balance Bar Company, Caveman Foods LLC.
Key Developments:
In June 2022, Kellogg's Special K launched a range of new protein snack bars. The products contain 6 grams of protein and 90 calories per bar. The products were initially available in two flavors including sweet berry vanilla and chocolatey brownie sundae.
In June 2021, RXBAR launched a plant-based protein bar. The all-new RXBAR protein bar is made with 10 grams of plant-based protein in place of RXBAR's signature egg whites and is available on RXBAR.com and on shelves at several retailers including Target and Kroger.
In June 2021, RXBAR, a Kellogg subsidiary, launched its first plant-based product. RXBAR Plant contains 10 grams of protein and substitutes pea and almond protein for the brand’s distinctive egg white protein.
Sources Covered:
• Animal-Based
• Plant-Based
Types Covered:
• Meal Replacement Bars
• Sports Nutrition Bars
• Women's Protein Bar
• Low-Carb Protein Bar
• Energy Protein Bar
• Other Types
Distribution Channels Covered:
• Convenience Stores
• Mass Merchandisers
• Online Channels
• Specialty Stores
• Supermarkets /Hypermarkets
• Other Distribution Channels
Products Covered:
• Low Protein (0-15 grams)
• Medium Protein (16-25 grams)
• High Protein (Above 25 grams)
Categories Covered:
• Vegan
• Multi-Claim
• Gluten-Free
• Organic
• Other Categories
Applications Covered:
• Bodybuilders
• Pro/Amateur Athletes
• Other Applications
Regions Covered:
• North America
o US
o Canada
o Mexico
• Europe
o Germany
o UK
o Italy
o France
o Spain
o Rest of Europe
• Asia Pacific
o Japan
o China
o India
o Australia
o New Zealand
o South Korea
o Rest of Asia Pacific
• South America
o Argentina
o Brazil
o Chile
o Rest of South America
• Middle East & Africa
o Saudi Arabia
o UAE
o Qatar
o South Africa
o Rest of Middle East & Africa
What our report offers:
- Market share assessments for the regional and country-level segments
- Strategic recommendations for the new entrants
- Covers Market data for the years 2020, 2021, 2022, 2025, and 2028
- Market Trends (Drivers, Constraints, Opportunities, Threats, Challenges, Investment Opportunities, and recommendations)
- Strategic recommendations in key business segments based on the market estimations
- Competitive landscaping mapping the key common trends
- Company profiling with detailed strategies, financials, and recent developments
- Supply chain trends mapping the latest technological advancements
Free Customization Offerings:
All the customers of this report will be entitled to receive one of the following free customization options:
• Company Profiling
o Comprehensive profiling of additional market players (up to 3)
o SWOT Analysis of key players (up to 3)
• Regional Segmentation
o Market estimations, Forecasts and CAGR of any prominent country as per the client's interest (Note: Depends on feasibility check)
• Competitive Benchmarking
o Benchmarking of key players based on product portfolio, geographical presence, and strategic alliances
Table of Contents
1 Executive Summary
2 Preface
2.1 Abstract
2.2 Stake Holders
2.3 Research Scope
2.4 Research Methodology
2.4.1 Data Mining
2.4.2 Data Analysis
2.4.3 Data Validation
2.4.4 Research Approach
2.5 Research Sources
2.5.1 Primary Research Sources
2.5.2 Secondary Research Sources
2.5.3 Assumptions
3 Market Trend Analysis
3.1 Introduction
3.2 Drivers
3.3 Restraints
3.4 Opportunities
3.5 Threats
3.6 Product Analysis
3.7 Application Analysis
3.8 Emerging Markets
3.9 Impact of Covid-19
4 Porters Five Force Analysis
4.1 Bargaining power of suppliers
4.2 Bargaining power of buyers
4.3 Threat of substitutes
4.4 Threat of new entrants
4.5 Competitive rivalry
5 Global Protein Bar Market, By Source
5.1 Introduction
5.2 Animal-Based
5.3 Plant-Based
6 Global Protein Bar Market, By Type
6.1 Introduction
6.2 Meal Replacement Bars
6.3 Sports Nutrition Bars
6.4 Women's Protein Bar
6.5 Low-Carb Protein Bar
6.6 Energy Protein Bar
6.7 Other Types
7 Global Protein Bar Market, By Distribution Channel
7.1 Introduction
7.2 Convenience Stores
7.3 Mass Merchandisers
7.4 Online Channels
7.5 Specialty Stores
7.6 Supermarkets /Hypermarkets
7.7 Other Distribution Channels
8 Global Protein Bar Market, By Product
8.1 Introduction
8.2 Low Protein (0-15 grams)
8.3 Medium Protein (16-25 grams)
8.4 High Protein (Above 25 grams)
9 Global Protein Bar Market, By Category
9.1 Introduction
9.2 Vegan
9.3 Multi-Claim
9.4 Gluten-Free
9.5 Organic
9.6 Other Categories
10 Global Protein Bar Market, By Application
10.1 Introduction
10.2 Bodybuilders
10.3 Pro/Amateur Athletes
10.4 Other Applications
11 Global Protein Bar Market, By Geography
11.1 Introduction
11.2 North America
11.2.1 US
11.2.2 Canada
11.2.3 Mexico
11.3 Europe
11.3.1 Germany
11.3.2 UK
11.3.3 Italy
11.3.4 France
11.3.5 Spain
11.3.6 Rest of Europe
11.4 Asia Pacific
11.4.1 Japan
11.4.2 China
11.4.3 India
11.4.4 Australia
11.4.5 New Zealand
11.4.6 South Korea
11.4.7 Rest of Asia Pacific
11.5 South America
11.5.1 Argentina
11.5.2 Brazil
11.5.3 Chile
11.5.4 Rest of South America
11.6 Middle East & Africa
11.6.1 Saudi Arabia
11.6.2 UAE
11.6.3 Qatar
11.6.4 South Africa
11.6.5 Rest of Middle East & Africa
12 Key Developments
12.1 Agreements, Partnerships, Collaborations and Joint Ventures
12.2 Acquisitions & Mergers
12.3 New Product Launch
12.4 Expansions
12.5 Other Key Strategies
13 Company Profiling
13.1 The Kellogg Company
13.2 Mondelez International
13.3 General Mills Inc.
13.4 Amway Corp.
13.5 The Simply Good Foods Company
13.6 The Bountiful Company
13.7 GNC Holdings Inc.
13.8 Glanbia Plc.
13.9 Clif Bar & Company
13.10 POST HOLDINGS INC.
13.11 Mars, Incorporated
13.12 Tom Oliver Nutrition
13.13 Abbott
13.14 The Balance Bar Company
13.15 Caveman Foods LLC
List of Tables
1 Global Protein Bar Market Outlook, By Region (2020-2028) ($MN)
2 Global Protein Bar Market Outlook, By Source (2020-2028) ($MN)
3 Global Protein Bar Market Outlook, By Animal-Based (2020-2028) ($MN)
4 Global Protein Bar Market Outlook, By Plant-Based (2020-2028) ($MN)
5 Global Protein Bar Market Outlook, By Type (2020-2028) ($MN)
6 Global Protein Bar Market Outlook, By Meal Replacement Bars (2020-2028) ($MN)
7 Global Protein Bar Market Outlook, By Sports Nutrition Bars (2020-2028) ($MN)
8 Global Protein Bar Market Outlook, By Women's Protein Bar (2020-2028) ($MN)
9 Global Protein Bar Market Outlook, By Low-Carb Protein Bar (2020-2028) ($MN)
10 Global Protein Bar Market Outlook, By Energy Protein Bar (2020-2028) ($MN)
11 Global Protein Bar Market Outlook, By Other Types (2020-2028) ($MN)
12 Global Protein Bar Market Outlook, By Distribution Channel (2020-2028) ($MN)
13 Global Protein Bar Market Outlook, By Convenience Stores (2020-2028) ($MN)
14 Global Protein Bar Market Outlook, By Mass Merchandisers (2020-2028) ($MN)
15 Global Protein Bar Market Outlook, By Online Channels (2020-2028) ($MN)
16 Global Protein Bar Market Outlook, By Specialty Stores (2020-2028) ($MN)
17 Global Protein Bar Market Outlook, By Supermarkets /Hypermarkets (2020-2028) ($MN)
18 Global Protein Bar Market Outlook, By Other Distribution Channels (2020-2028) ($MN)
19 Global Protein Bar Market Outlook, By Product (2020-2028) ($MN)
20 Global Protein Bar Market Outlook, By Low Protein (0-15 grams) (2020-2028) ($MN)
21 Global Protein Bar Market Outlook, By Medium Protein (16-25 grams) (2020-2028) ($MN)
22 Global Protein Bar Market Outlook, By High Protein (Above 25 grams) (2020-2028) ($MN)
23 Global Protein Bar Market Outlook, By Category (2020-2028) ($MN)
24 Global Protein Bar Market Outlook, By Vegan (2020-2028) ($MN)
25 Global Protein Bar Market Outlook, By Multi-Claim (2020-2028) ($MN)
26 Global Protein Bar Market Outlook, By Gluten-Free (2020-2028) ($MN)
27 Global Protein Bar Market Outlook, By Organic (2020-2028) ($MN)
28 Global Protein Bar Market Outlook, By Other Categories (2020-2028) ($MN)
29 Global Protein Bar Market Outlook, By Application (2020-2028) ($MN)
30 Global Protein Bar Market Outlook, By Bodybuilders (2020-2028) ($MN)
31 Global Protein Bar Market Outlook, By Pro/Amateur Athletes (2020-2028) ($MN)
32 Global Protein Bar Market Outlook, By Other Applications (2020-2028) ($MN)
Note: Tables for North America, Europe, APAC, South America, and Middle East & Africa Regions are also represented in the same manner as above.
List of Figures
RESEARCH METHODOLOGY

We at ‘Stratistics’ opt for an extensive research approach which involves data mining, data validation, and data analysis. The various research sources include in-house repository, secondary research, competitor’s sources, social media research, client internal data, and primary research.
Our team of analysts prefers the most reliable and authenticated data sources in order to perform the comprehensive literature search. With access to most of the authenticated data bases our team highly considers the best mix of information through various sources to obtain extensive and accurate analysis.
Each report takes an average time of a month and a team of 4 industry analysts. The time may vary depending on the scope and data availability of the desired market report. The various parameters used in the market assessment are standardized in order to enhance the data accuracy.
Data Mining
The data is collected from several authenticated, reliable, paid and unpaid sources and is filtered depending on the scope & objective of the research. Our reports repository acts as an added advantage in this procedure. Data gathering from the raw material suppliers, distributors and the manufacturers is performed on a regular basis, this helps in the comprehensive understanding of the products value chain. Apart from the above mentioned sources the data is also collected from the industry consultants to ensure the objective of the study is in the right direction.
Market trends such as technological advancements, regulatory affairs, market dynamics (Drivers, Restraints, Opportunities and Challenges) are obtained from scientific journals, market related national & international associations and organizations.
Data Analysis
From the data that is collected depending on the scope & objective of the research the data is subjected for the analysis. The critical steps that we follow for the data analysis include:
- Product Lifecycle Analysis
- Competitor analysis
- Risk analysis
- Porters Analysis
- PESTEL Analysis
- SWOT Analysis
The data engineering is performed by the core industry experts considering both the Marketing Mix Modeling and the Demand Forecasting. The marketing mix modeling makes use of multiple-regression techniques to predict the optimal mix of marketing variables. Regression factor is based on a number of variables and how they relate to an outcome such as sales or profits.
Data Validation
The data validation is performed by the exhaustive primary research from the expert interviews. This includes telephonic interviews, focus groups, face to face interviews, and questionnaires to validate our research from all aspects. The industry experts we approach come from the leading firms, involved in the supply chain ranging from the suppliers, distributors to the manufacturers and consumers so as to ensure an unbiased analysis.
We are in touch with more than 15,000 industry experts with the right mix of consultants, CEO's, presidents, vice presidents, managers, experts from both supply side and demand side, executives and so on.
The data validation involves the primary research from the industry experts belonging to:
- Leading Companies
- Suppliers & Distributors
- Manufacturers
- Consumers
- Industry/Strategic Consultants
Apart from the data validation the primary research also helps in performing the fill gap research, i.e. providing solutions for the unmet needs of the research which helps in enhancing the reports quality.
For more details about research methodology, kindly write to us at info@strategymrc.com
Frequently Asked Questions
In case of any queries regarding this report, you can contact the customer service by filing the “Inquiry Before Buy” form available on the right hand side. You may also contact us through email: info@strategymrc.com or phone: +1-301-202-5929
Yes, the samples are available for all the published reports. You can request them by filling the “Request Sample” option available in this page.
Yes, you can request a sample with your specific requirements. All the customized samples will be provided as per the requirement with the real data masked.
All our reports are available in Digital PDF format. In case if you require them in any other formats, such as PPT, Excel etc you can submit a request through “Inquiry Before Buy” form available on the right hand side. You may also contact us through email: info@strategymrc.com or phone: +1-301-202-5929
We offer a free 15% customization with every purchase. This requirement can be fulfilled for both pre and post sale. You may send your customization requirements through email at info@strategymrc.com or call us on +1-301-202-5929.
We have 3 different licensing options available in electronic format.
- Single User Licence: Allows one person, typically the buyer, to have access to the ordered product. The ordered product cannot be distributed to anyone else.
- 2-5 User Licence: Allows the ordered product to be shared among a maximum of 5 people within your organisation.
- Corporate License: Allows the product to be shared among all employees of your organisation regardless of their geographical location.
All our reports are typically be emailed to you as an attachment.
To order any available report you need to register on our website. The payment can be made either through CCAvenue or PayPal payments gateways which accept all international cards.
We extend our support to 6 months post sale. A post sale customization is also provided to cover your unmet needs in the report.
Request Customization
We offer complimentary customization of up to 15% with every purchase. To share your customization requirements, feel free to email us at info@strategymrc.com or call us on +1-301-202-5929. .
Please Note: Customization within the 15% threshold is entirely free of charge. If your request exceeds this limit, we will conduct a feasibility assessment. Following that, a detailed quote and timeline will be provided.
WHY CHOOSE US ?

Assured Quality
Best in class reports with high standard of research integrity

24X7 Research Support
Continuous support to ensure the best customer experience.

Free Customization
Adding more values to your product of interest.

Safe & Secure Access
Providing a secured environment for all online transactions.

Trusted by 600+ Brands
Serving the most reputed brands across the world.