
Protonic Ceramic Fuel Cell Market
Protonic Ceramic Fuel Cell Market Forecasts to 2028 - Global Analysis By Type (Proton-Exchange, Membrane Fuel Cells (PEMFC), Solid Oxide Fuel Cells (SOFCs), Phosphoric Acid Fuel Cell (PAFC)), Application (Transportation, Off- Grid- Power) and By Geography

|
Years Covered |
2020-2028 |
|
Estimated Year Value (2022) |
US $61.56 MN |
|
Projected Year Value (2028) |
US $331.64 MN |
|
CAGR (2022 - 2028) |
32.4% |
|
Regions Covered |
North America, Europe, Asia Pacific, South America, and Middle East & Africa |
|
Countries Covered |
US, Canada, Mexico, Germany, UK, Italy, France, Spain, Japan, China, India, Australia, New Zealand, South Korea, Rest of Asia Pacific, South America, Argentina, Brazil, Chile, Middle East & Africa, Saudi Arabia, UAE, Qatar, and South Africa |
|
Largest Market |
Europe |
|
Fastest Growing Market |
Asia Pacific |
According to Stratistics MRC, the Global Protonic Ceramic Fuel Cell Market is accounted for $61.56 million in 2022 and is expected to reach $331.64 million by 2028 growing at a CAGR of 32.4% during the forecast period. A protonic ceramic fuel cell or PCFC is a fuel cell based around a ceramic, solid, electrolyte material as the proton conductor from anode to cathode. These fuel cells produce electricity by removing an electron from a hydrogen atom, pushing the charged hydrogen atom through the ceramic membrane, and returning the electron to the hydrogen on the other side of the ceramic membrane during a reaction with oxygen.
The U.S. Department of Energy funded a USD 200,000 thousand protonic ceramic fuel cell project for FuelCell Energy. The project mainly focuses on developing protonic ceramic membranes with unprecedented electrochemical efficiency, majorly for electrochemical application. In April 2022, Doosan Fuel Cell, a U.S. fuel cell manufacturing company, teamed up with Ballard Power Systems, which is a Canadian manufacturer of PEMFC, to develop a PEMFC fuel cell system for hydrogen mobility.
Market Dynamics:
Driver:
Elasticity of protonic ceramic fuel cell
It can create clean and effective energy to power numerous applications. Fuel cells use the chemical energy of hydrogen or other fuels to produce electricity cleanly and efficiently, driving their acceptance as a clean energy source. It usually function in an in-between temperature range between 400–800⁰C, giving them the advantage of higher mobility and lower activation energy of protons. The operation at the intermediate level results in fuel flexibility. Further, their operation on uncomplicated hydrocarbons is often preferred as the access to their widespread use with hydrogen as fuel. Additionally, the PCs can also be used in different fuel sources, which act as one of the critical parameters for the improved performance of protonic ceramic based fuel cell.
Restraint:
High initial investment costs and availability of other fuel cell systems
Other fuel cell types are accessible such as proton membrane fuel cell, phosphoric acid fuel cell, direct methanol fuel cell, and others. These fuel cells are more commercially available and have extensive acceptance in numerous applications than protonic ceramic fuel cells, which is one of the main factors hampering the market growth. Furthermore, there is increasing demand for other electric vehicles, including battery electric vehicles and plug-in hybrid electric vehicles. They have numerous advantages, such as higher efficiency, no polluting by-products, cost efficiency, and energy security, which are predictable to reduce fuel cell acceptance and hamper product demand.
Opportunity:
Rising research & development activities to improve product capability
Carbon emission is contributing to climate change, reflecting severe concerns for humans and the environment. Burning fossil fuels releases carbon dioxide and other greenhouse gases leading to many problems such as ocean acidification, global warming, and other severe issues. This has resulted in numerous government entities and organizations across the globe to develop efficient energy technologies to diminish carbon footprints and curb other harmful emissions, further enhancing the market landscape. CoorsTek, one of the leading global engineered ceramics manufacturers, collaborated with international research associates. The company succeeded in applying the technology of ceramic membrane to develop a robust hydrogen generator, which produces hydrogen from electricity and fuels with almost no energy loss. The company's recent development has reflected on a higher efficiency of protonic membranes to produce hydrogen using fuels, such as ammonia, natural gas, and biogas, compared to other fuel types, further acting as one of the significant factors driving the growth for the market.
Threat:
Regulatory problems & raw materials cost
There are also limitations around regulatory problems regarding the structure that represents commercial deployment models. Without explicit regulatory frameworks to permit commercial projects to realize their cost and revenue basis, commercial projects can struggle to attain a financial investment decision (FID). Precious metals such as iridium and platinum are typically needed as catalysts in fuel cells and some water electrolyzer types, suggesting that the initial cost of fuel cells (and electrolyzers) can be expensive. This high cost has prevented some from investing in hydrogen fuel cell technology. Such costs require to be reduced to make hydrogen fuel cells a viable fuel source for all.
Impact of Covid- 19
Due to the coronavirus pandemic outbreak and unprecedented turbulence in the energy market owing to a significant drop in mobility, shutting down industries, reduced road transportation, and other disruptions. Besides, travel restrictions and lockdown rules also resulted in skilled labor's unavailability. However, despite the unprecedented crisis, long-term climate and environmental challenges remain primary threats to our planet and humanity, resulting in continued development of various hydrogen production technologies.
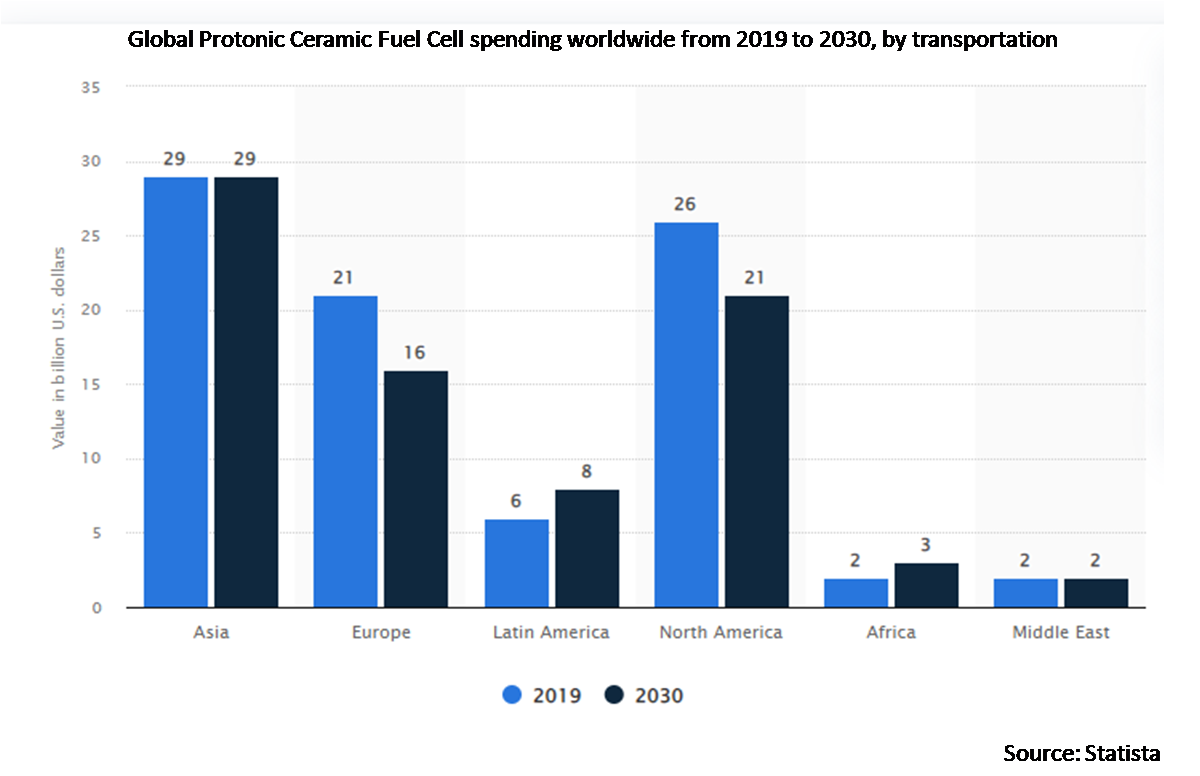
The Transportation segment is expected to be the largest during the forecast period
The Transportation segment is expected to be the largest during the forecast period, the demand for PCFCs in the transportation sector is likely to be stimulated as an different transportation system that overcomes the challenges of inefficiencies in fuel transport and storage. Moreover, with an upsurge in advancement/development of the protonic ceramic based fuel cell from renewable resources to increase fuel diversity in the transportation sector cost-effectively and efficiently.
The Proton-Exchange Membrane Fuel Cells (PEMFC) segment is expected to have the highest CAGR during the forecast period
The Proton-Exchange Membrane Fuel Cells (PEMFC) segment is expected to have the highest CAGR during the forecast period, owing to increasing demand for PEMFC in portable, stationary, and automotive applications. PEMFC provides less maintenance time, improved reliability, and high operational efficiency. It operates at a low temperature and pure hydrogen. This fuel cell is really useful for material handling and lightweight vehicles. The technology for a consistent supply of high-purity hydrogen, as well as the associated infrastructure, is critical for the success of PEMFC in a variety of application fields.
Region with highest share:
Europe is projected to hold the largest market share during the forecast period, owing to clean power generation technologies, robust investments in low carbon distributed generation and greenhouse gas reduction targets by the countries operating across the province. European Commission, a unique economic and political union between 27 European countries, has been working on projects for developing protonic ceramic based fuel cells for better performance characteristics that is projected to improve the market landscape across the province.
Region with highest CAGR:
Asia Pacific is projected to have the highest CAGR over the forecast period owing to favourable government regulations in nations like China, Japan, and South Korea, the Asia-Pacific area is one of the most potential regional markets. The PEMFC is the most extensively used fuel cell technology in the province among the existing fuel cell technologies. China's fuel cell business has a lot of promise, as the government is increasingly focusing on methods to use sustainable energy technologies to transition to a low-carbon economy. Additionally, the hydrogen fuel cell industry in the country has been gaining steam as a result of favourable national and provincial government subsidies as well as local government incentive programs to encourage the use of hydrogen vehicles to reduce pollution. The National Institute of Advanced Industrial Science and Technology (AIST) projects are likely to add to the PCFC market size across the province.

Key players in the market
Some of the key players profiled in the Protonic Ceramic Fuel Cell Market include Ballard, Toshiba, PLUG Power, FuelCell Energy, Bosch, Doosan Fuel Cell, Horizon, Intelligent Energy, Hyster-Yale Group, Nedstack, Pearl Hydrogen, Sunrise Power.
Key Developments:
In May 2021: Solid Power successfully tested the Solid Power large stack module for high-efficiency hydrogen generation. The system is integrated with four new generation stacks for 25 kWel in Solid Oxide Fuel Cell (SOFC) model or 75 kWDC in Solid Oxide Electrolysis (SOE) mode.
In May 2022: Bosch will invest USD 591 million to develop elements for hydrogen electrolysis to speed-up the adoption of inexperienced hydrogen to be used in transport and different sectors. The company is likely to start the production by 2025.
Types Covered:
• Proton-Exchange Membrane Fuel Cells (PEMFC)
• Solid Oxide Fuel Cells (SOFCs)
• Phosphoric Acid Fuel Cell (PAFC)
• Molten Carbonate Fuel Cell (MCFC)
• Direct Methanol Fuel Cell (DMFC)
• Alkaline Fuel Cell (AFC)
Applications Covered:
• Transportation
• Off- Grid- Power
• Stationary
• Portable
Regions Covered:
• North America
o US
o Canada
o Mexico
• Europe
o Germany
o UK
o Italy
o France
o Spain
o Rest of Europe
• Asia Pacific
o Japan
o China
o India
o Australia
o New Zealand
o South Korea
o Rest of Asia Pacific
• South America
o Argentina
o Brazil
o Chile
o Rest of South America
• Middle East & Africa
o Saudi Arabia
o UAE
o Qatar
o South Africa
o Rest of Middle East & Africa
What our report offers:
- Market share assessments for the regional and country-level segments
- Strategic recommendations for the new entrants
- Covers Market data for the years 2020, 2021, 2022, 2025 and 2028
- Market Trends (Drivers, Constraints, Opportunities, Threats, Challenges, Investment Opportunities, and recommendations)
- Strategic recommendations in key business segments based on the market estimations
- Competitive landscaping mapping the key common trends
- Company profiling with detailed strategies, financials, and recent developments
- Supply chain trends mapping the latest technological advancements
Free Customization Offerings:
All the customers of this report will be entitled to receive one of the following free customization options:
• Company Profiling
o Comprehensive profiling of additional market players (up to 3)
o SWOT Analysis of key players (up to 3)
• Regional Segmentation
o Market estimations, Forecasts and CAGR of any prominent country as per the client's interest (Note: Depends on feasibility check)
• Competitive Benchmarking
o Benchmarking of key players based on product portfolio, geographical presence, and strategic alliances
Table of Contents
1 Executive Summary
2 Preface
2.1 Abstract
2.2 Stake Holders
2.3 Research Scope
2.4 Research Methodology
2.4.1 Data Mining
2.4.2 Data Analysis
2.4.3 Data Validation
2.4.4 Research Approach
2.5 Research Sources
2.5.1 Primary Research Sources
2.5.2 Secondary Research Sources
2.5.3 Assumptions
3 Market Trend Analysis
3.1 Introduction
3.2 Drivers
3.3 Restraints
3.4 Opportunities
3.5 Threats
3.6 Application Analysis
3.7 Emerging Markets
3.8 Impact of Covid-19
4 Porters Five Force Analysis
4.1 Bargaining power of suppliers
4.2 Bargaining power of buyers
4.3 Threat of substitutes
4.4 Threat of new entrants
4.5 Competitive rivalry
5 Global Protonic Ceramic Fuel Cell Market, By Type
5.1 Introduction
5.2 Proton-Exchange Membrane Fuel Cells (PEMFC)
5.3 Solid Oxide Fuel Cells (SOFCs)
5.4 Phosphoric Acid Fuel Cell (PAFC)
5.5 Molten Carbonate Fuel Cell (MCFC)
5.6 Direct Methanol Fuel Cell (DMFC)
5.7 Alkaline Fuel Cell (AFC)
6 Global Protonic Ceramic Fuel Cell Market, By Application
6.1 Introduction
6.2 Transportation
6.3 Off- Grid- Power
6.4 Stationary
6.5 Portable
7 Global Protonic Ceramic Fuel Cell Market, By Geography
7.1 Introduction
7.2 North America
7.2.1 US
7.2.2 Canada
7.2.3 Mexico
7.3 Europe
7.3.1 Germany
7.3.2 UK
7.3.3 Italy
7.3.4 France
7.3.5 Spain
7.3.6 Rest of Europe
7.4 Asia Pacific
7.4.1 Japan
7.4.2 China
7.4.3 India
7.4.4 Australia
7.4.5 New Zealand
7.4.6 South Korea
7.4.7 Rest of Asia Pacific
7.5 South America
7.5.1 Argentina
7.5.2 Brazil
7.5.3 Chile
7.5.4 Rest of South America
7.6 Middle East & Africa
7.6.1 Saudi Arabia
7.6.2 UAE
7.6.3 Qatar
7.6.4 South Africa
7.6.5 Rest of Middle East & Africa
8 Key Developments
8.1 Agreements, Partnerships, Collaborations and Joint Ventures
8.2 Acquisitions & Mergers
8.3 New Product Launch
8.4 Expansions
8.5 Other Key Strategies
9 Company Profiling
9.1 Ballard
9.2 Toshiba
9.3 PLUG Power
9.4 FuelCell Energy
9.5 Bosch
9.6 Doosan Fuel Cell
9.7 Horizon
9.8 Intelligent Energy
9.9 Hyster-Yale Group
9.10 Nedstack
9.11 Pearl Hydrogen
9.12 Sunrise Power
List of Tables
1 Global Protonic Ceramic Fuel Cell Market Outlook, By Region (2020-2028) ($MN)
2 Global Protonic Ceramic Fuel Cell Market Outlook, By Type (2020-2028) ($MN)
3 Global Protonic Ceramic Fuel Cell Market Outlook, By Proton-Exchange Membrane Fuel Cells (PEMFC) (2020-2028) ($MN)
4 Global Protonic Ceramic Fuel Cell Market Outlook, By Solid Oxide Fuel Cells (SOFCs) (2020-2028) ($MN)
5 Global Protonic Ceramic Fuel Cell Market Outlook, By Phosphoric Acid Fuel Cell (PAFC) (2020-2028) ($MN)
6 Global Protonic Ceramic Fuel Cell Market Outlook, By Molten Carbonate Fuel Cell (MCFC) (2020-2028) ($MN)
7 Global Protonic Ceramic Fuel Cell Market Outlook, By Direct Methanol Fuel Cell (DMFC) (2020-2028) ($MN)
8 Global Protonic Ceramic Fuel Cell Market Outlook, By Alkaline Fuel Cell (AFC) (2020-2028) ($MN)
9 Global Protonic Ceramic Fuel Cell Market Outlook, By Application (2020-2028) ($MN)
10 Global Protonic Ceramic Fuel Cell Market Outlook, By Transportation (2020-2028) ($MN)
11 Global Protonic Ceramic Fuel Cell Market Outlook, By Off- Grid- Power (2020-2028) ($MN)
12 Global Protonic Ceramic Fuel Cell Market Outlook, By Stationary (2020-2028) ($MN)
13 Global Protonic Ceramic Fuel Cell Market Outlook, By Portable (2020-2028) ($MN)
14 North America Protonic Ceramic Fuel Cell Market Outlook, By Country (2020-2028) ($MN)
15 North America Protonic Ceramic Fuel Cell Market Outlook, By Type (2020-2028) ($MN)
16 North America Protonic Ceramic Fuel Cell Market Outlook, By Proton-Exchange Membrane Fuel Cells (PEMFC) (2020-2028) ($MN)
17 North America Protonic Ceramic Fuel Cell Market Outlook, By Solid Oxide Fuel Cells (SOFCs) (2020-2028) ($MN)
18 North America Protonic Ceramic Fuel Cell Market Outlook, By Phosphoric Acid Fuel Cell (PAFC) (2020-2028) ($MN)
19 North America Protonic Ceramic Fuel Cell Market Outlook, By Molten Carbonate Fuel Cell (MCFC) (2020-2028) ($MN)
20 North America Protonic Ceramic Fuel Cell Market Outlook, By Direct Methanol Fuel Cell (DMFC) (2020-2028) ($MN)
21 North America Protonic Ceramic Fuel Cell Market Outlook, By Alkaline Fuel Cell (AFC) (2020-2028) ($MN)
22 North America Protonic Ceramic Fuel Cell Market Outlook, By Application (2020-2028) ($MN)
23 North America Protonic Ceramic Fuel Cell Market Outlook, By Transportation (2020-2028) ($MN)
24 North America Protonic Ceramic Fuel Cell Market Outlook, By Off- Grid- Power (2020-2028) ($MN)
25 North America Protonic Ceramic Fuel Cell Market Outlook, By Stationary (2020-2028) ($MN)
26 North America Protonic Ceramic Fuel Cell Market Outlook, By Portable (2020-2028) ($MN)
27 Europe Protonic Ceramic Fuel Cell Market Outlook, By Country (2020-2028) ($MN)
28 Europe Protonic Ceramic Fuel Cell Market Outlook, By Type (2020-2028) ($MN)
29 Europe Protonic Ceramic Fuel Cell Market Outlook, By Proton-Exchange Membrane Fuel Cells (PEMFC) (2020-2028) ($MN)
30 Europe Protonic Ceramic Fuel Cell Market Outlook, By Solid Oxide Fuel Cells (SOFCs) (2020-2028) ($MN)
31 Europe Protonic Ceramic Fuel Cell Market Outlook, By Phosphoric Acid Fuel Cell (PAFC) (2020-2028) ($MN)
32 Europe Protonic Ceramic Fuel Cell Market Outlook, By Molten Carbonate Fuel Cell (MCFC) (2020-2028) ($MN)
33 Europe Protonic Ceramic Fuel Cell Market Outlook, By Direct Methanol Fuel Cell (DMFC) (2020-2028) ($MN)
34 Europe Protonic Ceramic Fuel Cell Market Outlook, By Alkaline Fuel Cell (AFC) (2020-2028) ($MN)
35 Europe Protonic Ceramic Fuel Cell Market Outlook, By Application (2020-2028) ($MN)
36 Europe Protonic Ceramic Fuel Cell Market Outlook, By Transportation (2020-2028) ($MN)
37 Europe Protonic Ceramic Fuel Cell Market Outlook, By Off- Grid- Power (2020-2028) ($MN)
38 Europe Protonic Ceramic Fuel Cell Market Outlook, By Stationary (2020-2028) ($MN)
39 Europe Protonic Ceramic Fuel Cell Market Outlook, By Portable (2020-2028) ($MN)
40 Asia Pacific Protonic Ceramic Fuel Cell Market Outlook, By Country (2020-2028) ($MN)
41 Asia Pacific Protonic Ceramic Fuel Cell Market Outlook, By Type (2020-2028) ($MN)
42 Asia Pacific Protonic Ceramic Fuel Cell Market Outlook, By Proton-Exchange Membrane Fuel Cells (PEMFC) (2020-2028) ($MN)
43 Asia Pacific Protonic Ceramic Fuel Cell Market Outlook, By Solid Oxide Fuel Cells (SOFCs) (2020-2028) ($MN)
44 Asia Pacific Protonic Ceramic Fuel Cell Market Outlook, By Phosphoric Acid Fuel Cell (PAFC) (2020-2028) ($MN)
45 Asia Pacific Protonic Ceramic Fuel Cell Market Outlook, By Molten Carbonate Fuel Cell (MCFC) (2020-2028) ($MN)
46 Asia Pacific Protonic Ceramic Fuel Cell Market Outlook, By Direct Methanol Fuel Cell (DMFC) (2020-2028) ($MN)
47 Asia Pacific Protonic Ceramic Fuel Cell Market Outlook, By Alkaline Fuel Cell (AFC) (2020-2028) ($MN)
48 Asia Pacific Protonic Ceramic Fuel Cell Market Outlook, By Application (2020-2028) ($MN)
49 Asia Pacific Protonic Ceramic Fuel Cell Market Outlook, By Transportation (2020-2028) ($MN)
50 Asia Pacific Protonic Ceramic Fuel Cell Market Outlook, By Off- Grid- Power (2020-2028) ($MN)
51 Asia Pacific Protonic Ceramic Fuel Cell Market Outlook, By Stationary (2020-2028) ($MN)
52 Asia Pacific Protonic Ceramic Fuel Cell Market Outlook, By Portable (2020-2028) ($MN)
53 South America Protonic Ceramic Fuel Cell Market Outlook, By Country (2020-2028) ($MN)
54 South America Protonic Ceramic Fuel Cell Market Outlook, By Type (2020-2028) ($MN)
55 South America Protonic Ceramic Fuel Cell Market Outlook, By Proton-Exchange Membrane Fuel Cells (PEMFC) (2020-2028) ($MN)
56 South America Protonic Ceramic Fuel Cell Market Outlook, By Solid Oxide Fuel Cells (SOFCs) (2020-2028) ($MN)
57 South America Protonic Ceramic Fuel Cell Market Outlook, By Phosphoric Acid Fuel Cell (PAFC) (2020-2028) ($MN)
58 South America Protonic Ceramic Fuel Cell Market Outlook, By Molten Carbonate Fuel Cell (MCFC) (2020-2028) ($MN)
59 South America Protonic Ceramic Fuel Cell Market Outlook, By Direct Methanol Fuel Cell (DMFC) (2020-2028) ($MN)
60 South America Protonic Ceramic Fuel Cell Market Outlook, By Alkaline Fuel Cell (AFC) (2020-2028) ($MN)
61 South America Protonic Ceramic Fuel Cell Market Outlook, By Application (2020-2028) ($MN)
62 South America Protonic Ceramic Fuel Cell Market Outlook, By Transportation (2020-2028) ($MN)
63 South America Protonic Ceramic Fuel Cell Market Outlook, By Off- Grid- Power (2020-2028) ($MN)
64 South America Protonic Ceramic Fuel Cell Market Outlook, By Stationary (2020-2028) ($MN)
65 South America Protonic Ceramic Fuel Cell Market Outlook, By Portable (2020-2028) ($MN)
66 Asia Pacific Protonic Ceramic Fuel Cell Market Outlook, By Country (2020-2028) ($MN)
67 Asia Pacific Protonic Ceramic Fuel Cell Market Outlook, By Type (2020-2028) ($MN)
68 Asia Pacific Protonic Ceramic Fuel Cell Market Outlook, By Proton-Exchange Membrane Fuel Cells (PEMFC) (2020-2028) ($MN)
69 Asia Pacific Protonic Ceramic Fuel Cell Market Outlook, By Solid Oxide Fuel Cells (SOFCs) (2020-2028) ($MN)
70 Asia Pacific Protonic Ceramic Fuel Cell Market Outlook, By Phosphoric Acid Fuel Cell (PAFC) (2020-2028) ($MN)
71 Asia Pacific Protonic Ceramic Fuel Cell Market Outlook, By Molten Carbonate Fuel Cell (MCFC) (2020-2028) ($MN)
72 Asia Pacific Protonic Ceramic Fuel Cell Market Outlook, By Direct Methanol Fuel Cell (DMFC) (2020-2028) ($MN)
73 Asia Pacific Protonic Ceramic Fuel Cell Market Outlook, By Alkaline Fuel Cell (AFC) (2020-2028) ($MN)
74 Asia Pacific Protonic Ceramic Fuel Cell Market Outlook, By Application (2020-2028) ($MN)
75 Asia Pacific Protonic Ceramic Fuel Cell Market Outlook, By Transportation (2020-2028) ($MN)
76 Asia Pacific Protonic Ceramic Fuel Cell Market Outlook, By Off- Grid- Power (2020-2028) ($MN)
77 Asia Pacific Protonic Ceramic Fuel Cell Market Outlook, By Stationary (2020-2028) ($MN)
78 Asia Pacific Protonic Ceramic Fuel Cell Market Outlook, By Portable (2020-2028) ($MN)
List of Figures
RESEARCH METHODOLOGY

We at ‘Stratistics’ opt for an extensive research approach which involves data mining, data validation, and data analysis. The various research sources include in-house repository, secondary research, competitor’s sources, social media research, client internal data, and primary research.
Our team of analysts prefers the most reliable and authenticated data sources in order to perform the comprehensive literature search. With access to most of the authenticated data bases our team highly considers the best mix of information through various sources to obtain extensive and accurate analysis.
Each report takes an average time of a month and a team of 4 industry analysts. The time may vary depending on the scope and data availability of the desired market report. The various parameters used in the market assessment are standardized in order to enhance the data accuracy.
Data Mining
The data is collected from several authenticated, reliable, paid and unpaid sources and is filtered depending on the scope & objective of the research. Our reports repository acts as an added advantage in this procedure. Data gathering from the raw material suppliers, distributors and the manufacturers is performed on a regular basis, this helps in the comprehensive understanding of the products value chain. Apart from the above mentioned sources the data is also collected from the industry consultants to ensure the objective of the study is in the right direction.
Market trends such as technological advancements, regulatory affairs, market dynamics (Drivers, Restraints, Opportunities and Challenges) are obtained from scientific journals, market related national & international associations and organizations.
Data Analysis
From the data that is collected depending on the scope & objective of the research the data is subjected for the analysis. The critical steps that we follow for the data analysis include:
- Product Lifecycle Analysis
- Competitor analysis
- Risk analysis
- Porters Analysis
- PESTEL Analysis
- SWOT Analysis
The data engineering is performed by the core industry experts considering both the Marketing Mix Modeling and the Demand Forecasting. The marketing mix modeling makes use of multiple-regression techniques to predict the optimal mix of marketing variables. Regression factor is based on a number of variables and how they relate to an outcome such as sales or profits.
Data Validation
The data validation is performed by the exhaustive primary research from the expert interviews. This includes telephonic interviews, focus groups, face to face interviews, and questionnaires to validate our research from all aspects. The industry experts we approach come from the leading firms, involved in the supply chain ranging from the suppliers, distributors to the manufacturers and consumers so as to ensure an unbiased analysis.
We are in touch with more than 15,000 industry experts with the right mix of consultants, CEO's, presidents, vice presidents, managers, experts from both supply side and demand side, executives and so on.
The data validation involves the primary research from the industry experts belonging to:
- Leading Companies
- Suppliers & Distributors
- Manufacturers
- Consumers
- Industry/Strategic Consultants
Apart from the data validation the primary research also helps in performing the fill gap research, i.e. providing solutions for the unmet needs of the research which helps in enhancing the reports quality.
For more details about research methodology, kindly write to us at info@strategymrc.com
Frequently Asked Questions
In case of any queries regarding this report, you can contact the customer service by filing the “Inquiry Before Buy” form available on the right hand side. You may also contact us through email: info@strategymrc.com or phone: +1-301-202-5929
Yes, the samples are available for all the published reports. You can request them by filling the “Request Sample” option available in this page.
Yes, you can request a sample with your specific requirements. All the customized samples will be provided as per the requirement with the real data masked.
All our reports are available in Digital PDF format. In case if you require them in any other formats, such as PPT, Excel etc you can submit a request through “Inquiry Before Buy” form available on the right hand side. You may also contact us through email: info@strategymrc.com or phone: +1-301-202-5929
We offer a free 15% customization with every purchase. This requirement can be fulfilled for both pre and post sale. You may send your customization requirements through email at info@strategymrc.com or call us on +1-301-202-5929.
We have 3 different licensing options available in electronic format.
- Single User Licence: Allows one person, typically the buyer, to have access to the ordered product. The ordered product cannot be distributed to anyone else.
- 2-5 User Licence: Allows the ordered product to be shared among a maximum of 5 people within your organisation.
- Corporate License: Allows the product to be shared among all employees of your organisation regardless of their geographical location.
All our reports are typically be emailed to you as an attachment.
To order any available report you need to register on our website. The payment can be made either through CCAvenue or PayPal payments gateways which accept all international cards.
We extend our support to 6 months post sale. A post sale customization is also provided to cover your unmet needs in the report.
Request Customization
We offer complimentary customization of up to 15% with every purchase. To share your customization requirements, feel free to email us at info@strategymrc.com or call us on +1-301-202-5929. .
Please Note: Customization within the 15% threshold is entirely free of charge. If your request exceeds this limit, we will conduct a feasibility assessment. Following that, a detailed quote and timeline will be provided.
WHY CHOOSE US ?

Assured Quality
Best in class reports with high standard of research integrity

24X7 Research Support
Continuous support to ensure the best customer experience.

Free Customization
Adding more values to your product of interest.

Safe & Secure Access
Providing a secured environment for all online transactions.

Trusted by 600+ Brands
Serving the most reputed brands across the world.