
Real Time Streaming Analytics Market
Real Time Streaming Analytics Market Forecasts to 2034 - Global Analysis By Component (Software, Services), Deployment Mode, Organization Size, Application, End User and By Geography

|
Years Covered |
2023-2034 |
|
Estimated Year Value (2026) |
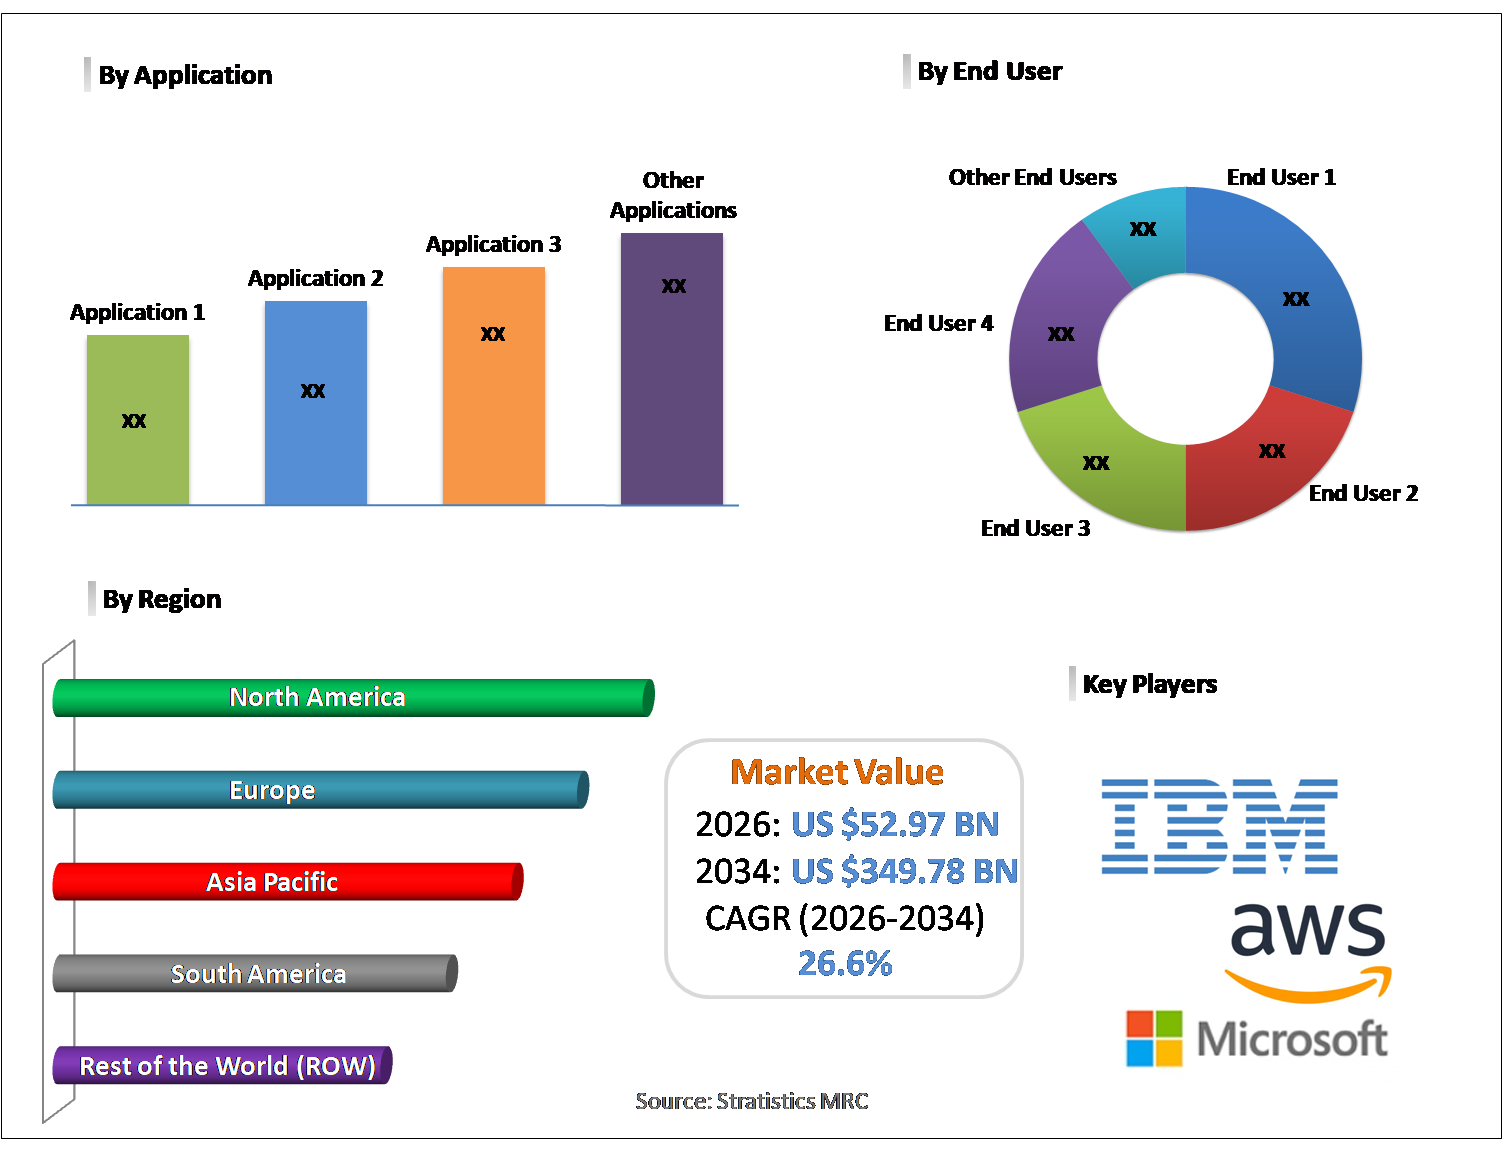
US $52.97 BN |
|
Projected Year Value (2034) |
US $349.78 BN |
|
CAGR (2026-2034) |
26.6% |
|
Regions Covered |
North America, Europe, Asia Pacific, South America, and Rest of the World (RoW) |
|
Countries Covered |
United States, Canada, Mexico, United Kingdom, Germany, France, Italy, Spain, Netherlands, Belgium, Sweden, Switzerland, Poland, Rest of Europe, China, Japan, India, South Korea, Australia, Indonesia, Thailand, Malaysia, Singapore, Vietnam, Rest of Asia Pacific, Brazil, Argentina, Colombia, Chile, Peru, Rest of South America, Saudi Arabia, United Arab Emirates, Qatar, Israel, Rest of Middle East, South Africa, Egypt, Morocco, and Rest of Africa. |
|
Largest Market |
North America |
|
Highest Growing Market |
Asia Pacific |
According to Stratistics MRC, the Global Real Time Streaming Analytics Market is accounted for $52.97 billion in 2026 and is expected to reach $349.78 billion by 2034 growing at a CAGR of 26.6% during the forecast period. Real time streaming analytics refers to the continuous processing, analysis, and interpretation of data as it is generated, enabling organizations to derive instant insights and take immediate action. Unlike traditional batch analytics, it handles high-velocity data streams from sources such as IoT devices, applications, sensors, and digital transactions. This technology supports time sensitive use cases including fraud detection, operational monitoring, predictive maintenance, and personalized customer engagement. By leveraging scalable cloud platforms, advanced algorithms, and event-driven architectures, real time streaming analytics enhances situational awareness, improves decision speed, and drives data driven business agility across industries.
Market Dynamics:
Driver:
Rising demand for instant business insights
The accelerating need for real time decision making across industries is a primary driver of the real time streaming analytics market. Organizations increasingly rely on instantaneous insights to enhance customer experiences, optimize operations, and mitigate risks in dynamic environments. The growth of digital commerce, fintech platforms, and connected ecosystems has intensified the requirement for low-latency analytics. As enterprises prioritize data driven agility and competitive responsiveness, investments in streaming analytics platforms continue to rise, reinforcing their strategic importance in modern data architectures.
Restraint:
High implementation and infrastructure costs
Despite strong demand, high implementation and infrastructure costs remain a significant restraint for market expansion. Deploying real time streaming analytics requires robust computing resources, advanced software platforms, and skilled technical personnel, all of which increase total cost of ownership. Small and medium-sized enterprises often face budget limitations that hinder adoption. Additionally, ongoing expenses related to data storage, bandwidth, and system maintenance further elevate operational costs, making organizations cautious about large scale deployments.
Opportunity:
Digital transformation and cloud adoption
The rapid pace of digital transformation and widespread cloud adoption presents substantial growth opportunities for the real time streaming analytics market. Enterprises migrating workloads to cloud environments gain scalable infrastructure that supports high velocity data processing at lower upfront costs. Cloud-native streaming platforms enable faster deployment, improved flexibility, and seamless integration with AI and machine learning tools. As organizations modernize IT ecosystems and embrace data centric business models, demand for real time analytics solutions is expected to expand significantly across industry verticals.
Threat:
Complex integration with legacy systems
Complex integration with legacy IT environments poses a notable threat to market growth. Many enterprises still operate on outdated infrastructure that was not designed for high-velocity data processing. Integrating modern streaming analytics platforms with these systems often requires extensive customization, data restructuring, and process redesign. Such complexity can lead to longer deployment cycles, higher implementation risks, and operational disruptions. Organizations may delay adoption until modernization strategies are clearer, thereby slowing the overall pace of real time streaming analytics market penetration.
Covid-19 Impact:
The COVID-19 pandemic accelerated the adoption of real time streaming analytics as organizations sought rapid visibility into shifting operational and customer patterns. Increased digital engagement, remote work, and online transactions generated massive real-time data flows, prompting enterprises to invest in advanced analytics capabilities. Healthcare systems, e-commerce platforms, and financial institutions particularly benefited from real-time monitoring and predictive insights. However, initial budget constraints and economic uncertainty temporarily delayed some projects.
The healthcare & life sciences segment is expected to be the largest during the forecast period
The healthcare & life sciences segment is expected to account for the largest market share during the forecast period, due to growing need for real-time patient monitoring, clinical decision support, and operational intelligence. The proliferation of connected medical devices, and electronic health records generates continuous data streams that require immediate analysis. Streaming analytics enables early detection of anomalies, improves treatment and enhances hospital efficiency. Increasing investments in digital health infrastructure and precision medicine further strengthen the segment’s dominant market position.
The fraud detection segment is expected to have the highest CAGR during the forecast period
Over the forecast period, the fraud detection segment is predicted to witness the highest growth rate, due to rising volume of digital transactions and sophisticated cyber threats. Financial institutions and payment providers increasingly depend on real-time analytics to identify suspicious activities and prevent financial losses instantly. Streaming analytics enables continuous monitoring of transactional patterns and behavioral anomalies with minimal latency. As regulatory pressure and cybersecurity risks intensify globally, organizations are prioritizing advanced fraud detection capabilities, fueling rapid segment expansion.
Region with largest share:
During the forecast period, the North America region is expected to hold the largest market share, due to strong cloud infrastructure, and the presence of major analytics solution providers. Enterprises in the United States and Canada are aggressively investing in AI driven data platforms and real time intelligence capabilities. The region’s mature digital economy, high IoT penetration, and robust cybersecurity initiatives further accelerate demand. Additionally, strong venture capital activity and enterprise digital transformation programs continue to reinforce North America’s leadership in streaming analytics adoption.
Region with highest CAGR:
Over the forecast period, the Asia Pacific region is anticipated to exhibit the highest CAGR, owing to expanding internet penetration, and growing investments in smart infrastructure. Emerging economies such as China, India, and Southeast Asian nations are witnessing strong growth in e-commerce, fintech, and telecommunications, all of which generate high velocity data streams. Government initiatives supporting digital economies and increasing cloud adoption among enterprises further stimulate market expansion. As organizations modernize data capabilities, the region is poised for accelerated streaming analytics growth.

Key players in the market
Some of the key players in Real Time Streaming Analytics Market include Amazon Web Services, Microsoft, Google, IBM, Oracle, SAP, Confluent, DataStax, TIBCO Software, PubNub, Cloudera, SAS Institute, Software AG, Splunk and Informatica.
Key Developments:
In December 2025, IBM and AWS have deepened their strategic collaboration to accelerate enterprise adoption of agentic AI, integrating AI technologies, hybrid cloud and governance solutions to help organizations deploy scalable, secure, and business‑driven autonomous systems across industries.
In October 2025, Bharti Airtel has entered a strategic partnership with IBM to enhance its newly launched Airtel Cloud, combining telco‑grade reliability with IBM’s advanced cloud, hybrid and AI‑optimized infrastructure to help regulated enterprises scale secure, interoperable, and mission‑critical workloads.
Components Covered:
• Software
• Services
Deployment Modes Covered:
• On Premises
• Cloud
Organization Sizes Covered:
• Small & Medium Enterprises (SMEs)
• Large Enterprises
Applications Covered:
• Fraud Detection
• Predictive Asset Maintenance
• Risk Management
• Sales & Marketing Analytics
• Customer Experience Management
• Network Management & Optimization
• Other Applications
End Users Covered:
• IT & Telecommunications
• Retail & E-commerce
• Healthcare & Life Sciences
• Manufacturing
• Government & Defense
• Energy & Utilities
• Media & Entertainment
Regions Covered:
• North America
o United States
o Canada
o Mexico
• Europe
o United Kingdom
o Germany
o France
o Italy
o Spain
o Netherlands
o Belgium
o Sweden
o Switzerland
o Poland
o Rest of Europe
• Asia Pacific
o China
o Japan
o India
o South Korea
o Australia
o Indonesia
o Thailand
o Malaysia
o Singapore
o Vietnam
o Rest of Asia Pacific
• South America
o Brazil
o Argentina
o Colombia
o Chile
o Peru
o Rest of South America
• Rest of the World (RoW)
o Middle East
§ Saudi Arabia
§ United Arab Emirates
§ Qatar
§ Israel
§ Rest of Middle East
o Africa
§ South Africa
§ Egypt
§ Morocco
§ Rest of Africa
What our report offers:
- Market share assessments for the regional and country-level segments
- Strategic recommendations for the new entrants
- Covers Market data for the years 2023, 2024, 2025, 2026, 2027, 2028, 2030, 2032 and 2034
- Market Trends (Drivers, Constraints, Opportunities, Threats, Challenges, Investment Opportunities, and recommendations)
- Strategic recommendations in key business segments based on the market estimations
- Competitive landscaping mapping the key common trends
- Company profiling with detailed strategies, financials, and recent developments
- Supply chain trends mapping the latest technological advancements
Free Customization Offerings:
All the customers of this report will be entitled to receive one of the following free customization options:
• Company Profiling
o Comprehensive profiling of additional market players (up to 3)
o SWOT Analysis of key players (up to 3)
• Regional Segmentation
o Market estimations, Forecasts and CAGR of any prominent country as per the client's interest (Note: Depends on feasibility check)
• Competitive Benchmarking
o Benchmarking of key players based on product portfolio, geographical presence, and strategic alliances
Table of Contents
1 Executive Summary
1.1 Market Snapshot and Key Highlights
1.2 Growth Drivers, Challenges, and Opportunities
1.3 Competitive Landscape Overview
1.4 Strategic Insights and Recommendations
2 Research Framework
2.1 Study Objectives and Scope
2.2 Stakeholder Analysis
2.3 Research Assumptions and Limitations
2.4 Research Methodology
2.4.1 Data Collection (Primary and Secondary)
2.4.2 Data Modeling and Estimation Techniques
2.4.3 Data Validation and Triangulation
2.4.4 Analytical and Forecasting Approach
3 Market Dynamics and Trend Analysis
3.1 Market Definition and Structure
3.2 Key Market Drivers
3.3 Market Restraints and Challenges
3.4 Growth Opportunities and Investment Hotspots
3.5 Industry Threats and Risk Assessment
3.6 Technology and Innovation Landscape
3.7 Emerging and High-Growth Markets
3.8 Regulatory and Policy Environment
3.9 Impact of COVID-19 and Recovery Outlook
4 Competitive and Strategic Assessment
4.1 Porter's Five Forces Analysis
4.1.1 Supplier Bargaining Power
4.1.2 Buyer Bargaining Power
4.1.3 Threat of Substitutes
4.1.4 Threat of New Entrants
4.1.5 Competitive Rivalry
4.2 Market Share Analysis of Key Players
4.3 Product Benchmarking and Performance Comparison
5 Global Real Time Streaming Analytics Market, By Component
5.1 Software
5.1.1 Stream Processing
5.1.2 Event Stream Processing
5.1.3 Visualization & Reporting
5.2 Services
5.2.1 Professional Services
5.2.2 Managed Services
6 Global Real Time Streaming Analytics Market, By Deployment Mode
6.1 On Premises
6.2 Cloud
7 Global Real Time Streaming Analytics Market, By Organization Size
7.1 Small & Medium Enterprises (SMEs)
7.2 Large Enterprises
8 Global Real Time Streaming Analytics Market, By Application
8.1 Fraud Detection
8.2 Predictive Asset Maintenance
8.3 Risk Management
8.4 Sales & Marketing Analytics
8.5 Customer Experience Management
8.6 Network Management & Optimization
8.7 Other Applications
9 Global Real Time Streaming Analytics Market, By End User
9.1 IT & Telecommunications
9.2 Retail & E-commerce
9.3 Healthcare & Life Sciences
9.4 Manufacturing
9.5 Government & Defense
9.6 Energy & Utilities
9.7 Media & Entertainment
10 Global Real Time Streaming Analytics Market, By Geography
10.1 North America
10.1.1 United States
10.1.2 Canada
10.1.3 Mexico
10.2 Europe
10.2.1 United Kingdom
10.2.2 Germany
10.2.3 France
10.2.4 Italy
10.2.5 Spain
10.2.6 Netherlands
10.2.7 Belgium
10.2.8 Sweden
10.2.9 Switzerland
10.2.10 Poland
10.2.11 Rest of Europe
10.3 Asia Pacific
10.3.1 China
10.3.2 Japan
10.3.3 India
10.3.4 South Korea
10.3.5 Australia
10.3.6 Indonesia
10.3.7 Thailand
10.3.8 Malaysia
10.3.9 Singapore
10.3.10 Vietnam
10.3.11 Rest of Asia Pacific
10.4 South America
10.4.1 Brazil
10.4.2 Argentina
10.4.3 Colombia
10.4.4 Chile
10.4.5 Peru
10.4.6 Rest of South America
10.5 Rest of the World (RoW)
10.5.1 Middle East
10.5.1.1 Saudi Arabia
10.5.1.2 United Arab Emirates
10.5.1.3 Qatar
10.5.1.4 Israel
10.5.1.5 Rest of Middle East
10.5.2 Africa
10.5.2.1 South Africa
10.5.2.2 Egypt
10.5.2.3 Morocco
10.5.2.4 Rest of Africa
11 Strategic Market Intelligence
11.1 Industry Value Network and Supply Chain Assessment
11.2 White-Space and Opportunity Mapping
11.3 Product Evolution and Market Life Cycle Analysis
11.4 Channel, Distributor, and Go-to-Market Assessment
12 Industry Developments and Strategic Initiatives
12.1 Mergers and Acquisitions
12.2 Partnerships, Alliances, and Joint Ventures
12.3 New Product Launches and Certifications
12.4 Capacity Expansion and Investments
12.5 Other Strategic Initiatives
13 Company Profiles
13.1 Amazon Web Services
13.2 Microsoft
13.3 Google
13.4 IBM
13.5 Oracle
13.6 SAP
13.7 Confluent
13.8 DataStax
13.9 TIBCO Software
13.10 PubNub
13.11 Cloudera
13.12 SAS Institute
13.13 Software AG
13.14 Splunk
13.15 Informatica
List of Tables
1 Global Real Time Streaming Analytics Market Outlook, By Region (2023-2034) ($MN)
2 Global Real Time Streaming Analytics Market Outlook, By Component (2023-2034) ($MN)
3 Global Real Time Streaming Analytics Market Outlook, By Software (2023-2034) ($MN)
4 Global Real Time Streaming Analytics Market Outlook, By Stream Processing (2023-2034) ($MN)
5 Global Real Time Streaming Analytics Market Outlook, By Event Stream Processing (2023-2034) ($MN)
6 Global Real Time Streaming Analytics Market Outlook, By Visualization & Reporting (2023-2034) ($MN)
7 Global Real Time Streaming Analytics Market Outlook, By Services (2023-2034) ($MN)
8 Global Real Time Streaming Analytics Market Outlook, By Professional Services (2023-2034) ($MN)
9 Global Real Time Streaming Analytics Market Outlook, By Managed Services (2023-2034) ($MN)
10 Global Real Time Streaming Analytics Market Outlook, By Deployment Mode (2023-2034) ($MN)
11 Global Real Time Streaming Analytics Market Outlook, By On Premises (2023-2034) ($MN)
12 Global Real Time Streaming Analytics Market Outlook, By Cloud (2023-2034) ($MN)
13 Global Real Time Streaming Analytics Market Outlook, By Organization Size (2023-2034) ($MN)
14 Global Real Time Streaming Analytics Market Outlook, By Small & Medium Enterprises (SMEs) (2023-2034) ($MN)
15 Global Real Time Streaming Analytics Market Outlook, By Large Enterprises (2023-2034) ($MN)
16 Global Real Time Streaming Analytics Market Outlook, By Application (2023-2034) ($MN)
17 Global Real Time Streaming Analytics Market Outlook, By Fraud Detection (2023-2034) ($MN)
18 Global Real Time Streaming Analytics Market Outlook, By Predictive Asset Maintenance (2023-2034) ($MN)
19 Global Real Time Streaming Analytics Market Outlook, By Risk Management (2023-2034) ($MN)
20 Global Real Time Streaming Analytics Market Outlook, By Sales & Marketing Analytics (2023-2034) ($MN)
21 Global Real Time Streaming Analytics Market Outlook, By Customer Experience Management (2023-2034) ($MN)
22 Global Real Time Streaming Analytics Market Outlook, By Network Management & Optimization (2023-2034) ($MN)
23 Global Real Time Streaming Analytics Market Outlook, By Other Applications (2023-2034) ($MN)
24 Global Real Time Streaming Analytics Market Outlook, By End User (2023-2034) ($MN)
25 Global Real Time Streaming Analytics Market Outlook, By IT & Telecommunications (2023-2034) ($MN)
26 Global Real Time Streaming Analytics Market Outlook, By Retail & E-commerce (2023-2034) ($MN)
27 Global Real Time Streaming Analytics Market Outlook, By Healthcare & Life Sciences (2023-2034) ($MN)
28 Global Real Time Streaming Analytics Market Outlook, By Manufacturing (2023-2034) ($MN)
29 Global Real Time Streaming Analytics Market Outlook, By Government & Defense (2023-2034) ($MN)
30 Global Real Time Streaming Analytics Market Outlook, By Energy & Utilities (2023-2034) ($MN)
31 Global Real Time Streaming Analytics Market Outlook, By Media & Entertainment (2023-2034) ($MN)
Note: Tables for North America, Europe, APAC, South America, and Rest of the World (RoW) Regions are also represented in the same manner as above.
List of Figures
RESEARCH METHODOLOGY

We at ‘Stratistics’ opt for an extensive research approach which involves data mining, data validation, and data analysis. The various research sources include in-house repository, secondary research, competitor’s sources, social media research, client internal data, and primary research.
Our team of analysts prefers the most reliable and authenticated data sources in order to perform the comprehensive literature search. With access to most of the authenticated data bases our team highly considers the best mix of information through various sources to obtain extensive and accurate analysis.
Each report takes an average time of a month and a team of 4 industry analysts. The time may vary depending on the scope and data availability of the desired market report. The various parameters used in the market assessment are standardized in order to enhance the data accuracy.
Data Mining
The data is collected from several authenticated, reliable, paid and unpaid sources and is filtered depending on the scope & objective of the research. Our reports repository acts as an added advantage in this procedure. Data gathering from the raw material suppliers, distributors and the manufacturers is performed on a regular basis, this helps in the comprehensive understanding of the products value chain. Apart from the above mentioned sources the data is also collected from the industry consultants to ensure the objective of the study is in the right direction.
Market trends such as technological advancements, regulatory affairs, market dynamics (Drivers, Restraints, Opportunities and Challenges) are obtained from scientific journals, market related national & international associations and organizations.
Data Analysis
From the data that is collected depending on the scope & objective of the research the data is subjected for the analysis. The critical steps that we follow for the data analysis include:
- Product Lifecycle Analysis
- Competitor analysis
- Risk analysis
- Porters Analysis
- PESTEL Analysis
- SWOT Analysis
The data engineering is performed by the core industry experts considering both the Marketing Mix Modeling and the Demand Forecasting. The marketing mix modeling makes use of multiple-regression techniques to predict the optimal mix of marketing variables. Regression factor is based on a number of variables and how they relate to an outcome such as sales or profits.
Data Validation
The data validation is performed by the exhaustive primary research from the expert interviews. This includes telephonic interviews, focus groups, face to face interviews, and questionnaires to validate our research from all aspects. The industry experts we approach come from the leading firms, involved in the supply chain ranging from the suppliers, distributors to the manufacturers and consumers so as to ensure an unbiased analysis.
We are in touch with more than 15,000 industry experts with the right mix of consultants, CEO's, presidents, vice presidents, managers, experts from both supply side and demand side, executives and so on.
The data validation involves the primary research from the industry experts belonging to:
- Leading Companies
- Suppliers & Distributors
- Manufacturers
- Consumers
- Industry/Strategic Consultants
Apart from the data validation the primary research also helps in performing the fill gap research, i.e. providing solutions for the unmet needs of the research which helps in enhancing the reports quality.
For more details about research methodology, kindly write to us at info@strategymrc.com
Frequently Asked Questions
In case of any queries regarding this report, you can contact the customer service by filing the “Inquiry Before Buy” form available on the right hand side. You may also contact us through email: info@strategymrc.com or phone: +1-301-202-5929
Yes, the samples are available for all the published reports. You can request them by filling the “Request Sample” option available in this page.
Yes, you can request a sample with your specific requirements. All the customized samples will be provided as per the requirement with the real data masked.
All our reports are available in Digital PDF format. In case if you require them in any other formats, such as PPT, Excel etc you can submit a request through “Inquiry Before Buy” form available on the right hand side. You may also contact us through email: info@strategymrc.com or phone: +1-301-202-5929
We offer a free 15% customization with every purchase. This requirement can be fulfilled for both pre and post sale. You may send your customization requirements through email at info@strategymrc.com or call us on +1-301-202-5929.
We have 3 different licensing options available in electronic format.
- Single User Licence: Allows one person, typically the buyer, to have access to the ordered product. The ordered product cannot be distributed to anyone else.
- 2-5 User Licence: Allows the ordered product to be shared among a maximum of 5 people within your organisation.
- Corporate License: Allows the product to be shared among all employees of your organisation regardless of their geographical location.
All our reports are typically be emailed to you as an attachment.
To order any available report you need to register on our website. The payment can be made either through CCAvenue or PayPal payments gateways which accept all international cards.
We extend our support to 6 months post sale. A post sale customization is also provided to cover your unmet needs in the report.
Request Customization
We offer complimentary customization of up to 15% with every purchase. To share your customization requirements, feel free to email us at info@strategymrc.com or call us on +1-301-202-5929. .
Please Note: Customization within the 15% threshold is entirely free of charge. If your request exceeds this limit, we will conduct a feasibility assessment. Following that, a detailed quote and timeline will be provided.
WHY CHOOSE US ?

Assured Quality
Best in class reports with high standard of research integrity

24X7 Research Support
Continuous support to ensure the best customer experience.

Free Customization
Adding more values to your product of interest.

Safe & Secure Access
Providing a secured environment for all online transactions.

Trusted by 600+ Brands
Serving the most reputed brands across the world.