
Small Hydro Market
Small Hydro Market Forecasts to 2034 – Global Analysis By Plant Capacity (Micro Hydropower Plants, Mini Hydropower Plants, and Small Hydropower Plants up to 10 MW), Plant Type, Turbine Type, Component, End User, and By Geography

Market Dynamics:
Driver:
Local water resources support dependable community and industrial electricity
Small hydropower can supply renewable electricity close to communities and enterprises when a suitable water resource is available. Its value is particularly evident where diesel generation is expensive or the wider grid is unreliable, because a carefully assessed site can provide continuing output across substantial operating periods. Existing plants also offer opportunities to improve reliability through replacement turbines, modern controls and electrical upgrades. This creates demand beyond new construction alone. Customers prioritize predictable energy delivery and long asset life, while developers increasingly need to demonstrate how generation will coexist with irrigation, drinking water and ecological requirements.
Restraint:
Civil works and permitting costs weigh heavily on small projects
A small plant still requires substantial site assessment, access works and approvals, even when its generating capacity is modest. Intake structures, waterways, foundations and interconnection can dominate project costs, with geology and difficult terrain creating uncertainty that cannot be resolved through standardized equipment alone. Environmental studies and negotiations over water rights add time before construction begins. These fixed development burdens can make very small projects disproportionately expensive. Limited long-term flow measurements also weaken confidence in revenue forecasts. Developers therefore face a narrow margin for error when converting an apparently attractive water resource into a financeable generating asset.
Opportunity:
Adding generation to existing canals and water supply infrastructure
Irrigation canals, municipal pipelines and other water-conveyance systems can provide locations for small generating equipment without constructing a new river impoundment. Where flow and pressure conditions are suitable, turbines can recover energy while preserving the infrastructure's primary water delivery function. The U.S. Department of Energy identifies conduit hydropower as a practical development pathway with opportunities across several water-use sectors. Suppliers can address these sites through compact units and coordinated controls. The opportunity depends on working closely with water operators, since electricity production must not compromise delivery pressure, water quality, maintenance access or seasonal irrigation obligations.
Threat:
Changing river conditions and ecological constraints reduce usable output
Hydrological variability can undermine small hydro revenue because many plants have limited storage and depend directly on available flow. Drought reduces generation, while extreme rainfall, sediment and debris can damage intakes or accelerate turbine wear. Changes in ecological flow requirements may further restrict how much water can be diverted. Communities can also oppose developments that affect fisheries, recreation or competing water uses, regardless of their modest generating capacity. These threats make historical average flows an insufficient basis for long-term planning. Projects need realistic seasonal assumptions, resilient intake design and credible environmental management to retain operating and social acceptance.
Covid-19 Impact:
Pandemic restrictions delayed small hydro construction where specialized equipment and installation teams had to cross regional or national borders. Remote sites were particularly exposed to transport interruptions and reduced availability of contractors, while financing decisions slowed during economic uncertainty. Existing plants generally remained useful sources of local electricity, but maintenance and spare-parts planning became more difficult. Community projects faced additional challenges when consultations and training could not proceed normally. The recovery emphasized the value of locally available technical skills, remote supervision and modular equipment that could simplify installation without eliminating the need for rigorous site-specific engineering.
The Run-of-River Plants segment is expected to be the largest during the forecast period
Run-of-River Plants are expected to form the largest plant-type segment because they suit many small hydro locations where a usable head difference and continuing river flow can support generation without a large reservoir. Their configuration can reduce the scale of storage-related works, although intakes, waterways and ecological safeguards remain essential. Established operating experience and a broad range of compatible turbines support supplier participation across different geographies. Output still varies with seasonal hydrology, so project selection is critical. The segment's projected leadership reflects its widespread applicability and installed asset base, including refurbishment opportunities at long-operating river-based facilities.
The Canal and Water-Conveyance Plants segment is expected to have the highest CAGR during the forecast period
Canal and Water-Conveyance Plants are anticipated to show the highest CAGR because they can turn existing water infrastructure into additional electricity-producing assets. Municipal and irrigation operators may find these projects attractive when unused hydraulic energy can offset their own power consumption or create revenue. Existing rights of way and water management arrangements can simplify some development tasks, though technical and regulatory conditions remain location dependent. Compact generating packages also allow suppliers to serve sites too small for conventional project designs. Expansion should be driven by systematic screening of water networks and cooperation between energy specialists and the organizations responsible for water delivery.
Region with largest share:
Asia Pacific is expected to retain the largest regional share, supported by China's substantial small hydro base and continued activity across mountainous and river-rich Asian markets. UNIDO's World Small Hydropower Development Report identifies Asia's extensive installed capacity and China's central role within it. Equipment manufacturing capability and experience in project delivery reinforce demand for both modernization and new facilities. Recent installations in Japan and Indonesia illustrate the variety of viable project sizes and ownership models. The regional position rests on this established ecosystem, while environmental review and water availability remain important constraints on further expansion.
Region with highest CAGR:
Rest of the World (RoW) is forecast to achieve the highest CAGR, with African electricity access and industrial development requirements creating opportunities from a relatively limited installed base. UNIDO's small hydro initiatives emphasize technical capacity, standards and project development support in countries where suitable water resources remain underused. Nigeria's newly launched Center of Excellence adds a mechanism for training and knowledge transfer in West Africa. This growth outlook depends on bankable projects, dependable offtakers and sustained local maintenance capabilities. Regional gains are therefore expected to come from carefully selected installations rather than uniform deployment across all markets.
Key players in the market
Some of the key players in the Small Hydro Market include ANDRITZ AG, Voith GmbH & Co. KGaA, Siemens Energy AG, GE Vernova Inc., Toshiba Energy Systems & Solutions Corporation, Bharat Heavy Electricals Limited, Gilbert Gilkes & Gordon Ltd., FLOVEL Energy Private Limited, Mavel, a.s., HNAC Technology Co., Ltd., Canyon Hydro, Global Hydro Energy GmbH, Kolektor Turboinstitut d.o.o., Canadian Hydro Components Ltd., and Natel Energy, Inc..
Key Developments:
In September 2026, FLOVEL reported that the 4 MW Kambangan hydropower plant in Central Java had been successfully commissioned in July. Its scope included two horizontal Francis turbines and the complete electromechanical package, illustrating demand for integrated equipment, control and commissioning services within the study's small hydro capacity range.
In March 2026, Nigeria launched a Small Hydropower Center of Excellence project at Abuja University with UNIDO and the International Center on Small Hydro Power. The initiative was designed to support technical training, knowledge transfer and policy development, strengthening the capabilities needed to prepare and maintain future small hydro projects.
In October 2025, the Hiratanai small hydropower plant near Yakumo, Japan, formally began operations with a MAVEL horizontal Francis turbine rated at up to 360 kW. The Czech Embassy reported the commissioning ceremony, highlighting a public-private project that demonstrates how compact turbine technology can serve local renewable electricity development.
Plant Capacities Covered:
• Micro Hydropower Plants
• Mini Hydropower Plants
• Small Hydropower Plants up to 10 MW
Plant Types Covered:
• Run-of-River Plants
• Small Reservoir and Storage Plants
• Canal and Water-Conveyance Plants
Turbine Types Covered:
• Pelton Turbines
• Francis Turbines
• Kaplan and Propeller Turbines
• Crossflow Turbines
• Other Small Hydro Turbines
Components Covered:
• Electromechanical Equipment
• Turbines and Generators
• Control and Protection Systems
• Civil Works and Water Conveyance
• Electrical Infrastructure
End Users Covered:
• Utility-Scale Operators
• Commercial and Industrial Operators
• Community and Off-Grid Systems
Regions Covered:
• North America
o United States
o Canada
o Mexico
• Europe
o United Kingdom
o Germany
o France
o Italy
o Spain
o Netherlands
o Belgium
o Sweden
o Switzerland
o Poland
o Rest of Europe
• Asia Pacific
o China
o Japan
o India
o South Korea
o Australia
o Indonesia
o Thailand
o Malaysia
o Singapore
o Vietnam
o Rest of Asia Pacific
• South America
o Brazil
o Argentina
o Colombia
o Chile
o Peru
o Rest of South America
• Rest of the World (RoW)
o Middle East
Saudi Arabia
United Arab Emirates
Qatar
Israel
Rest of Middle East
o Africa
South Africa
Egypt
Morocco
Rest of Africa
What our report offers:
- Market share assessments for regional and country-level segments
- Strategic recommendations for new entrants in the small hydro industry
- Market data for the years 2023, 2024, 2025, 2026, 2027, 2028, 2030, 2032 and 2034
- Analysis of market trends, drivers, constraints, opportunities, threats, challenges and investment opportunities, with recommendations
- Strategic recommendations in key business segments based on market estimations
- Competitive landscape mapping of the main industry trends
- Company profiling covering detailed strategies, financials and recent developments
- Supply chain trends and the latest technological advancements
Free Customization Offerings:
All customers of this report are entitled to receive one of the following free customization options:
• Company Profiling
o Comprehensive profiling of additional market players (up to 3)
o SWOT Analysis of key players (up to 3)
• Regional Segmentation
o Market estimations, forecasts and CAGR for any prominent country of interest to the client (Note: Depends on feasibility check)
• Competitive Benchmarking
o Benchmarking of key players based on product portfolio, geographical presence and strategic alliances
Table of Contents
1 Executive Summary1.1 Market Snapshot and Key Highlights
1.2 Growth Drivers, Challenges, and Opportunities
1.3 Competitive Landscape Overview
1.4 Strategic Insights and Recommendations
2 Research Framework
2.1 Study Objectives and Scope
2.2 Stakeholder Analysis
2.3 Research Assumptions and Limitations
2.4 Research Methodology
2.4.1 Data Collection (Primary and Secondary)
2.4.2 Data Modeling and Estimation Techniques
2.4.3 Data Validation and Triangulation
2.4.4 Analytical and Forecasting Approach
3 Market Dynamics and Trend Analysis
3.1 Market Definition and Structure
3.2 Key Market Drivers
3.3 Market Restraints and Challenges
3.4 Growth Opportunities and Investment Hotspots
3.5 Industry Threats and Risk Assessment
3.6 Technology and Innovation Landscape
3.7 Emerging and High-Growth Markets
3.8 Regulatory and Policy Environment
3.9 Impact of COVID-19 and Recovery Outlook
4 Competitive and Strategic Assessment
4.1 Porter's Five Forces Analysis
4.1.1 Supplier Bargaining Power
4.1.2 Buyer Bargaining Power
4.1.3 Threat of Substitutes
4.1.4 Threat of New Entrants
4.1.5 Competitive Rivalry
4.2 Market Share Analysis of Key Players
4.3 Product Benchmarking and Performance Comparison
5 Global Small Hydro Market, By Plant Capacity
5.1 Micro Hydropower Plants
5.2 Mini Hydropower Plants
5.3 Small Hydropower Plants up to 10 MW
6 Global Small Hydro Market, By Plant Type
6.1 Run-of-River Plants
6.2 Small Reservoir and Storage Plants
6.3 Canal and Water-Conveyance Plants
7 Global Small Hydro Market, By Turbine Type
7.1 Pelton Turbines
7.2 Francis Turbines
7.3 Kaplan and Propeller Turbines
7.4 Crossflow Turbines
7.5 Other Small Hydro Turbines
8 Global Small Hydro Market, By Component
8.1 Electromechanical Equipment
8.2 Turbines and Generators
8.3 Control and Protection Systems
8.4 Civil Works and Water Conveyance
8.5 Electrical Infrastructure
9 Global Small Hydro Market, By End User
9.1 Utility-Scale Operators
9.2 Commercial and Industrial Operators
9.3 Community and Off-Grid Systems
10 Global Small Hydro Market, By Geography
10.1 North America
10.1.1 United States
10.1.2 Canada
10.1.3 Mexico
10.2 Europe
10.2.1 United Kingdom
10.2.2 Germany
10.2.3 France
10.2.4 Italy
10.2.5 Spain
10.2.6 Netherlands
10.2.7 Belgium
10.2.8 Sweden
10.2.9 Switzerland
10.2.10 Poland
10.2.11 Rest of Europe
10.3 Asia Pacific
10.3.1 China
10.3.2 Japan
10.3.3 India
10.3.4 South Korea
10.3.5 Australia
10.3.6 Indonesia
10.3.7 Thailand
10.3.8 Malaysia
10.3.9 Singapore
10.3.10 Vietnam
10.3.11 Rest of Asia Pacific
10.4 South America
10.4.1 Brazil
10.4.2 Argentina
10.4.3 Colombia
10.4.4 Chile
10.4.5 Peru
10.4.6 Rest of South America
10.5 Rest of the World (RoW)
10.5.1 Middle East
10.5.1.1 Saudi Arabia
10.5.1.2 United Arab Emirates
10.5.1.3 Qatar
10.5.1.4 Israel
10.5.1.5 Rest of Middle East
10.5.2 Africa
10.5.2.1 South Africa
10.5.2.2 Egypt
10.5.2.3 Morocco
10.5.2.4 Rest of Africa
11 Strategic Market Intelligence
11.1 Industry Value Network and Supply Chain Assessment
11.2 White-Space and Opportunity Mapping
11.3 Product Evolution and Market Life Cycle Analysis
11.4 Channel, Distributor, and Go-to-Market Assessment
12 Industry Developments and Strategic Initiatives
12.1 Mergers and Acquisitions
12.2 Partnerships, Alliances, and Joint Ventures
12.3 New Product Launches and Certifications
12.4 Capacity Expansion and Investments
12.5 Other Strategic Initiatives
13 Company Profiles
13.1 ANDRITZ AG
13.2 Voith GmbH & Co. KGaA
13.3 Siemens Energy AG
13.4 GE Vernova Inc.
13.5 Toshiba Energy Systems & Solutions Corporation
13.6 Bharat Heavy Electricals Limited
13.7 Gilbert Gilkes & Gordon Ltd.
13.8 FLOVEL Energy Private Limited
13.9 Mavel, a.s.
13.10 HNAC Technology Co., Ltd.
13.11 Canyon Hydro
13.12 Global Hydro Energy GmbH
13.13 Kolektor Turboinstitut d.o.o.
13.14 Canadian Hydro Components Ltd.
13.15 Natel Energy, Inc.
List of Tables
1 Global Small Hydro Market Outlook, By Region (2023–2034) ($MN)
2 Global Small Hydro Market Outlook, By Plant Capacity (2023–2034) ($MN)
3 Global Small Hydro Market Outlook, By Micro Hydropower Plants (2023–2034) ($MN)
4 Global Small Hydro Market Outlook, By Mini Hydropower Plants (2023–2034) ($MN)
5 Global Small Hydro Market Outlook, By Small Hydropower Plants up to 10 MW (2023–2034) ($MN)
6 Global Small Hydro Market Outlook, By Plant Type (2023–2034) ($MN)
7 Global Small Hydro Market Outlook, By Run-of-River Plants (2023–2034) ($MN)
8 Global Small Hydro Market Outlook, By Small Reservoir and Storage Plants (2023–2034) ($MN)
9 Global Small Hydro Market Outlook, By Canal and Water-Conveyance Plants (2023–2034) ($MN)
10 Global Small Hydro Market Outlook, By Turbine Type (2023–2034) ($MN)
11 Global Small Hydro Market Outlook, By Pelton Turbines (2023–2034) ($MN)
12 Global Small Hydro Market Outlook, By Francis Turbines (2023–2034) ($MN)
13 Global Small Hydro Market Outlook, By Kaplan and Propeller Turbines (2023–2034) ($MN)
14 Global Small Hydro Market Outlook, By Crossflow Turbines (2023–2034) ($MN)
15 Global Small Hydro Market Outlook, By Other Small Hydro Turbines (2023–2034) ($MN)
16 Global Small Hydro Market Outlook, By Component (2023–2034) ($MN)
17 Global Small Hydro Market Outlook, By Electromechanical Equipment (2023–2034) ($MN)
18 Global Small Hydro Market Outlook, By Turbines and Generators (2023–2034) ($MN)
19 Global Small Hydro Market Outlook, By Control and Protection Systems (2023–2034) ($MN)
20 Global Small Hydro Market Outlook, By Civil Works and Water Conveyance (2023–2034) ($MN)
21 Global Small Hydro Market Outlook, By Electrical Infrastructure (2023–2034) ($MN)
22 Global Small Hydro Market Outlook, By End User (2023–2034) ($MN)
23 Global Small Hydro Market Outlook, By Utility-Scale Operators (2023–2034) ($MN)
24 Global Small Hydro Market Outlook, By Commercial and Industrial Operators (2023–2034) ($MN)
25 Global Small Hydro Market Outlook, By Community and Off-Grid Systems (2023–2034) ($MN)
Note: Tables for North America, Europe, APAC, South America, and Rest of the World (RoW) Regions are also represented in the same manner as above.
List of Figures
RESEARCH METHODOLOGY
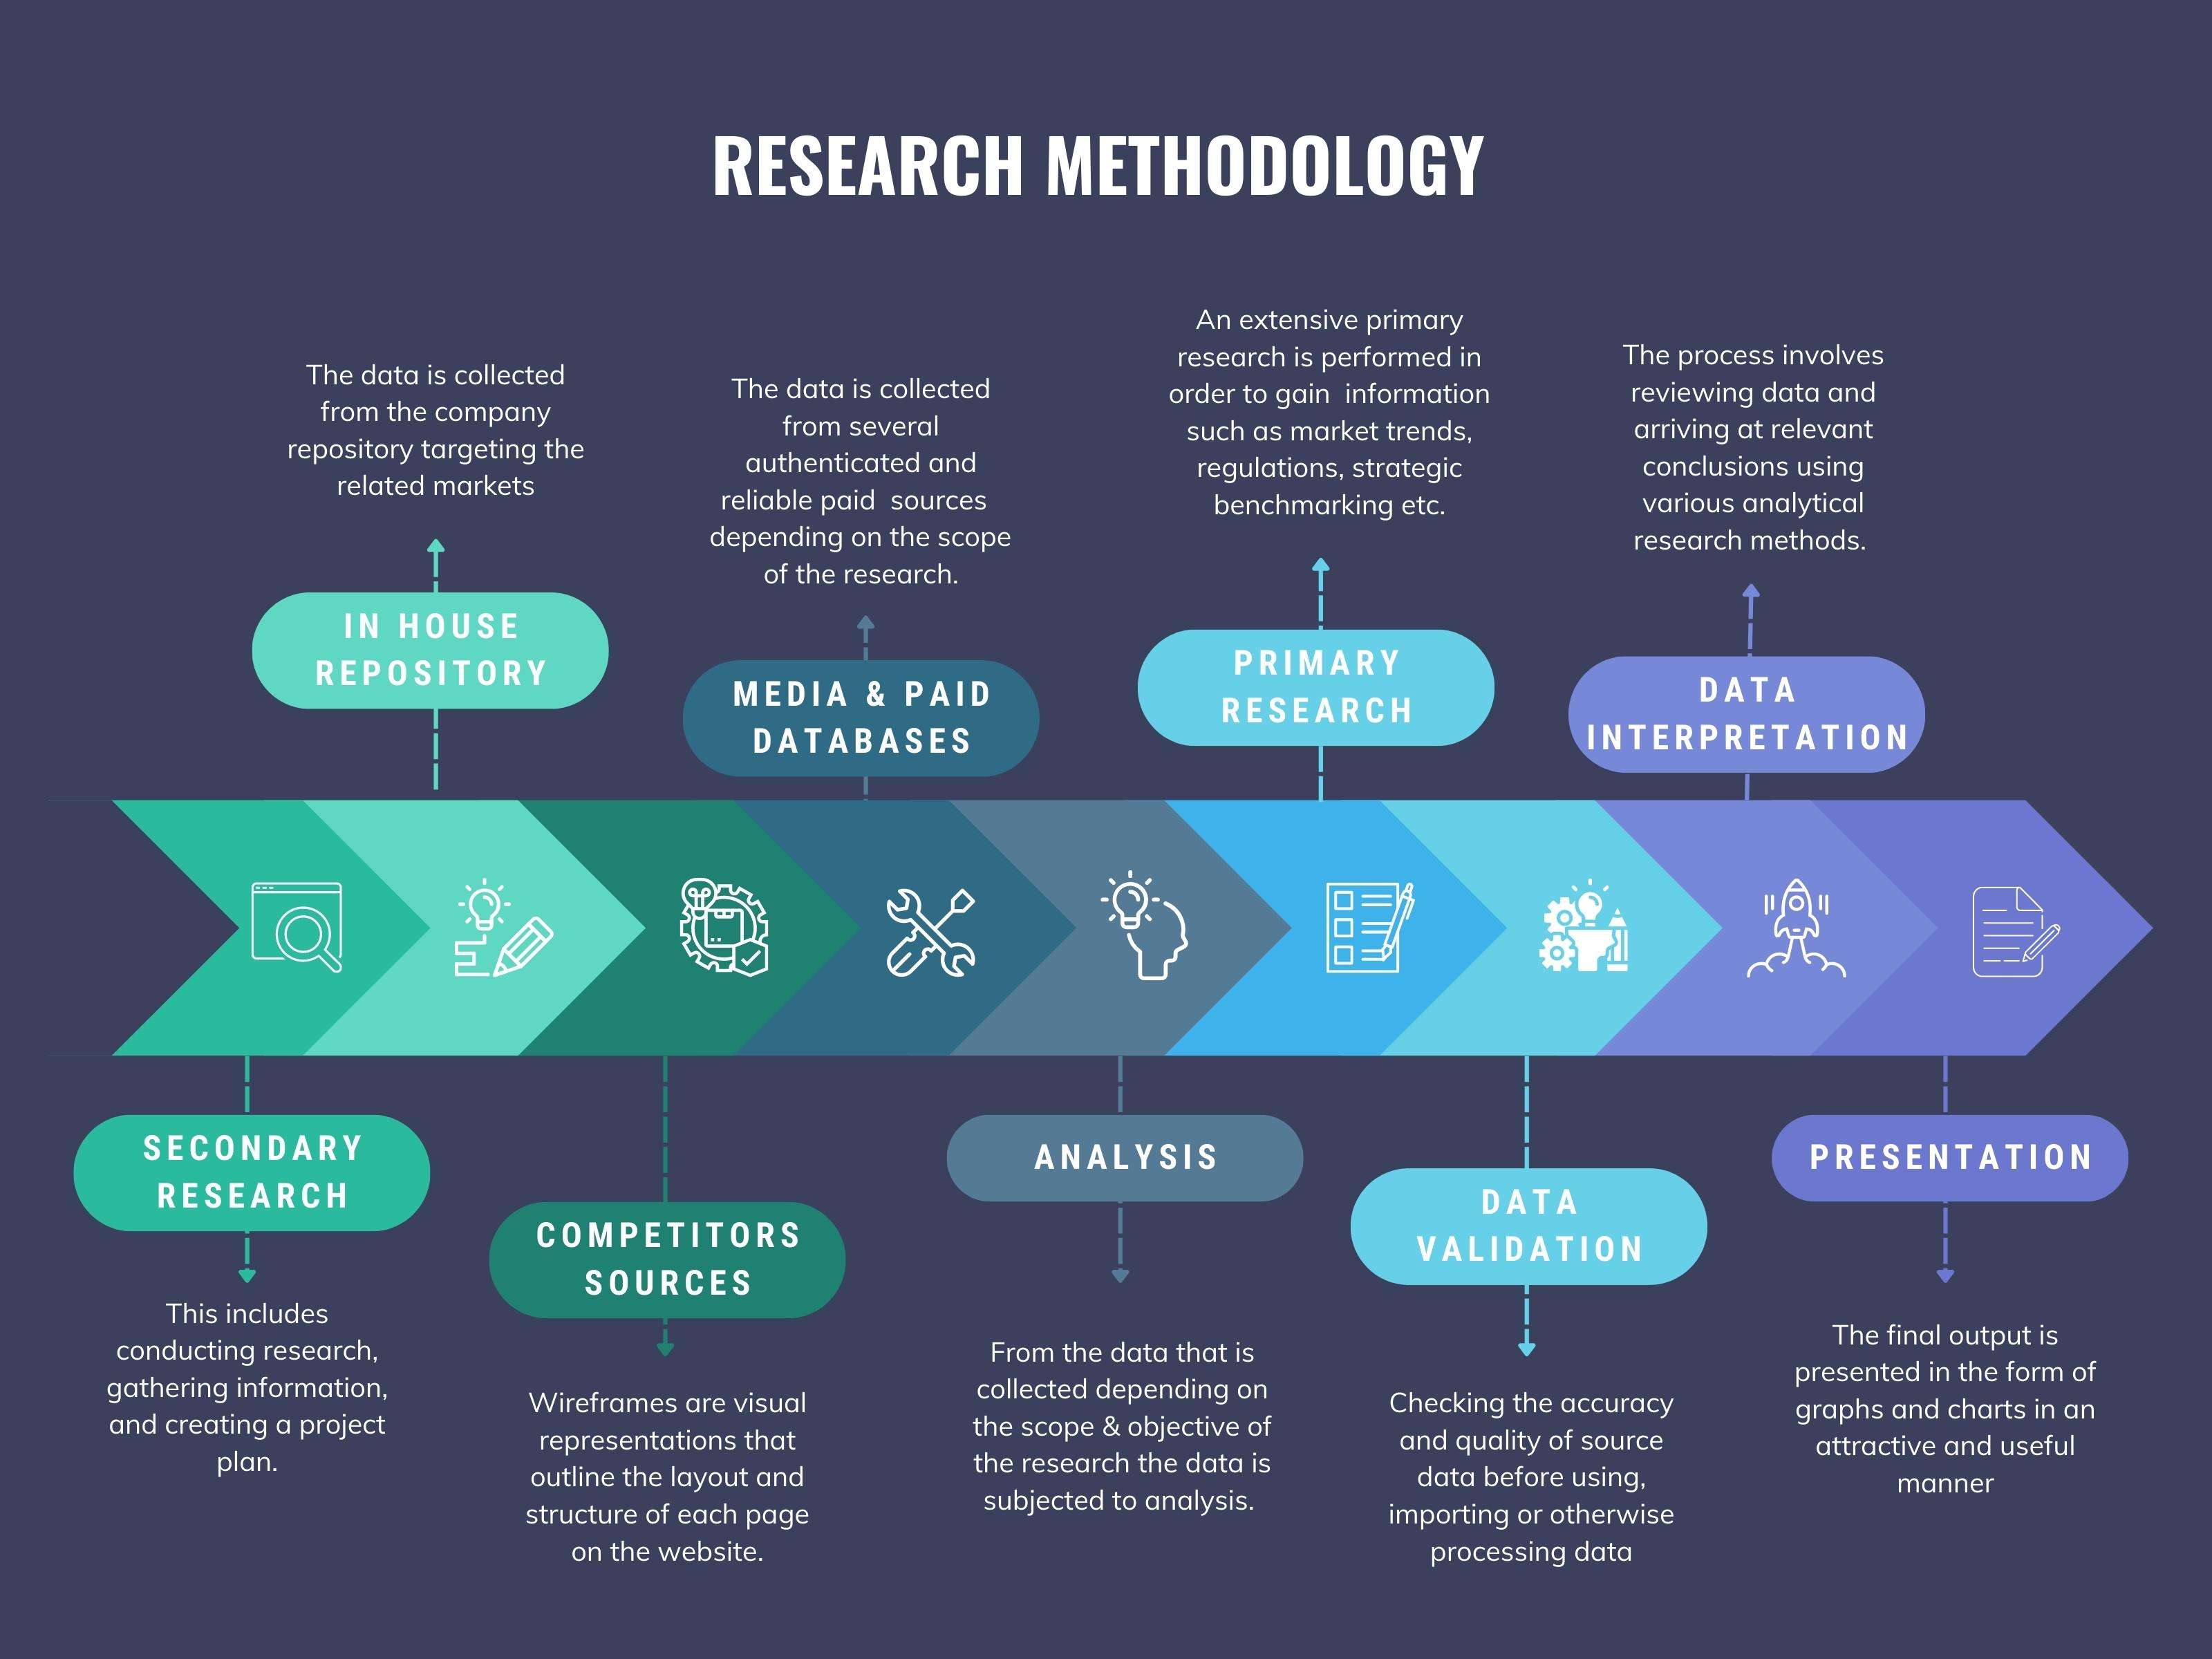
We at ‘Stratistics’ opt for an extensive research approach which involves data mining, data validation, and data analysis. The various research sources include in-house repository, secondary research, competitor’s sources, social media research, client internal data, and primary research.
Our team of analysts prefers the most reliable and authenticated data sources in order to perform the comprehensive literature search. With access to most of the authenticated data bases our team highly considers the best mix of information through various sources to obtain extensive and accurate analysis.
Each report takes an average time of a month and a team of 4 industry analysts. The time may vary depending on the scope and data availability of the desired market report. The various parameters used in the market assessment are standardized in order to enhance the data accuracy.
Data Mining
The data is collected from several authenticated, reliable, paid and unpaid sources and is filtered depending on the scope & objective of the research. Our reports repository acts as an added advantage in this procedure. Data gathering from the raw material suppliers, distributors and the manufacturers is performed on a regular basis, this helps in the comprehensive understanding of the products value chain. Apart from the above mentioned sources the data is also collected from the industry consultants to ensure the objective of the study is in the right direction.
Market trends such as technological advancements, regulatory affairs, market dynamics (Drivers, Restraints, Opportunities and Challenges) are obtained from scientific journals, market related national & international associations and organizations.
Data Analysis
From the data that is collected depending on the scope & objective of the research the data is subjected for the analysis. The critical steps that we follow for the data analysis include:
- Product Lifecycle Analysis
- Competitor analysis
- Risk analysis
- Porters Analysis
- PESTEL Analysis
- SWOT Analysis
The data engineering is performed by the core industry experts considering both the Marketing Mix Modeling and the Demand Forecasting. The marketing mix modeling makes use of multiple-regression techniques to predict the optimal mix of marketing variables. Regression factor is based on a number of variables and how they relate to an outcome such as sales or profits.
Data Validation
The data validation is performed by the exhaustive primary research from the expert interviews. This includes telephonic interviews, focus groups, face to face interviews, and questionnaires to validate our research from all aspects. The industry experts we approach come from the leading firms, involved in the supply chain ranging from the suppliers, distributors to the manufacturers and consumers so as to ensure an unbiased analysis.
We are in touch with more than 15,000 industry experts with the right mix of consultants, CEO's, presidents, vice presidents, managers, experts from both supply side and demand side, executives and so on.
The data validation involves the primary research from the industry experts belonging to:
- Leading Companies
- Suppliers & Distributors
- Manufacturers
- Consumers
- Industry/Strategic Consultants
Apart from the data validation the primary research also helps in performing the fill gap research, i.e. providing solutions for the unmet needs of the research which helps in enhancing the reports quality.
For more details about research methodology, kindly write to us at info@strategymrc.com
Frequently Asked Questions
In case of any queries regarding this report, you can contact the customer service by filing the “Inquiry Before Buy” form available on the right hand side. You may also contact us through email: info@strategymrc.com or phone: +1-301-202-5929
Yes, the samples are available for all the published reports. You can request them by filling the “Request Sample” option available in this page.
Yes, you can request a sample with your specific requirements. All the customized samples will be provided as per the requirement with the real data masked.
All our reports are available in Digital PDF format. In case if you require them in any other formats, such as PPT, Excel etc you can submit a request through “Inquiry Before Buy” form available on the right hand side. You may also contact us through email: info@strategymrc.com or phone: +1-301-202-5929
We offer a free 15% customization with every purchase. This requirement can be fulfilled for both pre and post sale. You may send your customization requirements through email at info@strategymrc.com or call us on +1-301-202-5929.
We have 3 different licensing options available in electronic format.
- Single User Licence: Allows one person, typically the buyer, to have access to the ordered product. The ordered product cannot be distributed to anyone else.
- 2-5 User Licence: Allows the ordered product to be shared among a maximum of 5 people within your organisation.
- Corporate License: Allows the product to be shared among all employees of your organisation regardless of their geographical location.
All our reports are typically be emailed to you as an attachment.
To order any available report you need to register on our website. The payment can be made either through CCAvenue or PayPal payments gateways which accept all international cards.
We extend our support to 6 months post sale. A post sale customization is also provided to cover your unmet needs in the report.
Request Customization
We offer complimentary customization of up to 15% with every purchase. To share your customization requirements, feel free to email us at info@strategymrc.com or call us on +1-301-202-5929. .
Please Note: Customization within the 15% threshold is entirely free of charge. If your request exceeds this limit, we will conduct a feasibility assessment. Following that, a detailed quote and timeline will be provided.
WHY CHOOSE US ?

Assured Quality
Best in class reports with high standard of research integrity

24X7 Research Support
Continuous support to ensure the best customer experience.

Free Customization
Adding more values to your product of interest.

Safe & Secure Access
Providing a secured environment for all online transactions.

Trusted by 600+ Brands
Serving the most reputed brands across the world.