
Smart Active Packaging Market
Smart Active Packaging Market Forecasts to 2034 - Global Analysis By Type (Active Packaging and Intelligent Packaging), Material, Technology, Application and By Geography

|
Years Covered |
2023-2034 |
|
Estimated Year Value (2026) |
US $20.22 BN |
|
Projected Year Value (2034) |
US $37.15 BN |
|
CAGR (2026-2034) |
7.9% |
|
Regions Covered |
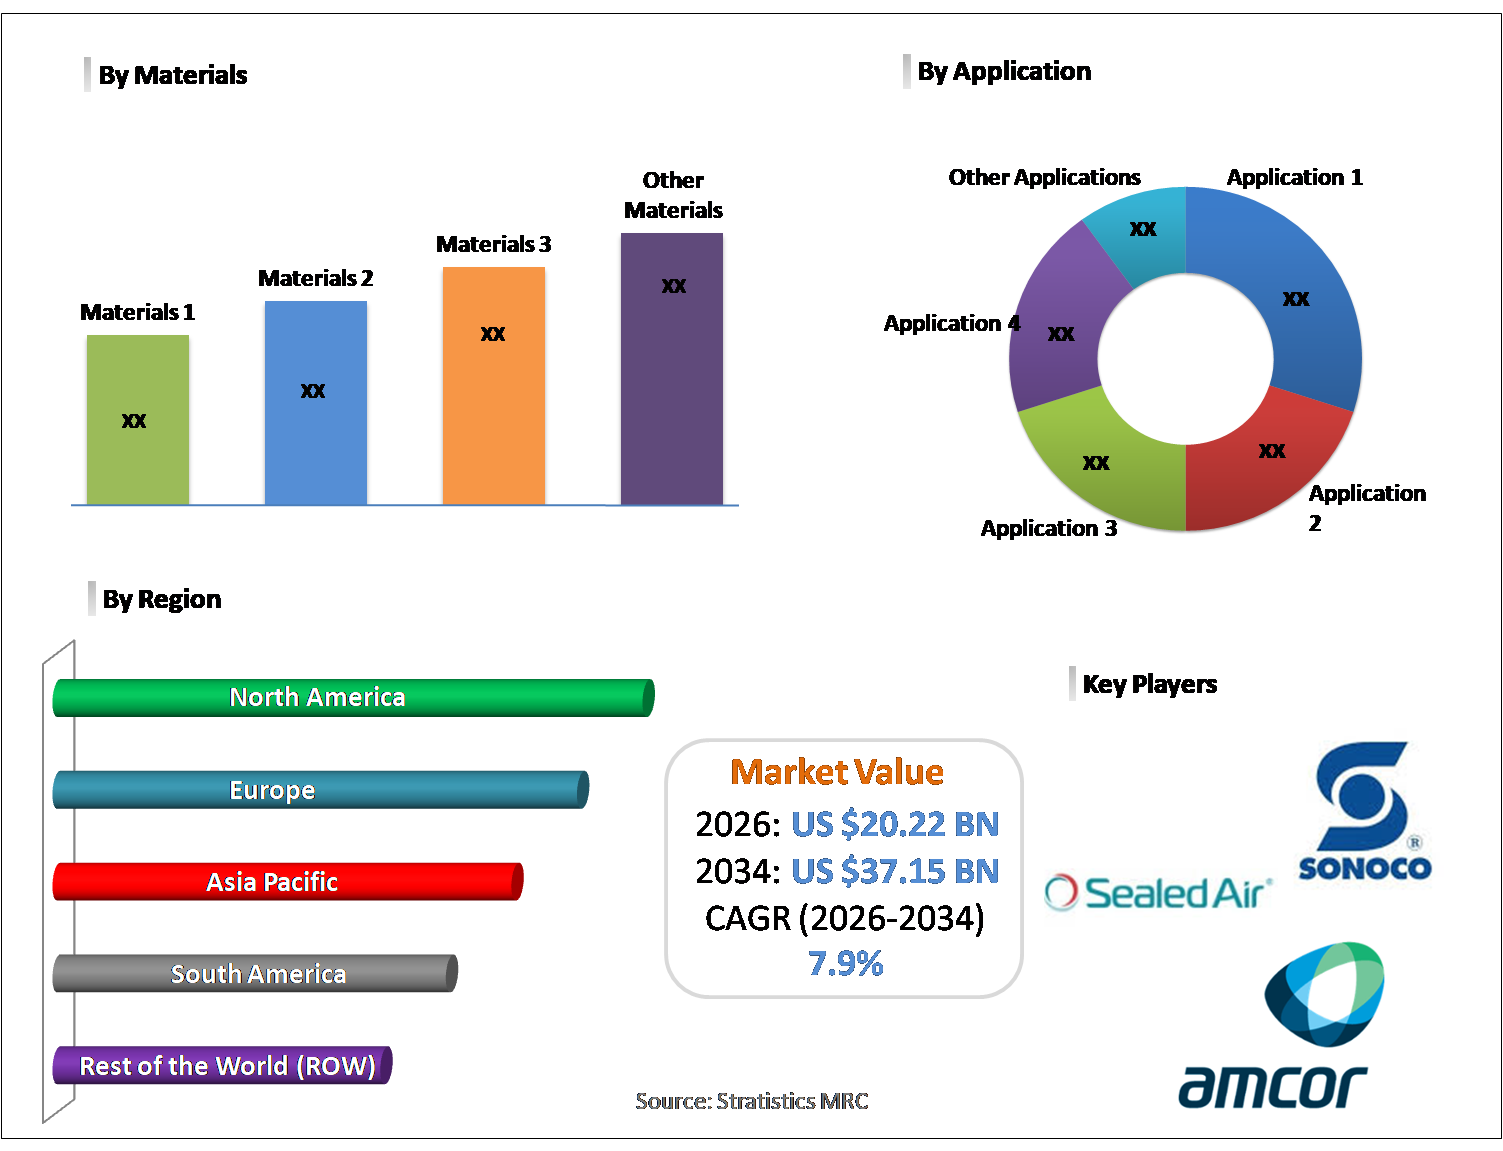
North America, Europe, Asia Pacific, South America, and Rest of the World (RoW) |
|
Countries Covered |
United States, Canada, Mexico, United Kingdom, Germany, France, Italy, Spain, Netherlands, Belgium, Sweden, Switzerland, Poland, Rest of Europe, China, Japan, India, South Korea, Australia, Indonesia, Thailand, Malaysia, Singapore, Vietnam, Rest of Asia Pacific, Brazil, Argentina, Colombia, Chile, Peru, Rest of South America, Saudi Arabia, United Arab Emirates, Qatar, Israel, Rest of Middle East, South Africa, Egypt, Morocco, and Rest of Africa. |
|
Largest Market |
North America |
|
Highest Growing Market |
Asia Pacific |
According to Stratistics MRC, the Global Smart Active Packaging Market is accounted for $20.22 billion in 2026 and is expected to reach $37.15 billion by 2034 growing at a CAGR of 7.9% during the forecast period. Smart active packaging refers to advanced packaging systems that actively interact with the packaged product or its environment to enhance product quality, safety, and shelf life. These solutions incorporate functional components such as oxygen scavengers, moisture regulators, antimicrobial agents, sensors, or indicators that respond to real-time conditions. Unlike traditional passive packaging, smart active packaging can monitor, preserve, and communicate product status throughout the supply chain. Widely used in food, pharmaceuticals, and consumer goods, it helps reduce spoilage, improve traceability, and support data driven inventory and quality management strategies.
Market Dynamics:
Driver:
Rising focus on food safety and shelf life extension
Increasing global emphasis on food safety, product integrity, and waste reduction is a major driver for the smart active packaging market. Manufacturers are adopting advanced packaging solutions to monitor freshness, control internal conditions, and extend product shelf life. Growing regulatory scrutiny in food and pharmaceutical sectors further reinforces this trend. Additionally, rising consumer awareness regarding product quality and safety is encouraging brands to invest in intelligent preservation technologies that minimize spoilage and enhance supply chain reliability.
Restraint:
High implementation and production costs
High production and implementation costs remain a key restraint for smart active packaging adoption. The integration of sensors, specialized materials, and intelligent components significantly increases manufacturing expenses compared to conventional packaging. Companies must also invest in research, system compatibility, and process upgrades. For cost-sensitive industries and small manufacturers, the return on investment may appear uncertain. These financial barriers can slow large scale commercialization, particularly in emerging markets.
Opportunity:
Technological advancements
Rapid technological progress in smart materials, nanotechnology, printed electronics, RFID, and IoT integration is creating substantial growth opportunities for the smart active packaging market. These innovations enable real-time monitoring, improved product protection, and enhanced consumer engagement. As production techniques become more scalable and cost efficient, adoption across food, pharmaceutical, and retail sectors is expected to accelerate. Furthermore, the convergence of digital tracking and intelligent packaging is opening new possibilities for data-driven supply chain management and brand differentiation.
Threat:
Regulatory complexity and limited standardization
Regulatory complexity and the lack of global standardization pose significant threats to market expansion. Smart active packaging used in food and pharmaceutical applications must comply with stringent safety and material regulations, which vary across regions. Lengthy approval timelines and evolving compliance requirements can delay product launches and increase development costs. Additionally, the absence of unified industry standards creates interoperability challenges and slows widespread adoption, particularly for companies operating across multiple geographic markets.
Covid-19 Impact:
The COVID-19 pandemic positively influenced the smart active packaging market by heightening global awareness of hygiene, product safety, and supply chain transparency. Demand increased for packaging solutions capable of monitoring product integrity, particularly in pharmaceuticals, medical supplies, and packaged foods. However, temporary supply chain disruptions and raw material shortages created short-term challenges. In the post-pandemic environment, the emphasis on safety, traceability, and contactless logistics continues to support sustained investment in intelligent and active packaging technologies.
The pharmaceuticals segment is expected to be the largest during the forecast period
The pharmaceuticals segment is expected to account for the largest market share during the forecast period, due to the critical need for product stability, temperature monitoring, and tamper detection in drug distribution. Smart active packaging helps ensure medication efficacy, regulatory compliance, and patient safety. Increasing biologics shipments and strict cold chain requirements further drives the adoption. Pharmaceutical companies are prioritizing intelligent packaging to minimize spoilage risks, improve traceability, and meet stringent quality assurance standards across global supply networks.
The antimicrobial agents segment is expected to have the highest CAGR during the forecast period
Over the forecast period, the antimicrobial agents segment is predicted to witness the highest growth rate, due to rising demand for extended product freshness and contamination control. These agents actively inhibit microbial growth, making them highly valuable in food, healthcare, and personal care applications. Growing concerns over foodborne illnesses and product safety are accelerating adoption. Additionally, advances in material science are improving the effectiveness and compatibility of antimicrobial packaging, further supporting rapid segment expansion.
Region with largest share:
During the forecast period, the North America region is expected to hold the largest market share, due to strong technological adoption, well-established pharmaceutical and food industries, and robust regulatory frameworks supporting advanced packaging innovation. The presence of major packaging technology providers and high consumer awareness regarding product safety further strengthens regional demand. Additionally, significant investments in smart logistics, cold chain infrastructure, and IoT-enabled packaging solutions position North America as the leading regional market.
Region with highest CAGR:
Over the forecast period, the Asia Pacific region is anticipated to exhibit the highest CAGR, owing to rapid industrialization, expanding packaged food consumption, and growing pharmaceutical manufacturing across countries such as China, India, Japan, and South Korea. Rising e-commerce penetration and increasing focus on food safety are accelerating demand for intelligent packaging. Government initiatives promoting advanced manufacturing and improving supply chain infrastructure are further supporting regional market growth, making Asia Pacific the fastest growing market.

Key players in the market
Some of the key players in Smart Active Packaging Market include Amcor plc, Sonoco Products Company, Sealed Air Corporation, WestRock Company, Avery Dennison Corporation, Crown Holdings, Inc., 3M Company, Berry Global Inc., DuPont de Nemours, Inc., Stora Enso Oyj, BASF SE, Zebra Technologies Corporation, Smurfit Kappa Group, Mondi Group and Tetra Pak International S.A.
Key Developments:
In October 2025, Mondi deepened its long standing collaboration with Südwestdeutsche Salzwerke AG by supplying a comprehensive range of robust, food safe packaging solutions that protect its salt products throughout the supply chain. This strengthened partnership reinforces Mondi’s position as a trusted, full-service packaging provider.
In October 2024, Mondi has agreed to acquire the Western Europe packaging assets of Schumacher Packaging, significantly expanding its corrugated converting and solid board operations in Germany, the Benelux and the UK, adding over 1 billion square metres of capacity and strengthening its sustainable packaging footprint across the region.
Types Covered:
• Active Packaging
• Intelligent Packaging
Materials Covered:
• Plastics
• Paper & Board
• Biodegradable Materials
• Metals
• Glass
Technologies Covered:
• Time-Temperature Indicators (TTIs)
• Gas Scavengers
• Moisture Absorbers
• Antimicrobial Agents
• RFID & NFC Tags
• Sensors & Indicators
Applications Covered:
• Food & Beverages
• Pharmaceuticals
• Cosmetics & Personal Care
• Healthcare Products
• Other Applications
Regions Covered:
• North America
o United States
o Canada
o Mexico
• Europe
o United Kingdom
o Germany
o France
o Italy
o Spain
o Netherlands
o Belgium
o Sweden
o Switzerland
o Poland
o Rest of Europe
• Asia Pacific
o China
o Japan
o India
o South Korea
o Australia
o Indonesia
o Thailand
o Malaysia
o Singapore
o Vietnam
o Rest of Asia Pacific
• South America
o Brazil
o Argentina
o Colombia
o Chile
o Peru
o Rest of South America
• Rest of the World (RoW)
o Middle East
§ Saudi Arabia
§ United Arab Emirates
§ Qatar
§ Israel
§ Rest of Middle East
o Africa
§ South Africa
§ Egypt
§ Morocco
§ Rest of Africa
What our report offers:
- Market share assessments for the regional and country-level segments
- Strategic recommendations for the new entrants
- Covers Market data for the years 2023, 2024, 2025, 2026, 2027, 2028, 2030, 2032 and 2034
- Market Trends (Drivers, Constraints, Opportunities, Threats, Challenges, Investment Opportunities, and recommendations)
- Strategic recommendations in key business segments based on the market estimations
- Competitive landscaping mapping the key common trends
- Company profiling with detailed strategies, financials, and recent developments
- Supply chain trends mapping the latest technological advancements
Free Customization Offerings:
All the customers of this report will be entitled to receive one of the following free customization options:
• Company Profiling
o Comprehensive profiling of additional market players (up to 3)
o SWOT Analysis of key players (up to 3)
• Regional Segmentation
o Market estimations, Forecasts and CAGR of any prominent country as per the client's interest (Note: Depends on feasibility check)
• Competitive Benchmarking
o Benchmarking of key players based on product portfolio, geographical presence, and strategic alliances
Table of Contents
1 Executive Summary
1.1 Market Snapshot and Key Highlights
1.2 Growth Drivers, Challenges, and Opportunities
1.3 Competitive Landscape Overview
1.4 Strategic Insights and Recommendations
2 Research Framework
2.1 Study Objectives and Scope
2.2 Stakeholder Analysis
2.3 Research Assumptions and Limitations
2.4 Research Methodology
2.4.1 Data Collection (Primary and Secondary)
2.4.2 Data Modeling and Estimation Techniques
2.4.3 Data Validation and Triangulation
2.4.4 Analytical and Forecasting Approach
3 Market Dynamics and Trend Analysis
3.1 Market Definition and Structure
3.2 Key Market Drivers
3.3 Market Restraints and Challenges
3.4 Growth Opportunities and Investment Hotspots
3.5 Industry Threats and Risk Assessment
3.6 Technology and Innovation Landscape
3.7 Emerging and High-Growth Markets
3.8 Regulatory and Policy Environment
3.9 Impact of COVID-19 and Recovery Outlook
4 Competitive and Strategic Assessment
4.1 Porter's Five Forces Analysis
4.1.1 Supplier Bargaining Power
4.1.2 Buyer Bargaining Power
4.1.3 Threat of Substitutes
4.1.4 Threat of New Entrants
4.1.5 Competitive Rivalry
4.2 Market Share Analysis of Key Players
4.3 Product Benchmarking and Performance Comparison
5 Global Smart Active Packaging Market, By Type
5.1 Active Packaging
5.2 Intelligent Packaging
6 Global Smart Active Packaging Market, By Material
6.1 Plastics
6.2 Paper & Board
6.3 Biodegradable Materials
6.4 Metals
6.5 Glass
7 Global Smart Active Packaging Market, By Technology
7.1 Time-Temperature Indicators (TTIs)
7.2 Gas Scavengers
7.2.1 Oxygen Scavengers
7.2.2 Ethylene Scavengers
7.3 Moisture Absorbers
7.4 Antimicrobial Agents
7.5 RFID & NFC Tags
7.6 Sensors & Indicators
8 Global Smart Active Packaging Market, By Application
8.1 Food & Beverages
8.2 Pharmaceuticals
8.3 Cosmetics & Personal Care
8.4 Healthcare Products
8.5 Other Applications
9 Global Smart Active Packaging Market, By Geography
9.1 North America
9.1.1 United States
9.1.2 Canada
9.1.3 Mexico
9.2 Europe
9.2.1 United Kingdom
9.2.2 Germany
9.2.3 France
9.2.4 Italy
9.2.5 Spain
9.2.6 Netherlands
9.2.7 Belgium
9.2.8 Sweden
9.2.9 Switzerland
9.2.10 Poland
9.2.11 Rest of Europe
9.3 Asia Pacific
9.3.1 China
9.3.2 Japan
9.3.3 India
9.3.4 South Korea
9.3.5 Australia
9.3.6 Indonesia
9.3.7 Thailand
9.3.8 Malaysia
9.3.9 Singapore
9.3.10 Vietnam
9.3.11 Rest of Asia Pacific
9.4 South America
9.4.1 Brazil
9.4.2 Argentina
9.4.3 Colombia
9.4.4 Chile
9.4.5 Peru
9.4.6 Rest of South America
9.5 Rest of the World (RoW)
9.5.1 Middle East
9.5.1.1 Saudi Arabia
9.5.1.2 United Arab Emirates
9.5.1.3 Qatar
9.5.1.4 Israel
9.5.1.5 Rest of Middle East
9.5.2 Africa
9.5.2.1 South Africa
9.5.2.2 Egypt
9.5.2.3 Morocco
9.5.2.4 Rest of Africa
10 Strategic Market Intelligence
10.1 Industry Value Network and Supply Chain Assessment
10.2 White-Space and Opportunity Mapping
10.3 Product Evolution and Market Life Cycle Analysis
10.4 Channel, Distributor, and Go-to-Market Assessment
11 Industry Developments and Strategic Initiatives
11.1 Mergers and Acquisitions
11.2 Partnerships, Alliances, and Joint Ventures
11.3 New Product Launches and Certifications
11.4 Capacity Expansion and Investments
11.5 Other Strategic Initiatives
12 Company Profiles
12.1 Amcor plc
12.2 Sonoco Products Company
12.3 Sealed Air Corporation
12.4 WestRock Company
12.5 Avery Dennison Corporation
12.6 Crown Holdings, Inc.
12.7 3M Company
12.8 Berry Global Inc.
12.9 DuPont de Nemours, Inc.
12.10 Stora Enso Oyj
12.11 BASF SE
12.12 Zebra Technologies Corporation
12.13 Smurfit Kappa Group
12.14 Mondi Group
12.15 Tetra Pak International S.A.
List of Tables
1 Global Smart Active Packaging Market Outlook, By Region (2023-2034) ($MN)
2 Global Smart Active Packaging Market Outlook, By Type (2023-2034) ($MN)
3 Global Smart Active Packaging Market Outlook, By Active Packaging (2023-2034) ($MN)
4 Global Smart Active Packaging Market Outlook, By Intelligent Packaging (2023-2034) ($MN)
5 Global Smart Active Packaging Market Outlook, By Material (2023-2034) ($MN)
6 Global Smart Active Packaging Market Outlook, By Plastics (2023-2034) ($MN)
7 Global Smart Active Packaging Market Outlook, By Paper & Board (2023-2034) ($MN)
8 Global Smart Active Packaging Market Outlook, By Biodegradable Materials (2023-2034) ($MN)
9 Global Smart Active Packaging Market Outlook, By Metals (2023-2034) ($MN)
10 Global Smart Active Packaging Market Outlook, By Glass (2023-2034) ($MN)
11 Global Smart Active Packaging Market Outlook, By Technology (2023-2034) ($MN)
12 Global Smart Active Packaging Market Outlook, By Time-Temperature Indicators (TTIs) (2023-2034) ($MN)
13 Global Smart Active Packaging Market Outlook, By Gas Scavengers (2023-2034) ($MN)
14 Global Smart Active Packaging Market Outlook, By Oxygen Scavengers (2023-2034) ($MN)
15 Global Smart Active Packaging Market Outlook, By Ethylene Scavengers (2023-2034) ($MN)
16 Global Smart Active Packaging Market Outlook, By Moisture Absorbers (2023-2034) ($MN)
17 Global Smart Active Packaging Market Outlook, By Antimicrobial Agents (2023-2034) ($MN)
18 Global Smart Active Packaging Market Outlook, By RFID & NFC Tags (2023-2034) ($MN)
19 Global Smart Active Packaging Market Outlook, By Sensors & Indicators (2023-2034) ($MN)
20 Global Smart Active Packaging Market Outlook, By Application (2023-2034) ($MN)
21 Global Smart Active Packaging Market Outlook, By Food & Beverages (2023-2034) ($MN)
22 Global Smart Active Packaging Market Outlook, By Pharmaceuticals (2023-2034) ($MN)
23 Global Smart Active Packaging Market Outlook, By Cosmetics & Personal Care (2023-2034) ($MN)
24 Global Smart Active Packaging Market Outlook, By Healthcare Products (2023-2034) ($MN)
25 Global Smart Active Packaging Market Outlook, By Other Applications (2023-2034) ($MN)
Note: Tables for North America, Europe, APAC, South America, and Rest of the World (RoW) Regions are also represented in the same manner as above.
List of Figures
RESEARCH METHODOLOGY

We at ‘Stratistics’ opt for an extensive research approach which involves data mining, data validation, and data analysis. The various research sources include in-house repository, secondary research, competitor’s sources, social media research, client internal data, and primary research.
Our team of analysts prefers the most reliable and authenticated data sources in order to perform the comprehensive literature search. With access to most of the authenticated data bases our team highly considers the best mix of information through various sources to obtain extensive and accurate analysis.
Each report takes an average time of a month and a team of 4 industry analysts. The time may vary depending on the scope and data availability of the desired market report. The various parameters used in the market assessment are standardized in order to enhance the data accuracy.
Data Mining
The data is collected from several authenticated, reliable, paid and unpaid sources and is filtered depending on the scope & objective of the research. Our reports repository acts as an added advantage in this procedure. Data gathering from the raw material suppliers, distributors and the manufacturers is performed on a regular basis, this helps in the comprehensive understanding of the products value chain. Apart from the above mentioned sources the data is also collected from the industry consultants to ensure the objective of the study is in the right direction.
Market trends such as technological advancements, regulatory affairs, market dynamics (Drivers, Restraints, Opportunities and Challenges) are obtained from scientific journals, market related national & international associations and organizations.
Data Analysis
From the data that is collected depending on the scope & objective of the research the data is subjected for the analysis. The critical steps that we follow for the data analysis include:
- Product Lifecycle Analysis
- Competitor analysis
- Risk analysis
- Porters Analysis
- PESTEL Analysis
- SWOT Analysis
The data engineering is performed by the core industry experts considering both the Marketing Mix Modeling and the Demand Forecasting. The marketing mix modeling makes use of multiple-regression techniques to predict the optimal mix of marketing variables. Regression factor is based on a number of variables and how they relate to an outcome such as sales or profits.
Data Validation
The data validation is performed by the exhaustive primary research from the expert interviews. This includes telephonic interviews, focus groups, face to face interviews, and questionnaires to validate our research from all aspects. The industry experts we approach come from the leading firms, involved in the supply chain ranging from the suppliers, distributors to the manufacturers and consumers so as to ensure an unbiased analysis.
We are in touch with more than 15,000 industry experts with the right mix of consultants, CEO's, presidents, vice presidents, managers, experts from both supply side and demand side, executives and so on.
The data validation involves the primary research from the industry experts belonging to:
- Leading Companies
- Suppliers & Distributors
- Manufacturers
- Consumers
- Industry/Strategic Consultants
Apart from the data validation the primary research also helps in performing the fill gap research, i.e. providing solutions for the unmet needs of the research which helps in enhancing the reports quality.
For more details about research methodology, kindly write to us at info@strategymrc.com
Frequently Asked Questions
In case of any queries regarding this report, you can contact the customer service by filing the “Inquiry Before Buy” form available on the right hand side. You may also contact us through email: info@strategymrc.com or phone: +1-301-202-5929
Yes, the samples are available for all the published reports. You can request them by filling the “Request Sample” option available in this page.
Yes, you can request a sample with your specific requirements. All the customized samples will be provided as per the requirement with the real data masked.
All our reports are available in Digital PDF format. In case if you require them in any other formats, such as PPT, Excel etc you can submit a request through “Inquiry Before Buy” form available on the right hand side. You may also contact us through email: info@strategymrc.com or phone: +1-301-202-5929
We offer a free 15% customization with every purchase. This requirement can be fulfilled for both pre and post sale. You may send your customization requirements through email at info@strategymrc.com or call us on +1-301-202-5929.
We have 3 different licensing options available in electronic format.
- Single User Licence: Allows one person, typically the buyer, to have access to the ordered product. The ordered product cannot be distributed to anyone else.
- 2-5 User Licence: Allows the ordered product to be shared among a maximum of 5 people within your organisation.
- Corporate License: Allows the product to be shared among all employees of your organisation regardless of their geographical location.
All our reports are typically be emailed to you as an attachment.
To order any available report you need to register on our website. The payment can be made either through CCAvenue or PayPal payments gateways which accept all international cards.
We extend our support to 6 months post sale. A post sale customization is also provided to cover your unmet needs in the report.
Request Customization
We offer complimentary customization of up to 15% with every purchase. To share your customization requirements, feel free to email us at info@strategymrc.com or call us on +1-301-202-5929. .
Please Note: Customization within the 15% threshold is entirely free of charge. If your request exceeds this limit, we will conduct a feasibility assessment. Following that, a detailed quote and timeline will be provided.
WHY CHOOSE US ?

Assured Quality
Best in class reports with high standard of research integrity

24X7 Research Support
Continuous support to ensure the best customer experience.

Free Customization
Adding more values to your product of interest.

Safe & Secure Access
Providing a secured environment for all online transactions.

Trusted by 600+ Brands
Serving the most reputed brands across the world.