
Smart Cameras Market
Smart Cameras Market Forecasts to 2030 - Global Analysis By Product (Reagents and Consumables, Instruments, Services and Other Products), Technology (Cell-based Smart Cameras and Bead-based Smart Cameras), Application, End User and By Geography

|
Years Covered |
2021-2030 |
|
Estimated Year Value (2023) |
US $3.54 BN |
|
Projected Year Value (2030) |
US $7.63 BN |
|
CAGR (2023 - 2030) |
11.57% |
|
Regions Covered |
North America, Europe, Asia Pacific, South America, and Middle East & Africa |
|
Countries Covered |
US, Canada, Mexico, Germany, UK, Italy, France, Spain, Japan, China, India, Australia, New Zealand, South Korea, Rest of Asia Pacific, South America, Argentina, Brazil, Chile, Middle East & Africa, Saudi Arabia, UAE, Qatar, and South Africa |
|
Largest Market |
North America |
|
Highest Growing Market |
Asia-Pacific |
According to Stratistics MRC, the Global Smart Cameras Market is accounted for $3.54 billion in 2023 and is expected to reach $7.63 billion by 2030 growing at a CAGR of 11.57% during the forecast period. Smart cameras, commonly referred to as intelligent cameras, are image-processing systems used to monitor industrial technology. A standalone vision system and an integrated image sensor make up the two main parts of these cameras. Intelligent cameras may be reconfigured to enhance communication, which is advantageous for image processing systems. It exemplifies the most recent advancements in camera technology, taking a lot of pictures and extracting information particular to each application. Applications for PCs and smartphones can incorporate these clever cameras. Direct sharing of photos and security is possible with smart cameras on a number of social networking sites and photo-sharing websites.
According to the India Brand Equity Foundation (IBEF), the Indian appliance and consumer electronics market was valued at US$ 10.93 billion in 2019 and is expected to reach US$ 21.18 billion by 2025.
Market Dynamics:
Driver:
Raise conscience about security and safety
Smart cameras seek to capture a video image of the area they are watching, despite being in a variety of sizes and picture quality levels. The rising use of technology in both public and private infrastructure has increased the demand for connected safety and solutions. Smart cameras have a number of benefits, including real-time property monitoring, surveillance, a complete view of the user's property, a log of all visitors, evidence against theft, and increased night-time protection. This mostly assists in providing security and safety solutions to consumers and increasing awareness of the issue.
Restraint:
Cost and affordability
The advanced features and technologies incorporated into smart cameras often come at a higher price point compared to traditional cameras. This can limit the adoption of smart cameras, particularly in price-sensitive markets or for budget-constrained consumers. Affordability is crucial for widespread market penetration and customer acceptance. To overcome this threat, market players need to focus on cost optimization, efficient manufacturing processes, and economies of scale. Continued innovation to reduce production costs, partnerships with component suppliers for cost-effective solutions, and competitive pricing strategies are essential.
Opportunity:
New smart city activities
High-quality video surveillance could help in tracking and monitoring human behavior, traffic, and other activities with the use of intelligent security cameras. Behavioral analytics and facial recognition are only two more uses for video analytics. In order to deliver real-time information, monitor traffic, and carry out other tasks, smart city projects require technologically sophisticated security cameras and video surveillance systems. The smart city projects also offer intelligent traffic and disaster warning notifications by giving quick access to crises and suspicious circumstances. The smart city initiatives also include surveillance systems that keep an eye on the roads and public areas, safeguard people, equipment, and property, and aid in criminal investigations.
Threat:
Mobile devices with a better camera
The main factor behind their rising need for smart cameras is the fact that smartphones have developed into essential daily tools. On the basis of its use and the applications it supports, the smart camera is viewed as a hybrid between a smartphone and a digital camera. Smart cameras can collect data from the number of photos taken that is pertinent to an application in addition to taking pictures. Consumers, however, are drawn to current smartphones because they have superior cameras in terms of quality and resolution.
Covid-19 Impact:
The COVID-19 pandemic has increased the demand for smart cameras in surveillance, monitoring, and contactless applications. While supply chain disruptions and budget constraints have presented challenges, the need for enhanced safety measures and remote monitoring solutions has accelerated the adoption of smart cameras. As the world recovers from the pandemic and adjusts to the new normal, the smart camera market is expected to continue growing as organizations prioritize safety, security, and efficiency in various sectors.
The lens segment is expected to be the largest during the forecast period
The lens segment held the largest share in the market owing to the increasing demand. The lens used in smart cameras can vary depending on the application and requirements. Some common types of lenses used in smart cameras include fixed focal length lenses, varifocal lenses, and zoom lenses. These lenses allow the camera to capture images with specific focal lengths or adjust the focal length as needed. Additionally, lenses may have features such as auto-focus or manual focus capabilities, image stabilization, and aperture control to further enhance image quality, which will propel the segment in the market.
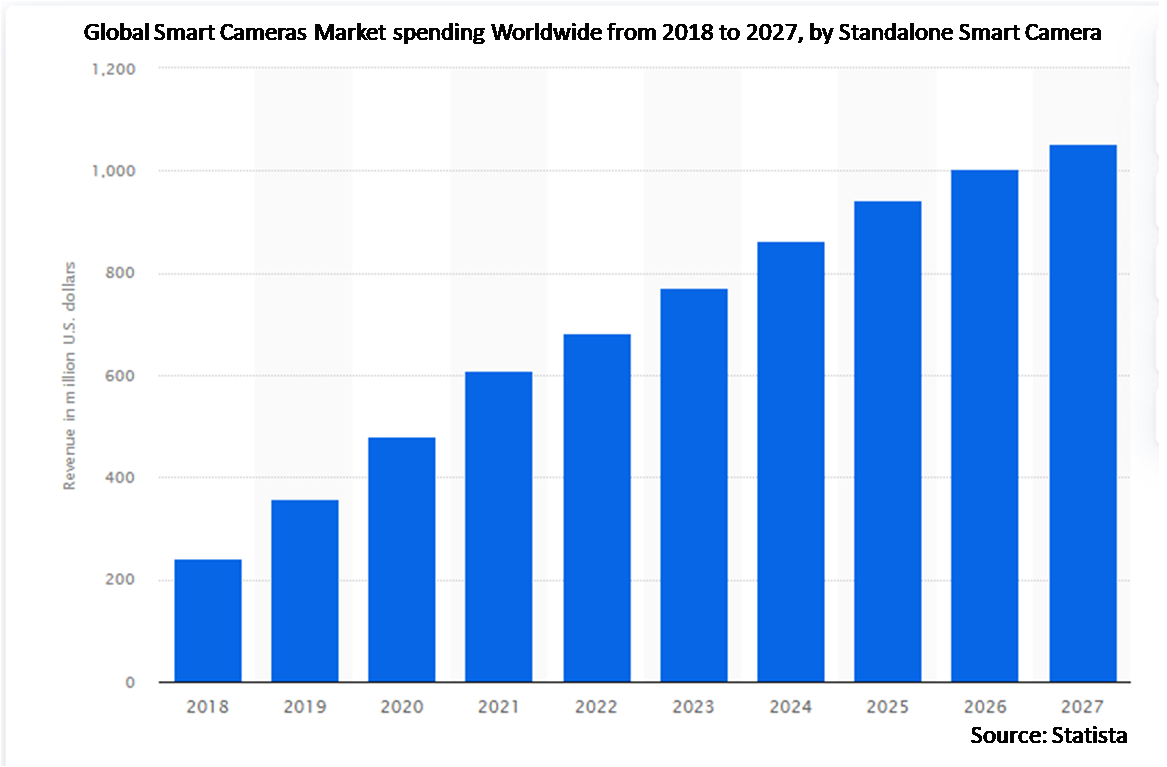
The stand-alone smart camera segment is expected to have the highest CAGR during the forecast period
During the projection period, the stand-alone smart camera segment is expected to have the greatest CAGR. Methods based on computer vision are useful for monitoring structural health, identifying damage, and measuring dynamic displacement. These cameras enable the creation of an intelligent or smart image sensor, a single hardware component that combines the image sensor and the vision system. These cameras are used to measure the safety of buildings during earthquakes, and a novel stand-alone smart camera system was created to measure inter-story drifts. The proposed system consists of two accelerometers, each with a microcontroller, a single camera, and a single-board computer.
Region with largest share:
The North America region market is estimated to witness the highest share of the global Smart Cameras market during the forecast period, the wide presence of the semiconductor industry, coupled with booming IoT, and heavy investments being made in the defense sector is expected to drive the North American smart camera market. Moreover, rapid advancements being made in technology coupled with increasing investments in Research and Development are anticipated to further drive the market. This is expected to have a positive influence on smart camera adoption trends.
Region with highest CAGR:
The Asia Pacific region is expected to have the highest growth rate over the forecast period. Smart camera application expansion, rising online high-tech security and swift technological advancements in this field have all had an impact on market demand. In order to meet the region's growing demand, many manufacturing companies, including Micro scan Systems Inc., Sony Corporation, Canon Inc., Nikon Corporation, Panasonic Corporation, Olympus Corporation, Polaroid Corporation, Vision Components GmbH, and XIMEA GmbH, are working arduously to develop novel products that are suitable for a variety of applications.

Key players in the market
Some of the key players in Smart Cameras market include Arlo, Axis Communication AB, Bosch Security Systems, Canon Inc., D-Link Corporation, FLIR Systems, Honeywell International Inc, Intellivision, Nikon Corporation, Olympus Corporation, OM Digital, Panasonic Corporation, Polaroid Corporation, Raptor Photonics Ltd., Samsung Electronics Co Ltd, Sony Corporation, Vivotek Inc and Watec Co. Ltd.
Key Developments:
In July 2022, Nikon released the LuFact ultra-compact machine vision camera to accelerate digital transformation at manufacturing sites. The product name is derived from the phrase Luminous Factory Camera and refers to a camera that dramatically improves manufacturing capabilities by illuminating previously unseen objects
In April 2022, Canon released its first intelligent camera, the Canon PowerShot Pick, a smart photography companion. It automatically captures priceless moments, allowing us to focus on experiencing them rather than attempting to capture them manually
In March 2022, Olympus introduced the 72DL PLUSTM ultrasonic thickness gauge, which offers high-speed, precise thickness readings in a portable package. In the most difficult applications, we can confidently estimate the thickness of very thin layers thanks to quick scanning, sophisticated algorithms, and lowest-ever minimum thickness capability
Types Covered:
• Chip-Smart Camera
• Standalone Smart Camera
• PC and Network-Based Smart Camera
• Embedded System Smart Camera
Components Covered:
• Image Sensor
• Memory
• Processor
• Communication Interface
• Lens
• Display
• Other Components
Connectivities Covered:
• Bluetooth
• Wi-Fi
• Other Connectivities
Technologies Covered:
• Sensor Technology
• Scanning Technology
Applications Covered:
• Consumer Electronics
• Security and Surveillance
• Military and Defense
• Industrial
• Medical Sector
• Other Applications
Regions Covered:
• North America
o US
o Canada
o Mexico
• Europe
o Germany
o UK
o Italy
o France
o Spain
o Rest of Europe
• Asia Pacific
o Japan
o China
o India
o Australia
o New Zealand
o South Korea
o Rest of Asia Pacific
• South America
o Argentina
o Brazil
o Chile
o Rest of South America
• Middle East & Africa
o Saudi Arabia
o UAE
o Qatar
o South Africa
o Rest of Middle East & Africa
What our report offers:
- Market share assessments for the regional and country-level segments
- Strategic recommendations for the new entrants
- Covers Market data for the years 2021, 2022, 2023, 2026, and 2030
- Market Trends (Drivers, Constraints, Opportunities, Threats, Challenges, Investment Opportunities, and recommendations)
- Strategic recommendations in key business segments based on the market estimations
- Competitive landscaping mapping the key common trends
- Company profiling with detailed strategies, financials, and recent developments
- Supply chain trends mapping the latest technological advancements
Free Customization Offerings:
All the customers of this report will be entitled to receive one of the following free customization options:
• Company Profiling
o Comprehensive profiling of additional market players (up to 3)
o SWOT Analysis of key players (up to 3)
• Regional Segmentation
o Market estimations, Forecasts and CAGR of any prominent country as per the client's interest (Note: Depends on feasibility check)
• Competitive Benchmarking
Benchmarking of key players based on product portfolio, geographical presence, and strategic alliances
Table of Contents
1 Executive Summary
2 Preface
2.1 Abstract
2.2 Stake Holders
2.3 Research Scope
2.4 Research Methodology
2.4.1 Data Mining
2.4.2 Data Analysis
2.4.3 Data Validation
2.4.4 Research Approach
2.5 Research Sources
2.5.1 Primary Research Sources
2.5.2 Secondary Research Sources
2.5.3 Assumptions
3 Market Trend Analysis
3.1 Introduction
3.2 Drivers
3.3 Restraints
3.4 Opportunities
3.5 Threats
3.6 Technology Analysis
3.7 Application Analysis
3.8 Emerging Markets
3.9 Impact of Covid-19
4 Porters Five Force Analysis
4.1 Bargaining power of suppliers
4.2 Bargaining power of buyers
4.3 Threat of substitutes
4.4 Threat of new entrants
4.5 Competitive rivalry
5 Global Smart Cameras Market, By Type
5.1 Introduction
5.2 Chip-Smart Camera
5.3 Standalone Smart Camera
5.4 PC and Network-Based Smart Camera
5.5 Embedded System Smart Camera
6 Global Smart Cameras Market, By Component
6.1 Introduction
6.2 Image Sensor
6.3 Memory
6.4 Processor
6.5 Communication Interface
6.6 Lens
6.7 Display
6.8 Other Components
7 Global Smart Cameras Market, By Connectivity
7.1 Introduction
7.2 Bluetooth
7.3 Wi-Fi
7.4 Other Connectivities
8 Global Smart Cameras Market, By Technology
8.1 Introduction
8.2 Sensor Technology
8.2.1 Complementary Metal Oxide Semiconductor (CMOS) Sensors
8.2.2 Charge Couple Device (CCD) Sensors
8.3 Scanning Technology
8.3.1 Area Scan
8.3.2 Line Scan
9 Global Smart Cameras Market, By Application
9.1 Introduction
9.2 Consumer Electronics
9.3 Security and Surveillance
9.4 Military and Defense
9.5 Industrial
9.6 Medical Sector
9.7 Other Applications
10 Global Smart Cameras Market, By Geography
10.1 Introduction
10.2 North America
10.2.1 US
10.2.2 Canada
10.2.3 Mexico
10.3 Europe
10.3.1 Germany
10.3.2 UK
10.3.3 Italy
10.3.4 France
10.3.5 Spain
10.3.6 Rest of Europe
10.4 Asia Pacific
10.4.1 Japan
10.4.2 China
10.4.3 India
10.4.4 Australia
10.4.5 New Zealand
10.4.6 South Korea
10.4.7 Rest of Asia Pacific
10.5 South America
10.5.1 Argentina
10.5.2 Brazil
10.5.3 Chile
10.5.4 Rest of South America
10.6 Middle East & Africa
10.6.1 Saudi Arabia
10.6.2 UAE
10.6.3 Qatar
10.6.4 South Africa
10.6.5 Rest of Middle East & Africa
11 Key Developments
11.1 Agreements, Partnerships, Collaborations and Joint Ventures
11.2 Acquisitions & Mergers
11.3 New Product Launch
11.4 Expansions
11.5 Other Key Strategies
12 Company Profiling
12.1 Arlo
12.2 Axis Communication AB
12.3 Bosch Security Systems
12.4 Canon Inc.
12.5 D-Link Corporation
12.6 FLIR Systems
12.7 Honeywell International Inc
12.8 Intellivision
12.9 Nikon Corporation
12.10 Olympus Corporation
12.11 OM Digital
12.12 Panasonic Corporation
12.13 Polaroid Corporation
12.14 Raptor Photonics Ltd.
12.15 Samsung Electronics Co Ltd
12.16 Sony Corporation
12.17 Vivotek Inc
12.18 Watec Co. Ltd
List of Tables
1 Global Smart Cameras Market Outlook, By Region (2021-2030) ($MN)
2 Global Smart Cameras Market Outlook, By Type (2021-2030) ($MN)
3 Global Smart Cameras Market Outlook, By Chip-Smart Camera (2021-2030) ($MN)
4 Global Smart Cameras Market Outlook, By Standalone Smart Camera (2021-2030) ($MN)
5 Global Smart Cameras Market Outlook, By PC and Network-Based Smart Camera (2021-2030) ($MN)
6 Global Smart Cameras Market Outlook, By Embedded System Smart Camera (2021-2030) ($MN)
7 Global Smart Cameras Market Outlook, By Component (2021-2030) ($MN)
8 Global Smart Cameras Market Outlook, By Image Sensor (2021-2030) ($MN)
9 Global Smart Cameras Market Outlook, By Memory (2021-2030) ($MN)
10 Global Smart Cameras Market Outlook, By Processor (2021-2030) ($MN)
11 Global Smart Cameras Market Outlook, By Communication Interface (2021-2030) ($MN)
12 Global Smart Cameras Market Outlook, By Lens (2021-2030) ($MN)
13 Global Smart Cameras Market Outlook, By Display (2021-2030) ($MN)
14 Global Smart Cameras Market Outlook, By Other Components (2021-2030) ($MN)
15 Global Smart Cameras Market Outlook, By Connectivity (2021-2030) ($MN)
16 Global Smart Cameras Market Outlook, By Bluetooth (2021-2030) ($MN)
17 Global Smart Cameras Market Outlook, By Wi-Fi (2021-2030) ($MN)
18 Global Smart Cameras Market Outlook, By Other Connectivities (2021-2030) ($MN)
19 Global Smart Cameras Market Outlook, By Technology (2021-2030) ($MN)
20 Global Smart Cameras Market Outlook, By Sensor Technology (2021-2030) ($MN)
21 Global Smart Cameras Market Outlook, By Complementary Metal Oxide Semiconductor (CMOS) Sensors (2021-2030) ($MN)
22 Global Smart Cameras Market Outlook, By Charge Couple Device (CCD) Sensors (2021-2030) ($MN)
23 Global Smart Cameras Market Outlook, By Scanning Technology (2021-2030) ($MN)
24 Global Smart Cameras Market Outlook, By Area Scan (2021-2030) ($MN)
25 Global Smart Cameras Market Outlook, By Line Scan (2021-2030) ($MN)
26 Global Smart Cameras Market Outlook, By Application (2021-2030) ($MN)
27 Global Smart Cameras Market Outlook, By Consumer Electronics (2021-2030) ($MN)
28 Global Smart Cameras Market Outlook, By Security and Surveillance (2021-2030) ($MN)
29 Global Smart Cameras Market Outlook, By Military and Defense (2021-2030) ($MN)
30 Global Smart Cameras Market Outlook, By Industrial (2021-2030) ($MN)
31 Global Smart Cameras Market Outlook, By Medical Sector (2021-2030) ($MN)
32 Global Smart Cameras Market Outlook, By Other Applications (2021-2030) ($MN)
Note: Tables for North America, Europe, APAC, South America, and Middle East & Africa Regions are also represented in the same manner as above.
List of Figures
RESEARCH METHODOLOGY

We at ‘Stratistics’ opt for an extensive research approach which involves data mining, data validation, and data analysis. The various research sources include in-house repository, secondary research, competitor’s sources, social media research, client internal data, and primary research.
Our team of analysts prefers the most reliable and authenticated data sources in order to perform the comprehensive literature search. With access to most of the authenticated data bases our team highly considers the best mix of information through various sources to obtain extensive and accurate analysis.
Each report takes an average time of a month and a team of 4 industry analysts. The time may vary depending on the scope and data availability of the desired market report. The various parameters used in the market assessment are standardized in order to enhance the data accuracy.
Data Mining
The data is collected from several authenticated, reliable, paid and unpaid sources and is filtered depending on the scope & objective of the research. Our reports repository acts as an added advantage in this procedure. Data gathering from the raw material suppliers, distributors and the manufacturers is performed on a regular basis, this helps in the comprehensive understanding of the products value chain. Apart from the above mentioned sources the data is also collected from the industry consultants to ensure the objective of the study is in the right direction.
Market trends such as technological advancements, regulatory affairs, market dynamics (Drivers, Restraints, Opportunities and Challenges) are obtained from scientific journals, market related national & international associations and organizations.
Data Analysis
From the data that is collected depending on the scope & objective of the research the data is subjected for the analysis. The critical steps that we follow for the data analysis include:
- Product Lifecycle Analysis
- Competitor analysis
- Risk analysis
- Porters Analysis
- PESTEL Analysis
- SWOT Analysis
The data engineering is performed by the core industry experts considering both the Marketing Mix Modeling and the Demand Forecasting. The marketing mix modeling makes use of multiple-regression techniques to predict the optimal mix of marketing variables. Regression factor is based on a number of variables and how they relate to an outcome such as sales or profits.
Data Validation
The data validation is performed by the exhaustive primary research from the expert interviews. This includes telephonic interviews, focus groups, face to face interviews, and questionnaires to validate our research from all aspects. The industry experts we approach come from the leading firms, involved in the supply chain ranging from the suppliers, distributors to the manufacturers and consumers so as to ensure an unbiased analysis.
We are in touch with more than 15,000 industry experts with the right mix of consultants, CEO's, presidents, vice presidents, managers, experts from both supply side and demand side, executives and so on.
The data validation involves the primary research from the industry experts belonging to:
- Leading Companies
- Suppliers & Distributors
- Manufacturers
- Consumers
- Industry/Strategic Consultants
Apart from the data validation the primary research also helps in performing the fill gap research, i.e. providing solutions for the unmet needs of the research which helps in enhancing the reports quality.
For more details about research methodology, kindly write to us at info@strategymrc.com
Frequently Asked Questions
In case of any queries regarding this report, you can contact the customer service by filing the “Inquiry Before Buy” form available on the right hand side. You may also contact us through email: info@strategymrc.com or phone: +1-301-202-5929
Yes, the samples are available for all the published reports. You can request them by filling the “Request Sample” option available in this page.
Yes, you can request a sample with your specific requirements. All the customized samples will be provided as per the requirement with the real data masked.
All our reports are available in Digital PDF format. In case if you require them in any other formats, such as PPT, Excel etc you can submit a request through “Inquiry Before Buy” form available on the right hand side. You may also contact us through email: info@strategymrc.com or phone: +1-301-202-5929
We offer a free 15% customization with every purchase. This requirement can be fulfilled for both pre and post sale. You may send your customization requirements through email at info@strategymrc.com or call us on +1-301-202-5929.
We have 3 different licensing options available in electronic format.
- Single User Licence: Allows one person, typically the buyer, to have access to the ordered product. The ordered product cannot be distributed to anyone else.
- 2-5 User Licence: Allows the ordered product to be shared among a maximum of 5 people within your organisation.
- Corporate License: Allows the product to be shared among all employees of your organisation regardless of their geographical location.
All our reports are typically be emailed to you as an attachment.
To order any available report you need to register on our website. The payment can be made either through CCAvenue or PayPal payments gateways which accept all international cards.
We extend our support to 6 months post sale. A post sale customization is also provided to cover your unmet needs in the report.
Request Customization
We offer complimentary customization of up to 15% with every purchase. To share your customization requirements, feel free to email us at info@strategymrc.com or call us on +1-301-202-5929. .
Please Note: Customization within the 15% threshold is entirely free of charge. If your request exceeds this limit, we will conduct a feasibility assessment. Following that, a detailed quote and timeline will be provided.
WHY CHOOSE US ?

Assured Quality
Best in class reports with high standard of research integrity

24X7 Research Support
Continuous support to ensure the best customer experience.

Free Customization
Adding more values to your product of interest.

Safe & Secure Access
Providing a secured environment for all online transactions.

Trusted by 600+ Brands
Serving the most reputed brands across the world.