
Smartphone Rf Power Amplifier Market
Smartphone Radio Frequency (RF) Power Amplifier Market Forecasts to 2028 - Global Analysis By Type (Gallium Arsenide (GaAs), Generative Adversarial Network (GAN), Silicon-Germanium (SiGe) and Complementary Metal-Oxide Semiconductor (CMOS)), Application (iOS System Smartphone, Android System Smartphone, Comparison By Application and Other Applications) and By Geography

|
Years Covered |
2020-2028 |
|
Estimated Year Value (2022) |
US $1.7 BN |
|
Projected Year Value (2028) |
US $3.3 BN |
|
CAGR (2022 - 2028) |
11.6% |
|
Regions Covered |
North America, Europe, Asia Pacific, South America, and Middle East & Africa |
|
Countries Covered |
US, Canada, Mexico, Germany, UK, Italy, France, Spain, Japan, China, India, Australia, New Zealand, South Korea, Rest of Asia Pacific, South America, Argentina, Brazil, Chile, Middle East & Africa, Saudi Arabia, UAE, Qatar, and South Africa |
|
Largest Market |
Asia Pacific |
|
Highest Growing Market |
Asia Pacific |
According to Stratistics MRC, the Global Smartphone RF Power Amplifier Market is accounted for $1.7 billion in 2022 and is expected to reach $3.3 billion by 2028 growing at a CAGR of 11.6% during the forecast period. The power amplifier (PA) is an important transmitter component which has a significant impact on both power efficiency and linearity. These amplifiers use the power source to adjust the output signal's amplitude and take power from it. Updated conventional power amplifiers are employed in consumer electronics such as smartphones and tablets. These amplifiers are built to be incredibly durable and frequently capable of boosting the low-power signal in order to satisfy the demands of tough industrial situations.
According to IBEF, India is one of the largest growing electronics markets in the world. Indian appliance and consumer electronics (ACE) market is expected to grow at USD 400 billion between 2017-20.
Market Dynamics:
Driver:
Emergence of high-powered electronic devices
Consumer electronics have parts that are quick, timely, innovative, light, compact and energy-efficient. Silicon wafers surpasses their capacity in such electronics without suffering a significant performance. The performance of RF power amplifier technology is incredibly quick, precise and reliable. Additionally, there are RF power amplifier components like GaAs, gallium nitride (GAN), and complementary metal-oxide-semiconductors (CMOS) that are energy-efficient and small enough to incorporate into compact devices. These factors are hastening industry growth.
Restraint:
Lower profit margins
In order to achieve more efficiency, the RF Power Amplifiers in smartphones have highly complicated designs and engineering. Manufacturing of the RF power amplifiers with regard to the non-functional characteristics of the components, such as long-term reliability in the chip, package, and board, as well as the functional characteristics of the components, such as overall RF design, gain values, noise factors, and crosstalk attenuation, they are making the production process more difficult as a whole, which is seen as the main market restriction.
Opportunity:
Advanced technologies
The announcement of digital input class D audio amplifiers in recent years allowed engineers to deploy high-resolution audio for the smart home and voice-enabled applications. The miniaturization of the RF power amplifiers is intensifying in recent times, to get them integrated with the wireless technology and to further increase the energy efficiency. These elements are fuelling the market demand.
Threat:
Higher initial investments
The well-established market companies have a significant impact on the power amplifier sector. The overall expansion of the RF power amplifier market is being impacted by the demand for innovation and technology for the further development of RF power amplifiers. The larger initial investment required in light of the weakening economy is posing a problem for participants in the emerging markets, nevertheless.
Covid-19 Impact
The COVID 19 epidemic has had a significant impact on a number of industrial sectors, which are the main end markets for RF power amplifiers. The COVID 19 epidemic significantly disrupted the supply chain and production processes. The demand for medical services increased during the pandemic as they attended to the casualties and managed different measures to tackle the other medical situations.
The generative adversarial network (GAN) segment is expected to be the largest during the forecast period
The generative adversarial network (GAN) segment is estimated to have a lucrative growth. A generative model called GAN is trained utilizing the generator and discriminator neural network models. From the statistical distribution of the data, it creates data samples. They are well-known for their capacity to produce phony output data, including sounds, photos, and movies. The segment's growth is being fueled by its outstanding picture segmentation results.
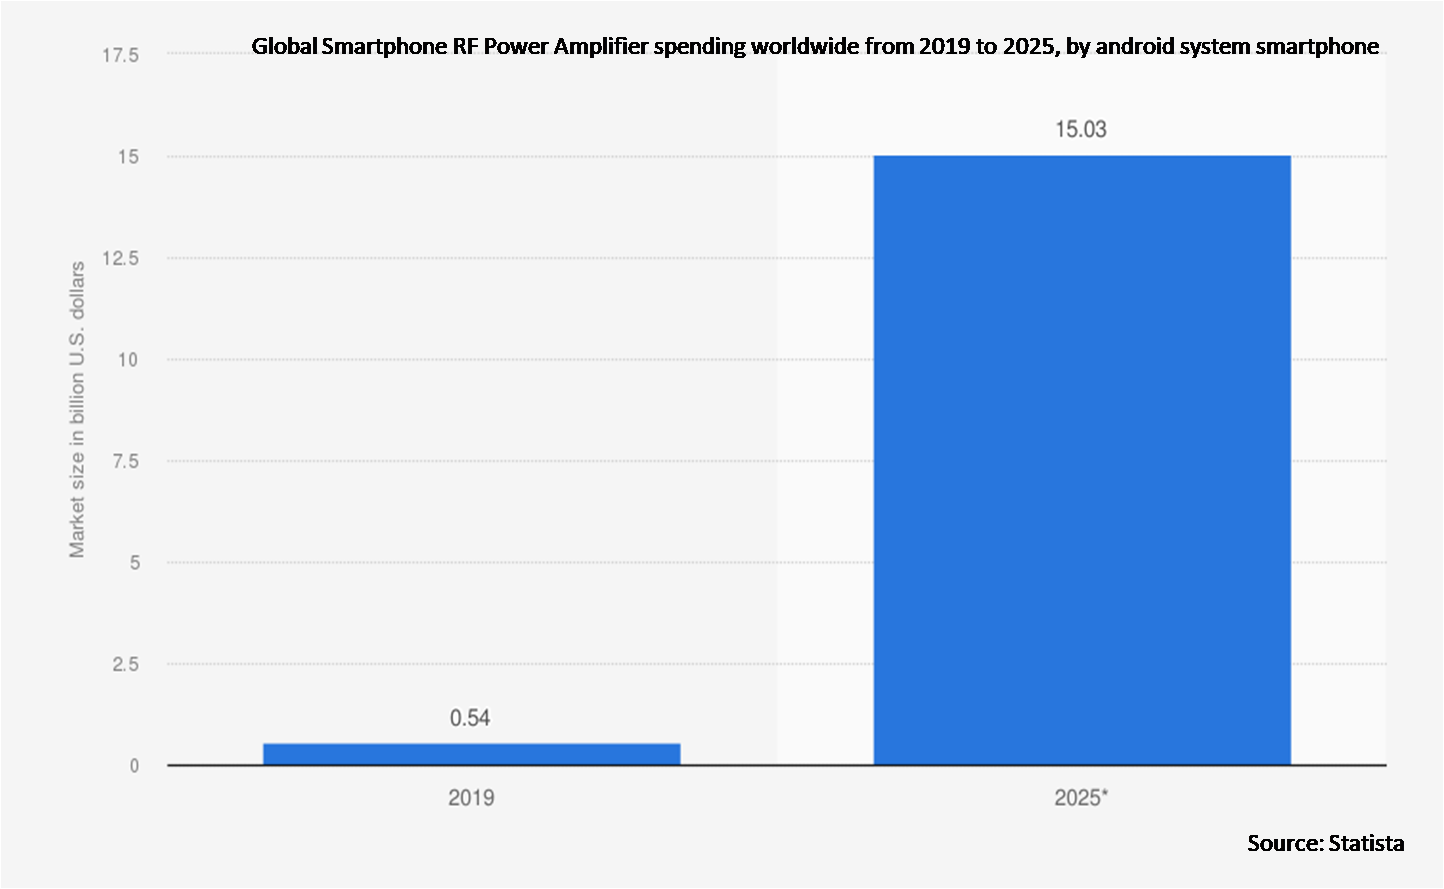
The android system smartphone segment is expected to have the highest CAGR during the forecast period
The android system smartphone segment is anticipated to witness the fastest CAGR growth during the forecast period. One of the most significant benefits of Android OS is its Open Source Operating System. In smart phones running the Android operating system, an RF power amplifier amplifies the modulated RF (Radio Frequency) signal before sending it to the antenna. The use of high-voltage audio amplifiers and speaker monitoring guarantees a better, louder, clearer audio quality.
Region with largest share:
Asia Pacific is projected to hold the largest market share during the forecast period owing to presence of prominent semiconductor industry in emerging economies. The entire functional capabilities of smartphones are rising because of the amplifiers. It has been predicted that increasing investment in the creation of technologically superior RF power amplifiers would open up profitable opportunities for manufacturers in the Asia Pacific.
Region with highest CAGR:
Asia Pacific is projected to have the highest CAGR over the forecast period. This region is facing the rapid industrial development. Governmental programs are expanding dramatically in nations like China and India. Additionally, the region's growing smart phone and consumer electronics user base is creating a significant possibility for the market's overall expansion.

Key players in the market
Some of the key players profiled in the Smartphone RF Power Amplifier Market include Texas Instruments Inc, Analog Devices Inc., API Microelectronics Ltd., Broadcom Inc., CML Microcircuits UK Ltd., Microchip Technology Inc., Empower RF Systems Inc., Infineon Technologies AG, KeyLink Microwave, MACOM Technology Solutions Holdings Inc., Mercury Systems Inc., Eliterfllc, MicroWave Technology Inc., Murata Manufacturing Co. Ltd., NXP Semiconductors NV, Qorvo Inc., QSC LLC, Qualcomm Inc., Skyworks Solutions Inc. and Aethercomm.
Key Developments:
In March 2023, Microchip Technology Inc., partnered with Avnet, a global technology solutions provider. Both the companies have co-developed methods to simplify the adoption and deployment of IoT security for developers and OEMs.
In February 2023, Texas Instruments Incorporated announced plans to build its next 300-millimeter semiconductor wafer fabrication plant (or fab) in Lehi, Utah. The new fab will be located next to the company’s existing 300-mm semiconductor wafer fab in Lehi, LFAB.
Types Covered:
• Gallium Arsenide (GaAs)
• Generative Adversarial Network (GAN)
• Silicon–Germanium (SiGe)
• Complementary Metal-Oxide Semiconductor (CMOS)
Applications Covered:
• iOS System Smartphone
• Android System Smartphone
• Comparison By Application
• Other Applications
Regions Covered:
• North America
o US
o Canada
o Mexico
• Europe
o Germany
o UK
o Italy
o France
o Spain
o Rest of Europe
• Asia Pacific
o Japan
o China
o India
o Australia
o New Zealand
o South Korea
o Rest of Asia Pacific
• South America
o Argentina
o Brazil
o Chile
o Rest of South America
• Middle East & Africa
o Saudi Arabia
o UAE
o Qatar
o South Africa
o Rest of Middle East & Africa
What our report offers:
- Market share assessments for the regional and country-level segments
- Strategic recommendations for the new entrants
- Covers Market data for the years 2020, 2021, 2022, 2025, and 2028
- Market Trends (Drivers, Constraints, Opportunities, Threats, Challenges, Investment Opportunities, and recommendations)
- Strategic recommendations in key business segments based on the market estimations
- Competitive landscaping mapping the key common trends
- Company profiling with detailed strategies, financials, and recent developments
- Supply chain trends mapping the latest technological advancements
Free Customization Offerings:
All the customers of this report will be entitled to receive one of the following free customization options:
• Company Profiling
o Comprehensive profiling of additional market players (up to 3)
o SWOT Analysis of key players (up to 3)
• Regional Segmentation
o Market estimations, Forecasts and CAGR of any prominent country as per the client's interest (Note: Depends on feasibility check)
• Competitive Benchmarking
o Benchmarking of key players based on product portfolio, geographical presence, and strategic alliances
Table of Contents
1 Executive Summary
2 Preface
2.1 Abstract
2.2 Stake Holders
2.3 Research Scope
2.4 Research Methodology
2.4.1 Data Mining
2.4.2 Data Analysis
2.4.3 Data Validation
2.4.4 Research Approach
2.5 Research Sources
2.5.1 Primary Research Sources
2.5.2 Secondary Research Sources
2.5.3 Assumptions
3 Market Trend Analysis
3.1 Introduction
3.2 Drivers
3.3 Restraints
3.4 Opportunities
3.5 Threats
3.6 Application Analysis
3.7 Emerging Markets
3.8 Impact of Covid-19
4 Porters Five Force Analysis
4.1 Bargaining power of suppliers
4.2 Bargaining power of buyers
4.3 Threat of substitutes
4.4 Threat of new entrants
4.5 Competitive rivalry
5 Global Smartphone RF Power Amplifier Market, By Type
5.1 Introduction
5.2 Gallium Arsenide (GaAs)
5.3 Generative Adversarial Network (GAN)
5.4 Silicon–Germanium (SiGe)
5.5 Complementary Metal-Oxide Semiconductor (CMOS)
6 Global Smartphone RF Power Amplifier Market, By Application
6.1 Introduction
6.2 iOS System Smartphone
6.3 Android System Smartphone
6.4 Comparison By Application
6.5 Other Applications
7 Global Smartphone RF Power Amplifier Market, By Geography
7.1 Introduction
7.2 North America
7.2.1 US
7.2.2 Canada
7.2.3 Mexico
7.3 Europe
7.3.1 Germany
7.3.2 UK
7.3.3 Italy
7.3.4 France
7.3.5 Spain
7.3.6 Rest of Europe
7.4 Asia Pacific
7.4.1 Japan
7.4.2 China
7.4.3 India
7.4.4 Australia
7.4.5 New Zealand
7.4.6 South Korea
7.4.7 Rest of Asia Pacific
7.5 South America
7.5.1 Argentina
7.5.2 Brazil
7.5.3 Chile
7.5.4 Rest of South America
7.6 Middle East & Africa
7.6.1 Saudi Arabia
7.6.2 UAE
7.6.3 Qatar
7.6.4 South Africa
7.6.5 Rest of Middle East & Africa
8 Key Developments
8.1 Agreements, Partnerships, Collaborations and Joint Ventures
8.2 Acquisitions & Mergers
8.3 New Product Launch
8.4 Expansions
8.5 Other Key Strategies
9 Company Profiling
9.1 Texas Instruments Inc
9.2 Analog Devices Inc.
9.3 API Microelectronics Ltd.
9.4 Broadcom Inc.
9.5 CML Microcircuits UK Ltd.
9.6 Microchip Technology Inc.
9.7 Empower RF Systems Inc.
9.8 Infineon Technologies AG
9.9 KeyLink Microwave
9.10 MACOM Technology Solutions Holdings Inc.
9.11 Mercury Systems Inc.
9.12 Eliterfllc
9.13 MicroWave Technology Inc.
9.14 Murata Manufacturing Co. Ltd.
9.15 NXP Semiconductors NV
9.16 Qorvo Inc.
9.17 QSC LLC
9.18 Qualcomm Inc.
9.19 Skyworks Solutions Inc.
9.20 Aethercomm
List of Tables
1 Global Smartphone RF Power Amplifier Market Outlook, By Region (2020-2028) ($MN)
2 Global Smartphone RF Power Amplifier Market Outlook, By Type (2020-2028) ($MN)
3 Global Smartphone RF Power Amplifier Market Outlook, By Gallium Arsenide (GaAs) (2020-2028) ($MN)
4 Global Smartphone RF Power Amplifier Market Outlook, By Generative Adversarial Network (GAN) (2020-2028) ($MN)
5 Global Smartphone RF Power Amplifier Market Outlook, By Silicon–Germanium (SiGe) (2020-2028) ($MN)
6 Global Smartphone RF Power Amplifier Market Outlook, By Complementary Metal-Oxide Semiconductor (CMOS) (2020-2028) ($MN)
7 Global Smartphone RF Power Amplifier Market Outlook, By Application (2020-2028) ($MN)
8 Global Smartphone RF Power Amplifier Market Outlook, By iOS System Smartphone (2020-2028) ($MN)
9 Global Smartphone RF Power Amplifier Market Outlook, By Android System Smartphone (2020-2028) ($MN)
10 Global Smartphone RF Power Amplifier Market Outlook, By Comparison By Application (2020-2028) ($MN)
11 Global Smartphone RF Power Amplifier Market Outlook, By Other Applications (2020-2028) ($MN)
12 North America Smartphone RF Power Amplifier Market Outlook, By Country (2020-2028) ($MN)
13 North America Smartphone RF Power Amplifier Market Outlook, By Type (2020-2028) ($MN)
14 North America Smartphone RF Power Amplifier Market Outlook, By Gallium Arsenide (GaAs) (2020-2028) ($MN)
15 North America Smartphone RF Power Amplifier Market Outlook, By Generative Adversarial Network (GAN) (2020-2028) ($MN)
16 North America Smartphone RF Power Amplifier Market Outlook, By Silicon–Germanium (SiGe) (2020-2028) ($MN)
17 North America Smartphone RF Power Amplifier Market Outlook, By Complementary Metal-Oxide Semiconductor (CMOS) (2020-2028) ($MN)
18 North America Smartphone RF Power Amplifier Market Outlook, By Application (2020-2028) ($MN)
19 North America Smartphone RF Power Amplifier Market Outlook, By iOS System Smartphone (2020-2028) ($MN)
20 North America Smartphone RF Power Amplifier Market Outlook, By Android System Smartphone (2020-2028) ($MN)
21 North America Smartphone RF Power Amplifier Market Outlook, By Comparison By Application (2020-2028) ($MN)
22 North America Smartphone RF Power Amplifier Market Outlook, By Other Applications (2020-2028) ($MN)
23 Europe Smartphone RF Power Amplifier Market Outlook, By Country (2020-2028) ($MN)
24 Europe Smartphone RF Power Amplifier Market Outlook, By Type (2020-2028) ($MN)
25 Europe Smartphone RF Power Amplifier Market Outlook, By Gallium Arsenide (GaAs) (2020-2028) ($MN)
26 Europe Smartphone RF Power Amplifier Market Outlook, By Generative Adversarial Network (GAN) (2020-2028) ($MN)
27 Europe Smartphone RF Power Amplifier Market Outlook, By Silicon–Germanium (SiGe) (2020-2028) ($MN)
28 Europe Smartphone RF Power Amplifier Market Outlook, By Complementary Metal-Oxide Semiconductor (CMOS) (2020-2028) ($MN)
29 Europe Smartphone RF Power Amplifier Market Outlook, By Application (2020-2028) ($MN)
30 Europe Smartphone RF Power Amplifier Market Outlook, By iOS System Smartphone (2020-2028) ($MN)
31 Europe Smartphone RF Power Amplifier Market Outlook, By Android System Smartphone (2020-2028) ($MN)
32 Europe Smartphone RF Power Amplifier Market Outlook, By Comparison By Application (2020-2028) ($MN)
33 Europe Smartphone RF Power Amplifier Market Outlook, By Other Applications (2020-2028) ($MN)
34 Asia Pacific Smartphone RF Power Amplifier Market Outlook, By Country (2020-2028) ($MN)
35 Asia Pacific Smartphone RF Power Amplifier Market Outlook, By Type (2020-2028) ($MN)
36 Asia Pacific Smartphone RF Power Amplifier Market Outlook, By Gallium Arsenide (GaAs) (2020-2028) ($MN)
37 Asia Pacific Smartphone RF Power Amplifier Market Outlook, By Generative Adversarial Network (GAN) (2020-2028) ($MN)
38 Asia Pacific Smartphone RF Power Amplifier Market Outlook, By Silicon–Germanium (SiGe) (2020-2028) ($MN)
39 Asia Pacific Smartphone RF Power Amplifier Market Outlook, By Complementary Metal-Oxide Semiconductor (CMOS) (2020-2028) ($MN)
40 Asia Pacific Smartphone RF Power Amplifier Market Outlook, By Application (2020-2028) ($MN)
41 Asia Pacific Smartphone RF Power Amplifier Market Outlook, By iOS System Smartphone (2020-2028) ($MN)
42 Asia Pacific Smartphone RF Power Amplifier Market Outlook, By Android System Smartphone (2020-2028) ($MN)
43 Asia Pacific Smartphone RF Power Amplifier Market Outlook, By Comparison By Application (2020-2028) ($MN)
44 Asia Pacific Smartphone RF Power Amplifier Market Outlook, By Other Applications (2020-2028) ($MN)
45 South America Smartphone RF Power Amplifier Market Outlook, By Country (2020-2028) ($MN)
46 South America Smartphone RF Power Amplifier Market Outlook, By Type (2020-2028) ($MN)
47 South America Smartphone RF Power Amplifier Market Outlook, By Gallium Arsenide (GaAs) (2020-2028) ($MN)
48 South America Smartphone RF Power Amplifier Market Outlook, By Generative Adversarial Network (GAN) (2020-2028) ($MN)
49 South America Smartphone RF Power Amplifier Market Outlook, By Silicon–Germanium (SiGe) (2020-2028) ($MN)
50 South America Smartphone RF Power Amplifier Market Outlook, By Complementary Metal-Oxide Semiconductor (CMOS) (2020-2028) ($MN)
51 South America Smartphone RF Power Amplifier Market Outlook, By Application (2020-2028) ($MN)
52 South America Smartphone RF Power Amplifier Market Outlook, By iOS System Smartphone (2020-2028) ($MN)
53 South America Smartphone RF Power Amplifier Market Outlook, By Android System Smartphone (2020-2028) ($MN)
54 South America Smartphone RF Power Amplifier Market Outlook, By Comparison By Application (2020-2028) ($MN)
55 South America Smartphone RF Power Amplifier Market Outlook, By Other Applications (2020-2028) ($MN)
56 Middle East & Africa Smartphone RF Power Amplifier Market Outlook, By Country (2020-2028) ($MN)
57 Middle East & Africa Smartphone RF Power Amplifier Market Outlook, By Type (2020-2028) ($MN)
58 Middle East & Africa Smartphone RF Power Amplifier Market Outlook, By Gallium Arsenide (GaAs) (2020-2028) ($MN)
59 Middle East & Africa Smartphone RF Power Amplifier Market Outlook, By Generative Adversarial Network (GAN) (2020-2028) ($MN)
60 Middle East & Africa Smartphone RF Power Amplifier Market Outlook, By Silicon–Germanium (SiGe) (2020-2028) ($MN)
61 Middle East & Africa Smartphone RF Power Amplifier Market Outlook, By Complementary Metal-Oxide Semiconductor (CMOS) (2020-2028) ($MN)
62 Middle East & Africa Smartphone RF Power Amplifier Market Outlook, By Application (2020-2028) ($MN)
63 Middle East & Africa Smartphone RF Power Amplifier Market Outlook, By iOS System Smartphone (2020-2028) ($MN)
64 Middle East & Africa Smartphone RF Power Amplifier Market Outlook, By Android System Smartphone (2020-2028) ($MN)
65 Middle East & Africa Smartphone RF Power Amplifier Market Outlook, By Comparison By Application (2020-2028) ($MN)
66 Middle East & Africa Smartphone RF Power Amplifier Market Outlook, By Other Applications (2020-2028) ($MN)
List of Figures
RESEARCH METHODOLOGY

We at ‘Stratistics’ opt for an extensive research approach which involves data mining, data validation, and data analysis. The various research sources include in-house repository, secondary research, competitor’s sources, social media research, client internal data, and primary research.
Our team of analysts prefers the most reliable and authenticated data sources in order to perform the comprehensive literature search. With access to most of the authenticated data bases our team highly considers the best mix of information through various sources to obtain extensive and accurate analysis.
Each report takes an average time of a month and a team of 4 industry analysts. The time may vary depending on the scope and data availability of the desired market report. The various parameters used in the market assessment are standardized in order to enhance the data accuracy.
Data Mining
The data is collected from several authenticated, reliable, paid and unpaid sources and is filtered depending on the scope & objective of the research. Our reports repository acts as an added advantage in this procedure. Data gathering from the raw material suppliers, distributors and the manufacturers is performed on a regular basis, this helps in the comprehensive understanding of the products value chain. Apart from the above mentioned sources the data is also collected from the industry consultants to ensure the objective of the study is in the right direction.
Market trends such as technological advancements, regulatory affairs, market dynamics (Drivers, Restraints, Opportunities and Challenges) are obtained from scientific journals, market related national & international associations and organizations.
Data Analysis
From the data that is collected depending on the scope & objective of the research the data is subjected for the analysis. The critical steps that we follow for the data analysis include:
- Product Lifecycle Analysis
- Competitor analysis
- Risk analysis
- Porters Analysis
- PESTEL Analysis
- SWOT Analysis
The data engineering is performed by the core industry experts considering both the Marketing Mix Modeling and the Demand Forecasting. The marketing mix modeling makes use of multiple-regression techniques to predict the optimal mix of marketing variables. Regression factor is based on a number of variables and how they relate to an outcome such as sales or profits.
Data Validation
The data validation is performed by the exhaustive primary research from the expert interviews. This includes telephonic interviews, focus groups, face to face interviews, and questionnaires to validate our research from all aspects. The industry experts we approach come from the leading firms, involved in the supply chain ranging from the suppliers, distributors to the manufacturers and consumers so as to ensure an unbiased analysis.
We are in touch with more than 15,000 industry experts with the right mix of consultants, CEO's, presidents, vice presidents, managers, experts from both supply side and demand side, executives and so on.
The data validation involves the primary research from the industry experts belonging to:
- Leading Companies
- Suppliers & Distributors
- Manufacturers
- Consumers
- Industry/Strategic Consultants
Apart from the data validation the primary research also helps in performing the fill gap research, i.e. providing solutions for the unmet needs of the research which helps in enhancing the reports quality.
For more details about research methodology, kindly write to us at info@strategymrc.com
Frequently Asked Questions
In case of any queries regarding this report, you can contact the customer service by filing the “Inquiry Before Buy” form available on the right hand side. You may also contact us through email: info@strategymrc.com or phone: +1-301-202-5929
Yes, the samples are available for all the published reports. You can request them by filling the “Request Sample” option available in this page.
Yes, you can request a sample with your specific requirements. All the customized samples will be provided as per the requirement with the real data masked.
All our reports are available in Digital PDF format. In case if you require them in any other formats, such as PPT, Excel etc you can submit a request through “Inquiry Before Buy” form available on the right hand side. You may also contact us through email: info@strategymrc.com or phone: +1-301-202-5929
We offer a free 15% customization with every purchase. This requirement can be fulfilled for both pre and post sale. You may send your customization requirements through email at info@strategymrc.com or call us on +1-301-202-5929.
We have 3 different licensing options available in electronic format.
- Single User Licence: Allows one person, typically the buyer, to have access to the ordered product. The ordered product cannot be distributed to anyone else.
- 2-5 User Licence: Allows the ordered product to be shared among a maximum of 5 people within your organisation.
- Corporate License: Allows the product to be shared among all employees of your organisation regardless of their geographical location.
All our reports are typically be emailed to you as an attachment.
To order any available report you need to register on our website. The payment can be made either through CCAvenue or PayPal payments gateways which accept all international cards.
We extend our support to 6 months post sale. A post sale customization is also provided to cover your unmet needs in the report.
Request Customization
We offer complimentary customization of up to 15% with every purchase. To share your customization requirements, feel free to email us at info@strategymrc.com or call us on +1-301-202-5929. .
Please Note: Customization within the 15% threshold is entirely free of charge. If your request exceeds this limit, we will conduct a feasibility assessment. Following that, a detailed quote and timeline will be provided.
WHY CHOOSE US ?

Assured Quality
Best in class reports with high standard of research integrity

24X7 Research Support
Continuous support to ensure the best customer experience.

Free Customization
Adding more values to your product of interest.

Safe & Secure Access
Providing a secured environment for all online transactions.

Trusted by 600+ Brands
Serving the most reputed brands across the world.