
Solar Ingot Wafer Market
Solar Ingot Wafer Market Forecasts to 2032 - Global Analysis By Product (Solar Ingot Wafer and Other Products), Wafer Size, Manufacturing Technology, Application, End User and By Geography

|
Years Covered |
2022-2030 |
|
Estimated Year Value (2024) |
US $48.42 BN |
|
Projected Year Value (2030) |
US $140.19 BN |
|
CAGR (2024 - 2030) |
16.4% |
|
Regions Covered |
North America, Europe, Asia Pacific, South America, and Middle East & Africa |
|
Countries Covered |
US, Canada, Mexico, Germany, UK, Italy, France, Spain, Japan, China, India, Australia, New Zealand, South Korea, Rest of Asia Pacific, South America, Argentina, Brazil, Chile, Middle East & Africa, Saudi Arabia, UAE, Qatar, and South Africa |
|
Largest Market |
Asia Pacific |
|
Highest Growing Market |
North America |
According to Stratistics MRC, the Global Solar Ingot Wafer Market is accounted for $48.42 billion in 2025 and is expected to reach $140.19 billion by 2032 growing at a CAGR of 16.4% during the forecast period. A thin slice cut from a cylindrical or rectangular block of purified silicon—known as an ingot—made by crystal growth methods is called a solar ingot wafer. The production of photovoltaic (PV) cells, which are used in solar panels, is based on these wafers. Wire saws are used to precisely cut the ingots into wafers, preserving the crystalline structure necessary for effective energy conversion. Monocrystalline and polycrystalline solar ingot wafers affect the final solar cell product's efficiency, cost, and appearance.
Market Dynamics:
Driver:
Rising global demand for renewable energy
One important renewable energy source is solar electricity, which needs efficient and reasonably priced solar ingots and wafers to make photovoltaic cells. High-quality ingots and wafers are becoming more and more necessary as solar energy adoption rises, which is driving market expansion. Demand is being further stimulated by the decreasing cost of solar panels due to technological improvements and wafer production cost reductions. The growth of the solar business is facilitated by government policies and subsidies that support renewable energy. As a result, these elements working together are driving the solar ingot wafer market to satisfy the world's expanding energy demands.
Restraint:
Trade barriers and tariffs
Price competitiveness is lowered by these additional expenses, particularly for enterprises who depend on international supply chains. Due to financial difficulty, businesses may consequently reduce production or postpone plans for expansion. In addition to interrupting cross-border trade and creating uncertainty in long-term contracts, tariffs may also lead to retaliatory actions. Innovation and market entry are restricted, especially for smaller businesses in emerging markets. All things considered, these trade limitations impede the global uptake of solar technologies and impede the achievement of renewable energy targets.
Opportunity:
Advancements in high-efficiency wafers
Solar energy systems become more economical as a result of improvements in high-efficiency wafers, which raise power conversion efficiency. The manufacturing of solar ingot wafers has increased as a result of the spike in demand for high-efficiency wafers. Improved wafer technologies make solar panels more competitive and efficient by enabling increased energy production per square metre. This has increased expenditures in solar production and infrastructure, which has sped up industry growth even more. Furthermore, advancements in production techniques and material quality help to reduce overall manufacturing costs, which promotes a wider global usage of solar energy.
Threat:
Integration of AI in manufacturing
AI-powered automation has the potential to displace workers, which would be unpopular in areas that rely on conventional labour. Operational interruptions could result from an over-reliance on AI systems, which could make them vulnerable to hacks. Because AI integration is complicated and requires system upgrades and human retraining, production schedules may be delayed. Furthermore, AI-driven optimisation can put cost effectiveness ahead of material quality, which could jeopardise wafer standards. The implementation of AI in global manufacturing contexts is further slowed down by regulatory obstacles and data privacy concerns.
Covid-19 Impact
The COVID-19 pandemic significantly disrupted the solar ingot wafer market. Global supply chains faced severe interruptions due to lockdowns, leading to shortages of raw materials and labour. Demand declined as industrial and commercial activities slowed, while economic downturns prompted governments, especially in Europe, to cut solar project budgets . In the U.S., rising construction costs and a surge in cheaper Chinese imports led companies like CubicPV to cancel wafer factory plans . Although the market began recovering post-2021, challenges persist in achieving supply chain resilience and domestic manufacturing growth.
The gallium arsenide segment is expected to be the largest during the forecast period
The gallium arsenide segment is expected to account for the largest market share during the forecast period by offering higher efficiency in solar cell production compared to traditional silicon-based wafers. Wafers based on GaAs can absorb a wider range of sunlight, which improves performance, particularly in hot conditions. They are a popular option for specialised applications since their use in concentrated photovoltaic (CPV) systems improves energy conversion efficiency. With developments in GaAs technology, the cost of manufacture has fallen, making them more accessible for large-scale solar applications. The market expansion of GaAs is further driven by the growing need for space-efficient, high-efficiency solar technologies in sectors like aerospace and defence.
The commercial & industrial segment is expected to have the highest CAGR during the forecast period
Over the forecast period, the commercial & industrial segment is predicted to witness the highest growth rate, due to the demand for large-scale solar power installations. Industries are adopting solar energy solutions to reduce operational costs and meet sustainability goals, driving the need for more solar wafers. Commercial enterprises are also increasingly investing in renewable energy as a long-term strategy to ensure energy independence and environmental responsibility. As energy efficiency becomes a higher priority, industrial sectors are adopting solar technologies at an accelerated pace. This growing shift toward solar energy in commercial and industrial applications contributes to the expansion of the market for solar ingot wafers.
Region with largest share:
During the forecast period, the Asia Pacific region is expected to hold the largest market share due to increasing investments in renewable energy and the rising demand for solar power solutions. Countries like China, India, Japan, and South Korea are major contributors, with China being the largest producer of solar wafers globally. Government incentives, technological advancements, and a push for energy sustainability are accelerating market expansion. The shift toward cleaner energy sources, coupled with cost reduction in solar manufacturing, is expected to further boost the adoption of solar wafers in the region, enhancing the overall market outlook.
Region with highest CAGR:
Over the forecast period, the North America region is anticipated to exhibit the highest CAGR, owing to increased demand for clean energy and government incentives supporting renewable energy adoption. Solar ingot wafers, essential in the production of photovoltaic cells, are gaining prominence due to their role in enhancing solar panel efficiency. Key market drivers include the expansion of solar power installations, technological advancements in wafer production, and the growing focus on energy sustainability. With major players in the U.S. and Canada investing in advanced manufacturing, the market is set to expand further in the coming years.

Key players in the market
Some of the key players profiled in the Solar Ingot Wafer Market include Yongxiang, LONGi Green Energy, GCL Technology, TCL Zhonghuan, Daqo New Energy, TBEA, JinkoSolar, JA Solar, JYT Corporation, Gokin Solar, Shuangliang Eco-Energy, Xinte Energy, Asia Silicon, East Hope Group, Wacker Chemie, OCI Company Ltd., Hemlock Semiconductor and Adani Solar.
Key Developments:
In February 2025, LONGi signed a strategic cooperation agreement with Energy 3000 Solar GmbH, a European PV product distributor, to supply another 100MW of Hi-MO X10 modules following a previous 1.5GW framework. This agreement aims to promote high-value HPBC 2.0 products in the European market and support renewable energy development and the energy transition
In May 2024, LONGi launched the Hi-MO X6 Max series modules at its Jiaxing facility, entering mass production in Q2 2024 with expected annual production exceeding 30GW by Q3 2024. These modules use standardized rectangular 72-cell silicon wafers (M11 size: 182.2mm x 191.6mm) and feature TaiRay Inside and Hybrid Passivated Back Contact (HPBC) technologies for improved stability and efficiency.
Products Covered:
• Monocrystalline Silicon
• Multicrystalline Silicon
• Gallium Arsenide
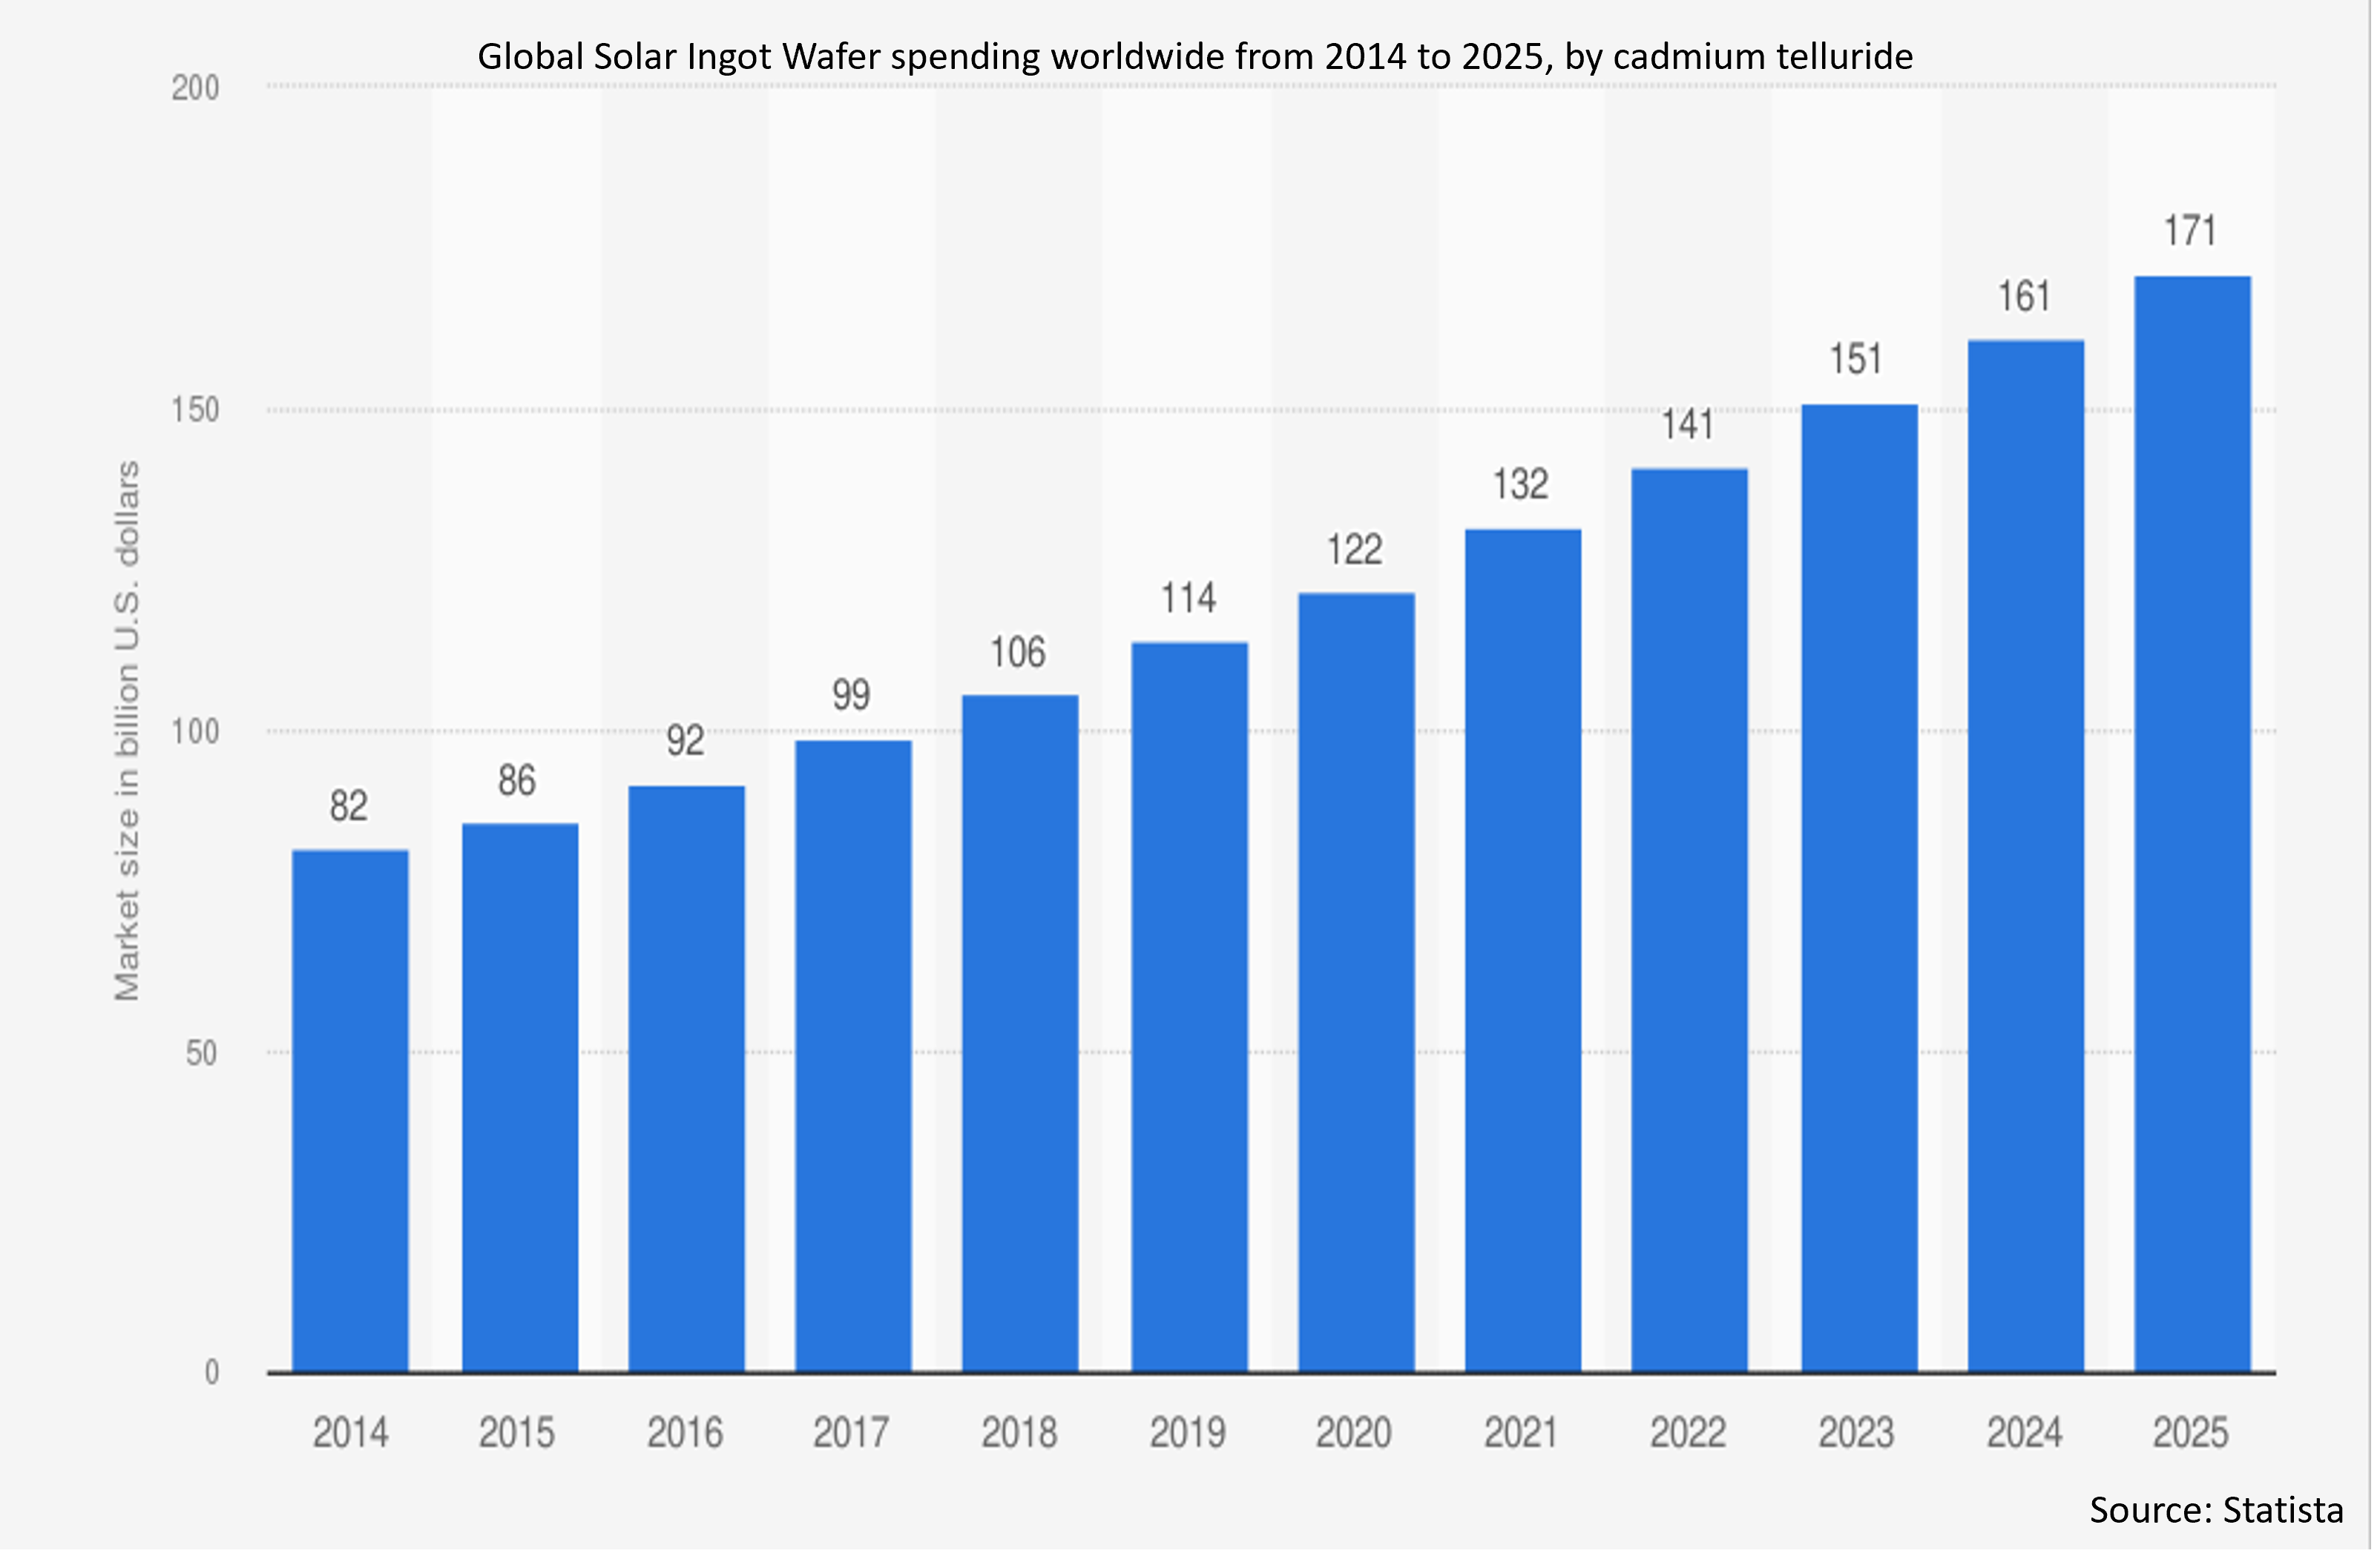
• Cadmium Telluride
• Other Products
Wafer Sizes Covered:
• ?125 mm
• 156 mm
• 166 mm
• 182 mm
• 210 mm
• ?210 mm
Manufacturing Technologies Covered:
• Czochralski (CZ) Method
• Float Zone (FZ) Method
• Directional Solidification
• Other Manufacturing Technologies
Applications Covered:
• Retail Pharmacy
• Online Sales
• Supermarkets & Hypermarkets
• Other Distribution Channels
Applications Covered:
• Solar Photovoltaic Cells
• Concentrated Solar Power Systems
• Solar Panels for Residential Use
• Solar Panels for Commercial Use
• Utility-Scale Solar Power Projects
• Other Applications
End Users Covered:
• Residential
• Commercial & Industrial
• Utility
• Other End Users
Regions Covered:
• North America
o US
o Canada
o Mexico
• Europe
o Germany
o UK
o Italy
o France
o Spain
o Rest of Europe
• Asia Pacific
o Japan
o China
o India
o Australia
o New Zealand
o South Korea
o Rest of Asia Pacific
• South America
o Argentina
o Brazil
o Chile
o Rest of South America
• Middle East & Africa
o Saudi Arabia
o UAE
o Qatar
o South Africa
o Rest of Middle East & Africa
What our report offers:
- Market share assessments for the regional and country-level segments
- Strategic recommendations for the new entrants
- Covers Market data for the years 2024, 2025, 2026, 2028, and 2032
- Market Trends (Drivers, Constraints, Opportunities, Threats, Challenges, Investment Opportunities, and recommendations)
- Strategic recommendations in key business segments based on the market estimations
- Competitive landscaping mapping the key common trends
- Company profiling with detailed strategies, financials, and recent developments
- Supply chain trends mapping the latest technological advancements
Free Customization Offerings:
All the customers of this report will be entitled to receive one of the following free customization options:
• Company Profiling
o Comprehensive profiling of additional market players (up to 3)
o SWOT Analysis of key players (up to 3)
• Regional Segmentation
o Market estimations, Forecasts and CAGR of any prominent country as per the client's interest (Note: Depends on feasibility check)
• Competitive Benchmarking
o Benchmarking of key players based on product portfolio, geographical presence, and strategic alliances
Table of Contents
1 Executive Summary
2 Preface
2.1 Abstract
2.2 Stake Holders
2.3 Research Scope
2.4 Research Methodology
2.4.1 Data Mining
2.4.2 Data Analysis
2.4.3 Data Validation
2.4.4 Research Approach
2.5 Research Sources
2.5.1 Primary Research Sources
2.5.2 Secondary Research Sources
2.5.3 Assumptions
3 Market Trend Analysis
3.1 Introduction
3.2 Drivers
3.3 Restraints
3.4 Opportunities
3.5 Threats
3.6 Product Analysis
3.7 Application Analysis
3.8 End User Analysis
3.9 Emerging Markets
3.10 Impact of Covid-19
4 Porters Five Force Analysis
4.1 Bargaining power of suppliers
4.2 Bargaining power of buyers
4.3 Threat of substitutes
4.4 Threat of new entrants
4.5 Competitive rivalry
5 Global Solar Ingot Wafer Market, By Product
5.1 Introduction
5.2 Monocrystalline Silicon
5.3 Multicrystalline Silicon
5.4 Gallium Arsenide
5.5 Cadmium Telluride
5.6 Other Products
6 Global Solar Ingot Wafer Market, By Wafer Size
6.1 Introduction
6.2 ?125 mm
6.3 156 mm
6.4 166 mm
6.5 182 mm
6.6 210 mm
6.7 ?210 mm
7 Global Solar Ingot Wafer Market, By Manufacturing Technology
7.1 Introduction
7.2 Czochralski (CZ) Method
7.3 Float Zone (FZ) Method
7.4 Directional Solidification
7.5 Other Manufacturing Technologies
8 Global Solar Ingot Wafer Market, By Application
8.1 Introduction
8.2 Solar Photovoltaic Cells
8.3 Concentrated Solar Power Systems
8.4 Solar Panels for Residential Use
8.5 Solar Panels for Commercial Use
8.6 Utility-Scale Solar Power Projects
8.7 Other Applications
9 Global Solar Ingot Wafer Market, By End User
9.1 Introduction
9.2 Residential
9.3 Commercial & Industrial
9.4 Utility
9.5 Other End Users
10 Global Solar Ingot Wafer Market, By Geography
10.1 Introduction
10.2 North America
10.2.1 US
10.2.2 Canada
10.2.3 Mexico
10.3 Europe
10.3.1 Germany
10.3.2 UK
10.3.3 Italy
10.3.4 France
10.3.5 Spain
10.3.6 Rest of Europe
10.4 Asia Pacific
10.4.1 Japan
10.4.2 China
10.4.3 India
10.4.4 Australia
10.4.5 New Zealand
10.4.6 South Korea
10.4.7 Rest of Asia Pacific
10.5 South America
10.5.1 Argentina
10.5.2 Brazil
10.5.3 Chile
10.5.4 Rest of South America
10.6 Middle East & Africa
10.6.1 Saudi Arabia
10.6.2 UAE
10.6.3 Qatar
10.6.4 South Africa
10.6.5 Rest of Middle East & Africa
11 Key Developments
11.1 Agreements, Partnerships, Collaborations and Joint Ventures
11.2 Acquisitions & Mergers
11.3 New Product Launch
11.4 Expansions
11.5 Other Key Strategies
12 Company Profiling
12.1 Yongxiang
12.2 LONGi Green Energy
12.3 GCL Technology
12.4 TCL Zhonghuan
12.5 Daqo New Energy
12.6 TBEA
12.7 JinkoSolar
12.8 JA Solar
12.9 JYT Corporation
12.10 Gokin Solar
12.11 Shuangliang Eco-Energy
12.12 Xinte Energy
12.13 Asia Silicon
12.14 East Hope Group
12.15 Wacker Chemie
12.16 OCI Company Ltd.
12.17 Hemlock Semiconductor
12.18 Adani Solar
List of Tables
1 Global Solar Ingot Wafer Market Outlook, By Region (2024-2032) ($MN)
2 Global Solar Ingot Wafer Market Outlook, By Product (2024-2032) ($MN)
3 Global Solar Ingot Wafer Market Outlook, By Monocrystalline Silicon (2024-2032) ($MN)
4 Global Solar Ingot Wafer Market Outlook, By Multicrystalline Silicon (2024-2032) ($MN)
5 Global Solar Ingot Wafer Market Outlook, By Gallium Arsenide (2024-2032) ($MN)
6 Global Solar Ingot Wafer Market Outlook, By Cadmium Telluride (2024-2032) ($MN)
7 Global Solar Ingot Wafer Market Outlook, By Other Products (2024-2032) ($MN)
8 Global Solar Ingot Wafer Market Outlook, By Wafer Size (2024-2032) ($MN)
9 Global Solar Ingot Wafer Market Outlook, By ?125 mm (2024-2032) ($MN)
10 Global Solar Ingot Wafer Market Outlook, By 156 mm (2024-2032) ($MN)
11 Global Solar Ingot Wafer Market Outlook, By 166 mm (2024-2032) ($MN)
12 Global Solar Ingot Wafer Market Outlook, By 182 mm (2024-2032) ($MN)
13 Global Solar Ingot Wafer Market Outlook, By 210 mm (2024-2032) ($MN)
14 Global Solar Ingot Wafer Market Outlook, By ?210 mm (2024-2032) ($MN)
15 Global Solar Ingot Wafer Market Outlook, By Manufacturing Technology (2024-2032) ($MN)
16 Global Solar Ingot Wafer Market Outlook, By Czochralski (CZ) Method (2024-2032) ($MN)
17 Global Solar Ingot Wafer Market Outlook, By Float Zone (FZ) Method (2024-2032) ($MN)
18 Global Solar Ingot Wafer Market Outlook, By Directional Solidification (2024-2032) ($MN)
19 Global Solar Ingot Wafer Market Outlook, By Other Manufacturing Technologies (2024-2032) ($MN)
20 Global Solar Ingot Wafer Market Outlook, By Application (2024-2032) ($MN)
21 Global Solar Ingot Wafer Market Outlook, By Solar Photovoltaic Cells (2024-2032) ($MN)
22 Global Solar Ingot Wafer Market Outlook, By Concentrated Solar Power Systems (2024-2032) ($MN)
23 Global Solar Ingot Wafer Market Outlook, By Solar Panels for Residential Use (2024-2032) ($MN)
24 Global Solar Ingot Wafer Market Outlook, By Solar Panels for Commercial Use (2024-2032) ($MN)
25 Global Solar Ingot Wafer Market Outlook, By Utility-Scale Solar Power Projects (2024-2032) ($MN)
26 Global Solar Ingot Wafer Market Outlook, By Other Applications (2024-2032) ($MN)
27 Global Solar Ingot Wafer Market Outlook, By End User (2024-2032) ($MN)
28 Global Solar Ingot Wafer Market Outlook, By Residential (2024-2032) ($MN)
29 Global Solar Ingot Wafer Market Outlook, By Commercial & Industrial (2024-2032) ($MN)
30 Global Solar Ingot Wafer Market Outlook, By Utility (2024-2032) ($MN)
31 Global Solar Ingot Wafer Market Outlook, By Other End Users (2024-2032) ($MN)
Note: Tables for North America, Europe, APAC, South America, and Middle East & Africa Regions are also represented in the same manner as above.
List of Figures
RESEARCH METHODOLOGY

We at ‘Stratistics’ opt for an extensive research approach which involves data mining, data validation, and data analysis. The various research sources include in-house repository, secondary research, competitor’s sources, social media research, client internal data, and primary research.
Our team of analysts prefers the most reliable and authenticated data sources in order to perform the comprehensive literature search. With access to most of the authenticated data bases our team highly considers the best mix of information through various sources to obtain extensive and accurate analysis.
Each report takes an average time of a month and a team of 4 industry analysts. The time may vary depending on the scope and data availability of the desired market report. The various parameters used in the market assessment are standardized in order to enhance the data accuracy.
Data Mining
The data is collected from several authenticated, reliable, paid and unpaid sources and is filtered depending on the scope & objective of the research. Our reports repository acts as an added advantage in this procedure. Data gathering from the raw material suppliers, distributors and the manufacturers is performed on a regular basis, this helps in the comprehensive understanding of the products value chain. Apart from the above mentioned sources the data is also collected from the industry consultants to ensure the objective of the study is in the right direction.
Market trends such as technological advancements, regulatory affairs, market dynamics (Drivers, Restraints, Opportunities and Challenges) are obtained from scientific journals, market related national & international associations and organizations.
Data Analysis
From the data that is collected depending on the scope & objective of the research the data is subjected for the analysis. The critical steps that we follow for the data analysis include:
- Product Lifecycle Analysis
- Competitor analysis
- Risk analysis
- Porters Analysis
- PESTEL Analysis
- SWOT Analysis
The data engineering is performed by the core industry experts considering both the Marketing Mix Modeling and the Demand Forecasting. The marketing mix modeling makes use of multiple-regression techniques to predict the optimal mix of marketing variables. Regression factor is based on a number of variables and how they relate to an outcome such as sales or profits.
Data Validation
The data validation is performed by the exhaustive primary research from the expert interviews. This includes telephonic interviews, focus groups, face to face interviews, and questionnaires to validate our research from all aspects. The industry experts we approach come from the leading firms, involved in the supply chain ranging from the suppliers, distributors to the manufacturers and consumers so as to ensure an unbiased analysis.
We are in touch with more than 15,000 industry experts with the right mix of consultants, CEO's, presidents, vice presidents, managers, experts from both supply side and demand side, executives and so on.
The data validation involves the primary research from the industry experts belonging to:
- Leading Companies
- Suppliers & Distributors
- Manufacturers
- Consumers
- Industry/Strategic Consultants
Apart from the data validation the primary research also helps in performing the fill gap research, i.e. providing solutions for the unmet needs of the research which helps in enhancing the reports quality.
For more details about research methodology, kindly write to us at info@strategymrc.com
Frequently Asked Questions
In case of any queries regarding this report, you can contact the customer service by filing the “Inquiry Before Buy” form available on the right hand side. You may also contact us through email: info@strategymrc.com or phone: +1-301-202-5929
Yes, the samples are available for all the published reports. You can request them by filling the “Request Sample” option available in this page.
Yes, you can request a sample with your specific requirements. All the customized samples will be provided as per the requirement with the real data masked.
All our reports are available in Digital PDF format. In case if you require them in any other formats, such as PPT, Excel etc you can submit a request through “Inquiry Before Buy” form available on the right hand side. You may also contact us through email: info@strategymrc.com or phone: +1-301-202-5929
We offer a free 15% customization with every purchase. This requirement can be fulfilled for both pre and post sale. You may send your customization requirements through email at info@strategymrc.com or call us on +1-301-202-5929.
We have 3 different licensing options available in electronic format.
- Single User Licence: Allows one person, typically the buyer, to have access to the ordered product. The ordered product cannot be distributed to anyone else.
- 2-5 User Licence: Allows the ordered product to be shared among a maximum of 5 people within your organisation.
- Corporate License: Allows the product to be shared among all employees of your organisation regardless of their geographical location.
All our reports are typically be emailed to you as an attachment.
To order any available report you need to register on our website. The payment can be made either through CCAvenue or PayPal payments gateways which accept all international cards.
We extend our support to 6 months post sale. A post sale customization is also provided to cover your unmet needs in the report.
Request Customization
We offer complimentary customization of up to 15% with every purchase. To share your customization requirements, feel free to email us at info@strategymrc.com or call us on +1-301-202-5929. .
Please Note: Customization within the 15% threshold is entirely free of charge. If your request exceeds this limit, we will conduct a feasibility assessment. Following that, a detailed quote and timeline will be provided.
WHY CHOOSE US ?

Assured Quality
Best in class reports with high standard of research integrity

24X7 Research Support
Continuous support to ensure the best customer experience.

Free Customization
Adding more values to your product of interest.

Safe & Secure Access
Providing a secured environment for all online transactions.

Trusted by 600+ Brands
Serving the most reputed brands across the world.