
Space Saving Smart Furniture Market
Space-Saving Smart Furniture Market Forecasts to 2034 - Global Analysis By Product Type (Smart Foldable Beds and Wall Beds, Convertible Sofa and Seating Systems, Multi-Functional Storage Furniture, Smart Modular Kitchen Units, Height-Adjustable and Motorized Desks, Expandable Dining and Work Tables, and Integrated Smart Furniture with IoT Connectivity), Material, Technology, Application, End User, and By Geography

|
Years Covered |
2023-2034 |
|
Estimated Year Value (2026) |
US $250.3 BN |
|
Projected Year Value (2034) |
US $962.3 BN |
|
CAGR (2026 - 2034) |
18.3% |
|
Regions Covered |
North America, Europe, Asia Pacific, South America, and Rest of the World (RoW) |
|
Countries Covered |
United States, Canada, Mexico, United Kingdom, Germany, France, Italy, Spain, Netherlands, Belgium, Sweden, Switzerland, Poland, Rest of Europe, China, Japan, India, South Korea, Australia, Indonesia, Thailand, Malaysia, Singapore, Vietnam, Rest of Asia Pacific, Brazil, Argentina, Colombia, Chile, Peru, Rest of South America, Saudi Arabia, United Arab Emirates, Qatar, Israel, Rest of Middle East, South Africa, Egypt, Morocco, and Rest of Africa. |
|
Largest Market |
North America |
|
Highest Growing Market |
Asia Pacific |
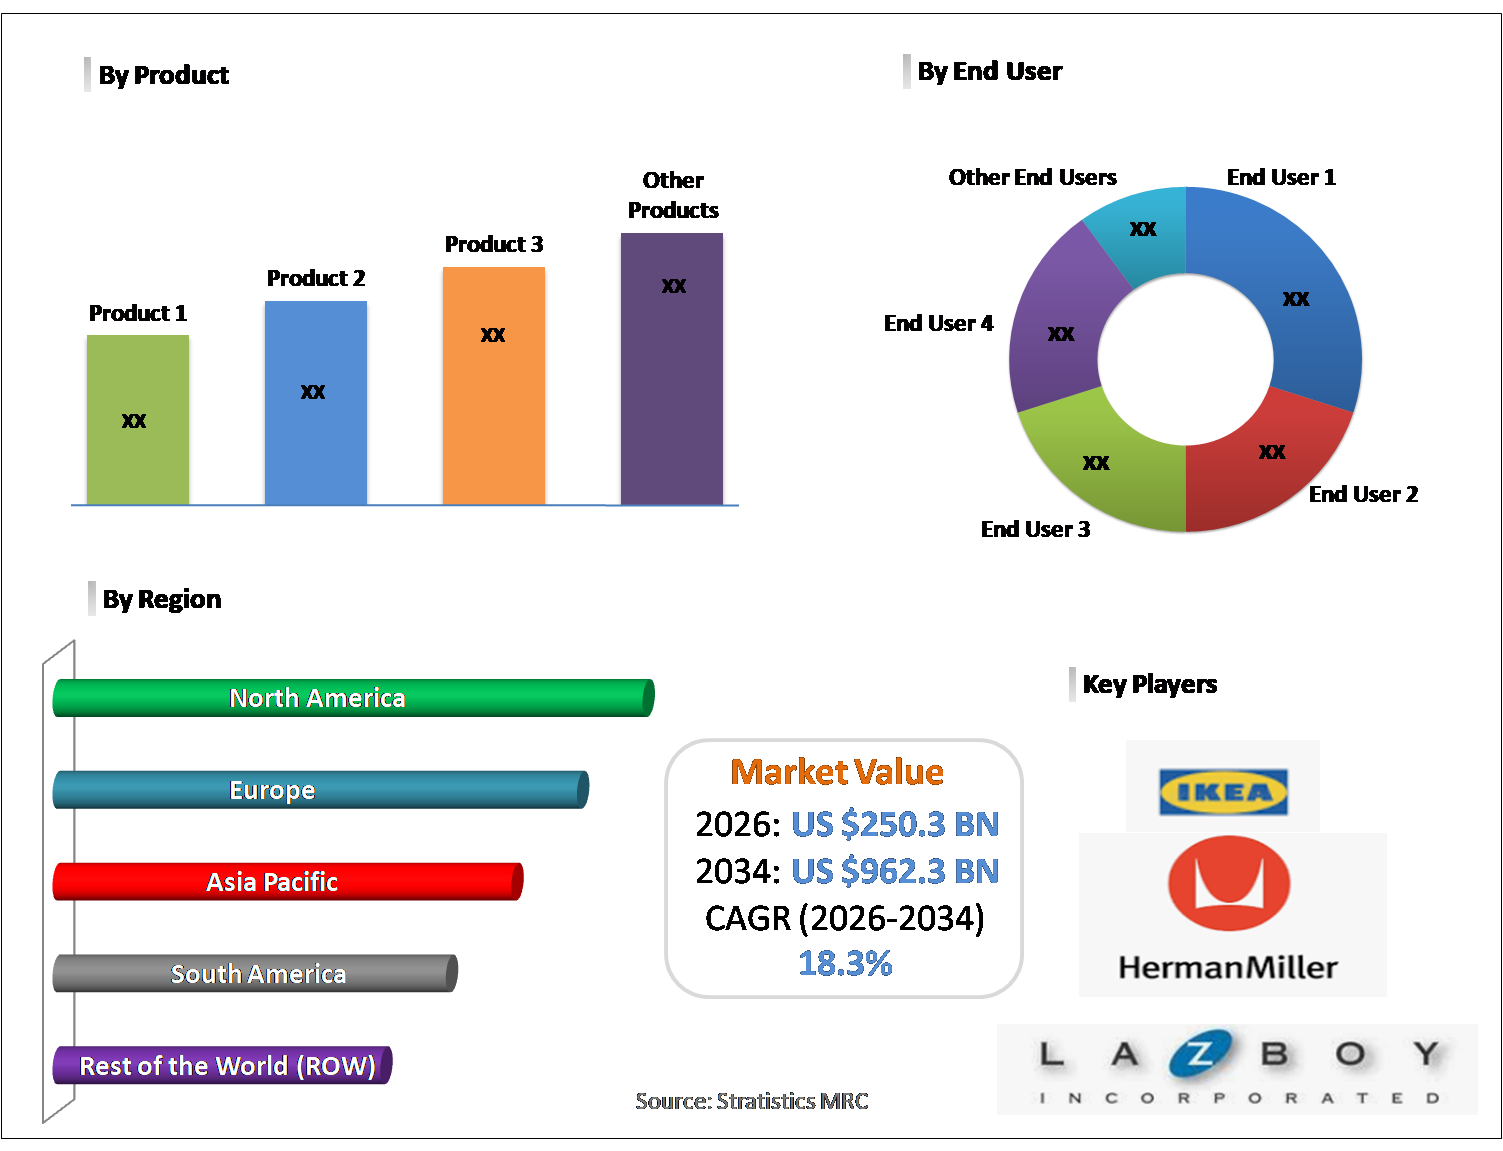
According to Stratistics MRC, the Global Space-Saving Smart Furniture Market is accounted for $250.3 billion in 2026 and is expected to reach $962.3 billion by 2034 growing at a CAGR of 18.3% during the forecast period. Space-saving smart furniture refers to innovative home furnishings designed to maximize living space while offering multifunctional features. Examples include foldable beds, modular sofas, and tables with hidden storage. Integrated with smart technology, these pieces often include sensors, automation, or connectivity to enhance convenience. They are particularly valuable in urban environments where living areas are smaller. The goal is to combine style, practicality, and technology to create adaptable furniture that improves comfort, organization, and efficiency in modern households without compromising aesthetics or usability.
Market Dynamics:
Driver:
Urbanization and compact living spaces
Urbanization and compact living spaces are significantly accelerating demand in the Space-Saving Smart Furniture Market. Rapid metropolitan expansion and rising property prices are reducing average residential unit sizes. Driven by shrinking apartment footprints and micro-living concepts, consumers are increasingly prioritizing multifunctional and modular furniture solutions. Additionally, growing disposable income among urban millennials is strengthening adoption of technology-integrated compact furnishings. Manufacturers are therefore emphasizing ergonomic engineering and automated space optimization mechanisms. Consequently, evolving urban housing dynamics continue to reinforce long-term market expansion.
Restraint:
Premium pricing of smart furniture
Premium pricing of smart furniture remains a critical barrier to mass-market penetration. Advanced features such as IoT connectivity, motorized systems, and sensor-based automation significantly elevate production costs. As a result, retail prices are substantially higher than conventional furniture alternatives. Price-sensitive consumers, particularly in emerging economies, may delay or avoid adoption. Moreover, limited consumer financing accessibility further restricts affordability. Therefore, high upfront capital expenditure constrains broader revenue realization.
Opportunity:
Integration with smart home ecosystems
Integration with smart home ecosystems presents a strong growth opportunity. Increasing smart home penetration is encouraging demand for connected and interoperable furniture solutions. Spurred by rising adoption of voice assistants and centralized automation platforms, consumers seek synchronized living environments. Compatibility with broader home automation hubs enhances product differentiation and premium positioning. Furthermore, cross-industry collaborations with IoT providers can unlock bundled solution offerings. Consequently, ecosystem-driven integration is expected to generate incremental revenue streams.
Threat:
Low-cost unorganized manufacturer competition
Low-cost unorganized manufacturer competition poses substantial pricing pressure across the market landscape. Informal players frequently offer imitation modular and foldable furniture at discounted price points. Owing to lower operational and compliance costs, these competitors rapidly penetrate price-sensitive regions. This intensifies margin compression for organized manufacturers. Additionally, inconsistent quality standards may distort overall consumer perception of the category. Therefore, structured players must prioritize brand equity and innovation to sustain competitive advantage.
Covid-19 Impact:
The COVID-19 pandemic initially disrupted supply chains and delayed manufacturing operations within the Space-Saving Smart Furniture Market. Lockdowns and logistical bottlenecks constrained short-term revenue flows. However, extended work-from-home mandates accelerated consumer investment in multifunctional home furniture. Demand for foldable beds and wall-mounted units increased as households optimized limited residential space. Moreover, e-commerce furniture sales channels experienced notable traction during confinement periods. Consequently, post-pandemic recovery strengthened long-term demand fundamentals.
The smart foldable beds and wall beds segment is expected to be the largest during the forecast period
The smart foldable beds and wall beds segment is expected to account for the largest market share during the forecast period, supported by superior space optimization efficiency. These products are highly preferred in studio apartments and compact urban residences. Integration of motorized lifting systems and app-based controls enhances convenience and user experience. Furthermore, rising real estate costs are reinforcing demand for concealed bedding solutions. Hospitality and co-living operators are also deploying such systems to maximize occupancy utilization. Consequently, this segment maintains dominant revenue contribution.
The engineered wood and MDF segment is expected to have the highest CAGR during the forecast period
Over the forecast period, the engineered wood and MDF segment is predicted to witness the highest growth rate, driven by cost efficiency and structural adaptability. These materials enable lightweight yet durable modular configurations suited for automated mechanisms. Additionally, improved finishing technologies and sustainable sourcing certifications enhance consumer acceptance. Manufacturers benefit from scalable mass production and reduced raw material costs. Growing residential and commercial deployment further strengthens demand momentum. Therefore, accelerated material substitution supports robust CAGR expansion.
Region with largest share:
During the forecast period, the North America region is expected to hold the largest market share, supported by high smart home adoption and strong consumer purchasing power. Advanced technological integration across residential infrastructure strengthens product uptake. Moreover, compact urban housing trends in major metropolitan cities stimulate multifunctional furniture demand. Established distribution networks and innovation-led product launches enhance regional competitiveness. Presence of key market participants further consolidates revenue leadership. Consequently, North America maintains dominant regional positioning.
Region with highest CAGR:
Over the forecast period, the Asia Pacific region is anticipated to exhibit the highest CAGR, driven by rapid urbanization and expanding middle-class demographics. Rising residential construction in densely populated economies accelerates compact furniture adoption. Additionally, increasing e-commerce penetration facilitates broader market accessibility. Growing awareness of smart home technologies among younger consumers further amplifies demand. Government-backed urban housing initiatives also stimulate industry growth. Therefore, Asia Pacific is projected to emerge as the fastest-growing regional market.

Key players in the market
Some of the key players in Space-Saving Smart Furniture Market include IKEA, Herman Miller, Inc., Haworth, Inc., Steelcase Inc., La-Z-Boy Incorporated, Resource Furniture, Clei S.r.l., Expand Furniture, Inter IKEA Systems B.V., BoConcept A/S, Wayfair Inc., Ashley Furniture Industries, LLC, Hafele Group, Ligne Roset, Nilkamal Limited, Godrej Interio, Dorel Industries Inc., and Transforma Furniture.
Key Developments:
In February 2026, Resource Furniture expanded its multifunctional product line with sustainable, customizable smart furniture for urban homes. The launch emphasized modular wall beds, convertible desks, and eco-friendly materials, addressing shrinking living spaces and rising demand for compact, versatile solutions.
In February 2026, Herman Miller unveiled its Fuld Nesting Chair and upgraded Nevi Sit-to-Stand desks, combining ergonomic design with space efficiency. These smart solutions enhance workplace flexibility, sustainability, and adaptability, targeting modern offices with compact layouts and evolving workstyles.
In January 2026, IKEA introduced a new line of universal smart home-compatible space-saving furniture, designed for compact living. The collection integrates foldable tables, modular storage, and multifunctional seating, offering affordability, simplicity, and seamless smart integration for urban households..
Product Types Covered:
• Smart Foldable Beds and Wall Beds
• Convertible Sofa and Seating Systems
• Multi-Functional Storage Furniture
• Smart Modular Kitchen Units
• Height-Adjustable and Motorized Desks
• Expandable Dining and Work Tables
• Integrated Smart Furniture with IoT Connectivity
Materials Covered:
• Engineered Wood and MDF
• Metal and Alloy Structures
• Composite and Lightweight Polymers
• Sustainable and Recycled Materials
• Glass and Hybrid Material Combinations
• Premium Upholstered and Fabric-Based Systems
Technologies Covered:
• IoT-Enabled Smart Furniture
• Motorized and Automated Mechanisms
• Sensor-Based Space Optimization Systems
• AI-Powered Customization Platforms
• Mobile App-Controlled Furniture Solutions
• Voice Assistant-Integrated Systems
Applications Covered:
• Studio Apartments and Micro-Housing
• Co-Living Spaces
• Urban Residential Apartments
• Home Offices
• Hospitality and Serviced Apartments
• Student Housing
End Users Covered:
• Residential Consumers
• Real Estate Developers
• Interior Designers and Architects
• Hospitality Operators
• Corporate Offices
• Property Management Companies
Regions Covered:
• North America
o United States
o Canada
o Mexico
• Europe
o United Kingdom
o Germany
o France
o Italy
o Spain
o Netherlands
o Belgium
o Sweden
o Switzerland
o Poland
o Rest of Europe
• Asia Pacific
o China
o Japan
o India
o South Korea
o Australia
o Indonesia
o Thailand
o Malaysia
o Singapore
o Vietnam
o Rest of Asia Pacific
• South America
o Brazil
o Argentina
o Colombia
o Chile
o Peru
o Rest of South America
• Rest of the World (RoW)
o Middle East
§ Saudi Arabia
§ United Arab Emirates
§ Qatar
§ Israel
§ Rest of Middle East
o Africa
§ South Africa
§ Egypt
§ Morocco
§ Rest of Africa
What our report offers:
- Market share assessments for the regional and country-level segments
- Strategic recommendations for the new entrants
- Covers Market data for the years 2023, 2024, 2025, 2026, 2027, 2028, 2030, 2032 and 2034
- Market Trends (Drivers, Constraints, Opportunities, Threats, Challenges, Investment Opportunities, and recommendations)
- Strategic recommendations in key business segments based on the market estimations
- Competitive landscaping mapping the key common trends
- Company profiling with detailed strategies, financials, and recent developments
- Supply chain trends mapping the latest technological advancements
Free Customization Offerings:
All the customers of this report will be entitled to receive one of the following free customization options:
• Company Profiling
o Comprehensive profiling of additional market players (up to 3)
o SWOT Analysis of key players (up to 3)
• Regional Segmentation
o Market estimations, Forecasts and CAGR of any prominent country as per the client's interest (Note: Depends on feasibility check)
• Competitive Benchmarking
o Benchmarking of key players based on product portfolio, geographical presence, and strategic alliances
Table of Contents
1 Executive Summary
1.1 Market Snapshot and Key Highlights
1.2 Growth Drivers, Challenges, and Opportunities
1.3 Competitive Landscape Overview
1.4 Strategic Insights and Recommendations
2 Research Framework
2.1 Study Objectives and Scope
2.2 Stakeholder Analysis
2.3 Research Assumptions and Limitations
2.4 Research Methodology
2.4.1 Data Collection (Primary and Secondary)
2.4.2 Data Modeling and Estimation Techniques
2.4.3 Data Validation and Triangulation
2.4.4 Analytical and Forecasting Approach
3 Market Dynamics and Trend Analysis
3.1 Market Definition and Structure
3.2 Key Market Drivers
3.3 Market Restraints and Challenges
3.4 Growth Opportunities and Investment Hotspots
3.5 Industry Threats and Risk Assessment
3.6 Technology and Innovation Landscape
3.7 Emerging and High-Growth Markets
3.8 Regulatory and Policy Environment
3.9 Impact of COVID-19 and Recovery Outlook
4 Competitive and Strategic Assessment
4.1 Porter's Five Forces Analysis
4.1.1 Supplier Bargaining Power
4.1.2 Buyer Bargaining Power
4.1.3 Threat of Substitutes
4.1.4 Threat of New Entrants
4.1.5 Competitive Rivalry
4.2 Market Share Analysis of Key Players
4.3 Product Benchmarking and Performance Comparison
5 Global Space-Saving Smart Furniture Market, By Product Type
5.1 Smart Foldable Beds and Wall Beds
5.2 Convertible Sofa and Seating Systems
5.3 Multi-Functional Storage Furniture
5.4 Smart Modular Kitchen Units
5.5 Height-Adjustable and Motorized Desks
5.6 Expandable Dining and Work Tables
5.7 Integrated Smart Furniture with IoT Connectivity
6 Global Space-Saving Smart Furniture Market, By Material
6.1 Engineered Wood and MDF
6.2 Metal and Alloy Structures
6.3 Composite and Lightweight Polymers
6.4 Sustainable and Recycled Materials
6.5 Glass and Hybrid Material Combinations
6.6 Premium Upholstered and Fabric-Based Systems
7 Global Space-Saving Smart Furniture Market, By Technology
7.1 IoT-Enabled Smart Furniture
7.2 Motorized and Automated Mechanisms
7.3 Sensor-Based Space Optimization Systems
7.4 AI-Powered Customization Platforms
7.5 Mobile App-Controlled Furniture Solutions
7.6 Voice Assistant-Integrated Systems
8 Global Space-Saving Smart Furniture Market, By Application
8.1 Studio Apartments and Micro-Housing
8.2 Co-Living Spaces
8.3 Urban Residential Apartments
8.4 Home Offices
8.5 Hospitality and Serviced Apartments
8.6 Student Housing
9 Global Space-Saving Smart Furniture Market, By End User
9.1 Residential Consumers
9.2 Real Estate Developers
9.3 Interior Designers and Architects
9.4 Hospitality Operators
9.5 Corporate Offices
9.6 Property Management Companies
10 Global Space-Saving Smart Furniture Market, By Geography
10.1 North America
10.1.1 United States
10.1.2 Canada
10.1.3 Mexico
10.2 Europe
10.2.1 United Kingdom
10.2.2 Germany
10.2.3 France
10.2.4 Italy
10.2.5 Spain
10.2.6 Netherlands
10.2.7 Belgium
10.2.8 Sweden
10.2.9 Switzerland
10.2.10 Poland
10.2.11 Rest of Europe
10.3 Asia Pacific
10.3.1 China
10.3.2 Japan
10.3.3 India
10.3.4 South Korea
10.3.5 Australia
10.3.6 Indonesia
10.3.7 Thailand
10.3.8 Malaysia
10.3.9 Singapore
10.3.10 Vietnam
10.3.11 Rest of Asia Pacific
10.4 South America
10.4.1 Brazil
10.4.2 Argentina
10.4.3 Colombia
10.4.4 Chile
10.4.5 Peru
10.4.6 Rest of South America
10.5 Rest of the World (RoW)
10.5.1 Middle East
10.5.1.1 Saudi Arabia
10.5.1.2 United Arab Emirates
10.5.1.3 Qatar
10.5.1.4 Israel
10.5.1.5 Rest of Middle East
10.5.2 Africa
10.5.2.1 South Africa
10.5.2.2 Egypt
10.5.2.3 Morocco
10.5.2.4 Rest of Africa
11 Strategic Market Intelligence
11.1 Industry Value Network and Supply Chain Assessment
11.2 White-Space and Opportunity Mapping
11.3 Product Evolution and Market Life Cycle Analysis
11.4 Channel, Distributor, and Go-to-Market Assessment
12 Industry Developments and Strategic Initiatives
12.1 Mergers and Acquisitions
12.2 Partnerships, Alliances, and Joint Ventures
12.3 New Product Launches and Certifications
12.4 Capacity Expansion and Investments
12.5 Other Strategic Initiatives
13 Company Profiles
13.1 IKEA
13.2 Herman Miller, Inc.
13.3 Haworth, Inc.
13.4 Steelcase Inc.
13.5 La-Z-Boy Incorporated
13.6 Resource Furniture
13.7 Clei S.r.l.
13.8 Expand Furniture
13.9 Inter IKEA Systems B.V.
13.10 BoConcept A/S
13.11 Wayfair Inc.
13.12 Ashley Furniture Industries, LLC
13.13 Hafele Group
13.14 Ligne Roset
13.15 Nilkamal Limited
13.16 Godrej Interio
13.17 Dorel Industries Inc.
13.18 Transforma Furniture
List of Tables
1 Global Space-Saving Smart Furniture Market Outlook, By Region (2023-2034) ($MN)
2 Global Space-Saving Smart Furniture Market Outlook, By Product Type (2023-2034) ($MN)
3 Global Space-Saving Smart Furniture Market Outlook, By Smart Foldable Beds and Wall Beds (2023-2034) ($MN)
4 Global Space-Saving Smart Furniture Market Outlook, By Convertible Sofa and Seating Systems (2023-2034) ($MN)
5 Global Space-Saving Smart Furniture Market Outlook, By Multi-Functional Storage Furniture (2023-2034) ($MN)
6 Global Space-Saving Smart Furniture Market Outlook, By Smart Modular Kitchen Units (2023-2034) ($MN)
7 Global Space-Saving Smart Furniture Market Outlook, By Height-Adjustable and Motorized Desks (2023-2034) ($MN)
8 Global Space-Saving Smart Furniture Market Outlook, By Expandable Dining and Work Tables (2023-2034) ($MN)
9 Global Space-Saving Smart Furniture Market Outlook, By Integrated Smart Furniture with IoT Connectivity (2023-2034) ($MN)
10 Global Space-Saving Smart Furniture Market Outlook, By Material (2023-2034) ($MN)
11 Global Space-Saving Smart Furniture Market Outlook, By Engineered Wood and MDF (2023-2034) ($MN)
12 Global Space-Saving Smart Furniture Market Outlook, By Metal and Alloy Structures (2023-2034) ($MN)
13 Global Space-Saving Smart Furniture Market Outlook, By Composite and Lightweight Polymers (2023-2034) ($MN)
14 Global Space-Saving Smart Furniture Market Outlook, By Sustainable and Recycled Materials (2023-2034) ($MN)
15 Global Space-Saving Smart Furniture Market Outlook, By Glass and Hybrid Material Combinations (2023-2034) ($MN)
16 Global Space-Saving Smart Furniture Market Outlook, By Premium Upholstered and Fabric-Based Systems (2023-2034) ($MN)
17 Global Space-Saving Smart Furniture Market Outlook, By Technology (2023-2034) ($MN)
18 Global Space-Saving Smart Furniture Market Outlook, By IoT-Enabled Smart Furniture (2023-2034) ($MN)
19 Global Space-Saving Smart Furniture Market Outlook, By Motorized and Automated Mechanisms (2023-2034) ($MN)
20 Global Space-Saving Smart Furniture Market Outlook, By Sensor-Based Space Optimization Systems (2023-2034) ($MN)
21 Global Space-Saving Smart Furniture Market Outlook, By AI-Powered Customization Platforms (2023-2034) ($MN)
22 Global Space-Saving Smart Furniture Market Outlook, By Mobile App-Controlled Furniture Solutions (2023-2034) ($MN)
23 Global Space-Saving Smart Furniture Market Outlook, By Voice Assistant-Integrated Systems (2023-2034) ($MN)
24 Global Space-Saving Smart Furniture Market Outlook, By Application (2023-2034) ($MN)
25 Global Space-Saving Smart Furniture Market Outlook, By Studio Apartments and Micro-Housing (2023-2034) ($MN)
26 Global Space-Saving Smart Furniture Market Outlook, By Co-Living Spaces (2023-2034) ($MN)
27 Global Space-Saving Smart Furniture Market Outlook, By Urban Residential Apartments (2023-2034) ($MN)
28 Global Space-Saving Smart Furniture Market Outlook, By Home Offices (2023-2034) ($MN)
29 Global Space-Saving Smart Furniture Market Outlook, By Hospitality and Serviced Apartments (2023-2034) ($MN)
30 Global Space-Saving Smart Furniture Market Outlook, By Student Housing (2023-2034) ($MN)
31 Global Space-Saving Smart Furniture Market Outlook, By End User (2023-2034) ($MN)
32 Global Space-Saving Smart Furniture Market Outlook, By Residential Consumers (2023-2034) ($MN)
33 Global Space-Saving Smart Furniture Market Outlook, By Real Estate Developers (2023-2034) ($MN)
34 Global Space-Saving Smart Furniture Market Outlook, By Interior Designers and Architects (2023-2034) ($MN)
35 Global Space-Saving Smart Furniture Market Outlook, By Hospitality Operators (2023-2034) ($MN)
36 Global Space-Saving Smart Furniture Market Outlook, By Corporate Offices (2023-2034) ($MN)
37 Global Space-Saving Smart Furniture Market Outlook, By Property Management Companies (2023-2034) ($MN)
Note: Tables for North America, Europe, APAC, South America, and Rest of the World (RoW) Regions are also represented in the same manner as above.
List of Figures
RESEARCH METHODOLOGY

We at ‘Stratistics’ opt for an extensive research approach which involves data mining, data validation, and data analysis. The various research sources include in-house repository, secondary research, competitor’s sources, social media research, client internal data, and primary research.
Our team of analysts prefers the most reliable and authenticated data sources in order to perform the comprehensive literature search. With access to most of the authenticated data bases our team highly considers the best mix of information through various sources to obtain extensive and accurate analysis.
Each report takes an average time of a month and a team of 4 industry analysts. The time may vary depending on the scope and data availability of the desired market report. The various parameters used in the market assessment are standardized in order to enhance the data accuracy.
Data Mining
The data is collected from several authenticated, reliable, paid and unpaid sources and is filtered depending on the scope & objective of the research. Our reports repository acts as an added advantage in this procedure. Data gathering from the raw material suppliers, distributors and the manufacturers is performed on a regular basis, this helps in the comprehensive understanding of the products value chain. Apart from the above mentioned sources the data is also collected from the industry consultants to ensure the objective of the study is in the right direction.
Market trends such as technological advancements, regulatory affairs, market dynamics (Drivers, Restraints, Opportunities and Challenges) are obtained from scientific journals, market related national & international associations and organizations.
Data Analysis
From the data that is collected depending on the scope & objective of the research the data is subjected for the analysis. The critical steps that we follow for the data analysis include:
- Product Lifecycle Analysis
- Competitor analysis
- Risk analysis
- Porters Analysis
- PESTEL Analysis
- SWOT Analysis
The data engineering is performed by the core industry experts considering both the Marketing Mix Modeling and the Demand Forecasting. The marketing mix modeling makes use of multiple-regression techniques to predict the optimal mix of marketing variables. Regression factor is based on a number of variables and how they relate to an outcome such as sales or profits.
Data Validation
The data validation is performed by the exhaustive primary research from the expert interviews. This includes telephonic interviews, focus groups, face to face interviews, and questionnaires to validate our research from all aspects. The industry experts we approach come from the leading firms, involved in the supply chain ranging from the suppliers, distributors to the manufacturers and consumers so as to ensure an unbiased analysis.
We are in touch with more than 15,000 industry experts with the right mix of consultants, CEO's, presidents, vice presidents, managers, experts from both supply side and demand side, executives and so on.
The data validation involves the primary research from the industry experts belonging to:
- Leading Companies
- Suppliers & Distributors
- Manufacturers
- Consumers
- Industry/Strategic Consultants
Apart from the data validation the primary research also helps in performing the fill gap research, i.e. providing solutions for the unmet needs of the research which helps in enhancing the reports quality.
For more details about research methodology, kindly write to us at info@strategymrc.com
Frequently Asked Questions
In case of any queries regarding this report, you can contact the customer service by filing the “Inquiry Before Buy” form available on the right hand side. You may also contact us through email: info@strategymrc.com or phone: +1-301-202-5929
Yes, the samples are available for all the published reports. You can request them by filling the “Request Sample” option available in this page.
Yes, you can request a sample with your specific requirements. All the customized samples will be provided as per the requirement with the real data masked.
All our reports are available in Digital PDF format. In case if you require them in any other formats, such as PPT, Excel etc you can submit a request through “Inquiry Before Buy” form available on the right hand side. You may also contact us through email: info@strategymrc.com or phone: +1-301-202-5929
We offer a free 15% customization with every purchase. This requirement can be fulfilled for both pre and post sale. You may send your customization requirements through email at info@strategymrc.com or call us on +1-301-202-5929.
We have 3 different licensing options available in electronic format.
- Single User Licence: Allows one person, typically the buyer, to have access to the ordered product. The ordered product cannot be distributed to anyone else.
- 2-5 User Licence: Allows the ordered product to be shared among a maximum of 5 people within your organisation.
- Corporate License: Allows the product to be shared among all employees of your organisation regardless of their geographical location.
All our reports are typically be emailed to you as an attachment.
To order any available report you need to register on our website. The payment can be made either through CCAvenue or PayPal payments gateways which accept all international cards.
We extend our support to 6 months post sale. A post sale customization is also provided to cover your unmet needs in the report.
Request Customization
We offer complimentary customization of up to 15% with every purchase. To share your customization requirements, feel free to email us at info@strategymrc.com or call us on +1-301-202-5929. .
Please Note: Customization within the 15% threshold is entirely free of charge. If your request exceeds this limit, we will conduct a feasibility assessment. Following that, a detailed quote and timeline will be provided.
WHY CHOOSE US ?

Assured Quality
Best in class reports with high standard of research integrity

24X7 Research Support
Continuous support to ensure the best customer experience.

Free Customization
Adding more values to your product of interest.

Safe & Secure Access
Providing a secured environment for all online transactions.

Trusted by 600+ Brands
Serving the most reputed brands across the world.