
Spectrum Analyzer Market
Spectrum Analyzer Market Forecasts to 2028 - Global Analysis By Offering (Software, Product and Other Offerings), Analyzer Type, Frequency Range, Form Factor, Network, End User and By Geography

|
Years Covered |
2020-2028 |
|
Estimated Year Value (2022) |
US $342.3 MN |
|
Projected Year Value (2028) |
US $477.3 MN |
|
CAGR (2022 - 2028) |
5.6% |
|
Regions Covered |
North America, Europe, Asia Pacific, South America, and Middle East & Africa |
|
Countries Covered |
US, Canada, Mexico, Germany, UK, Italy, France, Spain, Japan, China, India, Australia, New Zealand, South Korea, Rest of Asia Pacific, South America, Argentina, Brazil, Chile, Middle East & Africa, Saudi Arabia, UAE, Qatar, and South Africa |
|
Largest Market |
Asia Pacific |
|
Highest Growing Market |
Europe |
According to Stratistics MRC, the Global Spectrum Analyzer Market is accounted for $342.3 million in 2022 and is expected to reach $477.3 million by 2028 growing at a CAGR of 5.6% during the forecast period. Spectrum analyzers are the devices that shows signal amplitude in relation to signal frequency. Each frequency component contained in the input signal is displayed as a signal level corresponding to that frequency. Industries mostly uses it to monitor radio frequencies and audio signals. It is one of the most crucial tools in any electrical laboratory. In a variety of applications, including audio, video, communications, radar, and many more designs, it fulfils a number of functions in signal analysis. It is applied in IT & telecommunication, medical and healthcare, energy & utilities and automotive sectors.
According to WHO, cardiovascular illnesses tend to be the leading cause of death worldwide and the usage of spectrum analyzer equipment in calibrating cardiac monitoring systems is anticipated to portend well for the market
Market Dynamics:
Driver:
Increasing investments by telecommunication sector
Spectrum analyzer technology is most commonly used in the telecommunications sector. A lot of attention is being paid to offering high-quality internet services through effective analyser utilisation. In order to provide better and more expensive services, the sector is quickly increasing expenditures in this category. Investments are rising as a result of rising costs and fierce rivalry, which is further accelerating market expansion.
Restraint:
Inefficient bandwidth
A spectrum analyzer usually measures the input signal versus frequency within the full frequency range of the instrument. Due to the inefficiency in bandwidth, the network becomes lossy and the efficiency falls rapidly. It gradually affects the potential output. The network becomes slower and less stable. All these elements are hampering the growth of the market.
Opportunity:
Growing deployment of 5G technology
The telecom business is rapidly changing as a result of the development of 5G technology. Spectrum is seen as the best choice for 5G since it can transmit data at high rates and across long distances. It avails much faster speeds. Compared to 4G, it has less latency, more capacity, and more bandwidth. The market's expansion is being fuelled by these network upgrades.
Threat:
High costs
The costs of spectrum analyzers have been rising due to the use of advanced and complex technologies for testing and measuring signals. Companies across the board have been trying to implement strategies to manage the costs of such equipment. Its cost is very higher as compared to the usual conventional analyzers. These factors are hindering the growth of the market.
Covid-19 Impact
The COVID-19 outbreak resulted in significant fluctuations in the market. The growing investments by governments to support scientific progress and infrastructure, coupled with the focus on R&D and automation, have significantly influenced the spectrum analyzer market. As the spectrum analyzers are applied in various end industries, the market got affected drastically. With the post pandemic, the market is facing steady growth.
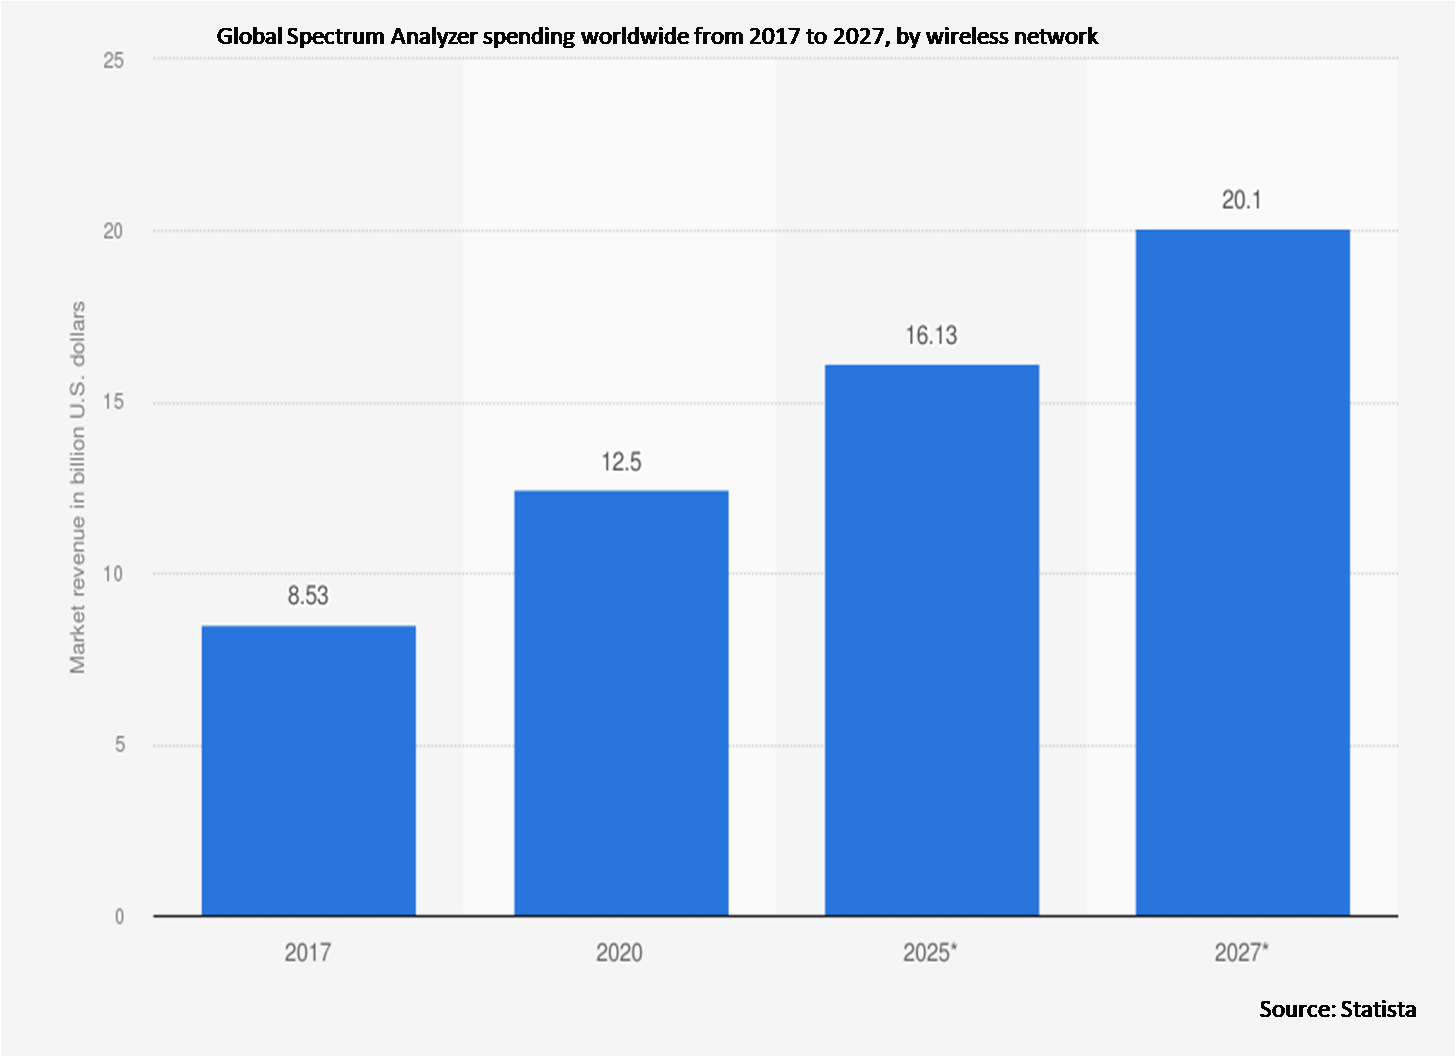
The wireless network segment is expected to be the largest during the forecast period
The wireless network segment is estimated to have a lucrative growth, due to the improvements in frequency and bandwidth. It comprises multitasking capabilities. It generates a visual display of the network data of the surrounding channels. It permits the identification of sources of interference and noise that negatively affect the performance of the consumer’s network. The increased consumer adoption of portable and handheld spectrum analyzers is driving the growth of the segment.
The medical & healthcare segment is expected to have the highest CAGR during the forecast period
The medical & healthcare segment is anticipated to witness the fastest CAGR growth during the forecast period, due to its visual representation. Basic tissue characteristics may be found by spectral analysis of ultrasonic reflections from biological tissues and it is used in differential diagnosis. It acts as signal generator in ECG, EEG and blood pressure monitors which is propelling the growth of the segment.
Region with highest share:
Asia Pacific is projected to hold the largest market share during the forecast period owing to its developing infrastructure and a growing population. The businesses are also being supported by the largely developing facilities. Growing population is causing this area to expand so dramatically. Due to the worldwide sales of automobiles and the emergence of key global manufacturing hubs in this region, the market growth is accelerating rapidly.
Region with highest CAGR:
Europe is projected to have the highest CAGR over the forecast period, owing to its raising research and development. The market's expansion has been significantly aided by the growing use of portable and hand-held spectrum analyzers for measurement across several industries in this region. The increasing demand and investments in aerospace & defense and IT & telecommunication are also the main elements in propelling the market growth in this region.

Key players in the market
Some of the key players profiled in the Spectrum Analyzer Market include Yokogawa Electric Corporation, National Instruments Corporation, Advantest Corporation, Anritsu Corporation, Teledyne Lecroy Inc, Avcom of Virginia Inc, B&K Precision Corporation, LP Technologies Inc, Cobham Plc, Stanford Research Systems Inc, Rohde & Schwarz Gmbh & Co, Keysight Technologies Inc, Giga Tronics Incorporation, Bandk Precision Corporation, Fortive Corporation, VIAVI Solutions Inc, GSAS Micro Systems Private Limited, Breeze Technologies, Eaton and Sartorius AG.
Key Developments:
In January 2023, Yokogawa Electric Corporation announced that it has made a US$10 million Series B investment* in Ideation3X Pvt Ltd, a Singapore-based venture company that is targeting the rapidly expanding integrated solid waste management (ISWM) sector in India with a process that adopts a circular economy approach. The two companies have also signed a business collaboration agreement. With this investment in the high-growth ISWM field, Yokogawa aims to develop its business in the Indian market.
In October 2022, Intelligent power management company Eaton announced the North American launch of its Open Compute Project (OCP) Open Rack v3 (ORV3) compatible solutions. This new technology is purposefully designed and preconfigured to allow for the efficient, scalable delivery of critical power for data centre customers seeking to deploy ORV3 racks. These solutions are comprised of racks, busbars, power cords and power shelves built to the latest OCP standards
In June 2022, Keysight Technologies, Inc has launched the new PathWave Advanced Design System (ADS) 2023, an integrated design and simulation software that rapidly addresses increasing design complexity and higher frequencies in the radio frequency (RF) and microwave industry.
Offerings Covered:
• Software
• Product
• Other Offerings
Analyzer Types Covered:
• Swept Tuned Analyzer
• Rf Tuning Analyzer
• Super Heterodyne Analyzer
• Vector Signal Analyzer
• Real Time Analyzer
• Fast Fourier Transform Analyzer
• Parallel Filter Analyzer
• Other Analyzer Types
Frequency Ranges Covered:
• <6 GHz
• 6 GHz-18 GHz
• >18 GHz
• Other Frequency Ranges
Form Factors Covered:
• Portable Spectrum Analyzer
• Handheld Spectrum Analyzer
• Benchtop Spectrum Analyzer
• Other Form Factors
Networks Covered:
• Wired Network
• Wireless Network
• Other Networks
End Users Covered:
• Automotive & Transportation
• Aerospace & Defense
• IT & Telecommunication
• Medical & Healthcare
• Semiconductors & Electronics
• Industrial & Energy Sector
• Educational Instititutes
• Government Sector
• Other End Users
Regions Covered:
• North America
o US
o Canada
o Mexico
• Europe
o Germany
o UK
o Italy
o France
o Spain
o Rest of Europe
• Asia Pacific
o Japan
o China
o India
o Australia
o New Zealand
o South Korea
o Rest of Asia Pacific
• South America
o Argentina
o Brazil
o Chile
o Rest of South America
• Middle East & Africa
o Saudi Arabia
o UAE
o Qatar
o South Africa
o Rest of Middle East & Africa
What our report offers:
- Market share assessments for the regional and country-level segments
- Strategic recommendations for the new entrants
- Covers Market data for the years 2020, 2021, 2022, 2025, and 2028
- Market Trends (Drivers, Constraints, Opportunities, Threats, Challenges, Investment Opportunities, and recommendations)
- Strategic recommendations in key business segments based on the market estimations
- Competitive landscaping mapping the key common trends
- Company profiling with detailed strategies, financials, and recent developments
- Supply chain trends mapping the latest technological advancements
Free Customization Offerings:
All the customers of this report will be entitled to receive one of the following free customization options:
• Company Profiling
o Comprehensive profiling of additional market players (up to 3)
o SWOT Analysis of key players (up to 3)
• Regional Segmentation
o Market estimations, Forecasts and CAGR of any prominent country as per the client's interest (Note: Depends on feasibility check)
• Competitive Benchmarking
o Benchmarking of key players based on product portfolio, geographical presence, and strategic alliances
Table of Contents
1 Executive Summary
2 Preface
2.1 Abstract
2.2 Stake Holders
2.3 Research Scope
2.4 Research Methodology
2.4.1 Data Mining
2.4.2 Data Analysis
2.4.3 Data Validation
2.4.4 Research Approach
2.5 Research Sources
2.5.1 Primary Research Sources
2.5.2 Secondary Research Sources
2.5.3 Assumptions
3 Market Trend Analysis
3.1 Introduction
3.2 Drivers
3.3 Restraints
3.4 Opportunities
3.5 Threats
3.6 End User Analysis
3.7 Emerging Markets
3.8 Impact of Covid-19
4 Porters Five Force Analysis
4.1 Bargaining power of suppliers
4.2 Bargaining power of buyers
4.3 Threat of substitutes
4.4 Threat of new entrants
4.5 Competitive rivalry
5 Global Spectrum Analyzer Market, By Offering
5.1 Introduction
5.2 Software
5.3 Product
5.4 Other Offerings
6 Global Spectrum Analyzer Market, By Analyzer Type
6.1 Introduction
6.2 Swept Tuned Analyzer
6.3 Rf Tuning Analyzer
6.4 Super Heterodyne Analyzer
6.5 Vector Signal Analyzer
6.6 Real Time Analyzer
6.7 Fast Fourier Transform Analyzer
6.8 Parallel Filter Analyzer
6.9 Other Analyzer Types
7 Global Spectrum Analyzer Market, By Frequency Range
7.1 Introduction
7.2 <6 GHz
7.3 6 GHz-18 GHz
7.4 >18 GHz
7.5 Other Frequency Ranges
8 Global Spectrum Analyzer Market, By Form Factor
8.1 Introduction
8.2 Portable Spectrum Analyzer
8.3 Handheld Spectrum Analyzer
8.4 Benchtop Spectrum Analyzer
8.5 Other Form Factors
9 Global Spectrum Analyzer Market, By Network
9.1 Introduction
9.2 Wired Network
9.3 Wireless Network
9.4 Other Networks
10 Global Spectrum Analyzer Market, By End User
10.1 Introduction
10.2 Automotive & Transportation
10.3 Aerospace & Defense
10.4 IT & Telecommunication
10.5 Medical & Healthcare
10.6 Semiconductors & Electronics
10.7 Industrial & Energy Sector
10.8 Educational Instititutes
10.9 Government Sector
10.10 Other End Users
11 Global Spectrum Analyzer Market, By Geography
11.1 Introduction
11.2 North America
11.2.1 US
11.2.2 Canada
11.2.3 Mexico
11.3 Europe
11.3.1 Germany
11.3.2 UK
11.3.3 Italy
11.3.4 France
11.3.5 Spain
11.3.6 Rest of Europe
11.4 Asia Pacific
11.4.1 Japan
11.4.2 China
11.4.3 India
11.4.4 Australia
11.4.5 New Zealand
11.4.6 South Korea
11.4.7 Rest of Asia Pacific
11.5 South America
11.5.1 Argentina
11.5.2 Brazil
11.5.3 Chile
11.5.4 Rest of South America
11.6 Middle East & Africa
11.6.1 Saudi Arabia
11.6.2 UAE
11.6.3 Qatar
11.6.4 South Africa
11.6.5 Rest of Middle East & Africa
12 Key Developments
12.1 Agreements, Partnerships, Collaborations and Joint Ventures
12.2 Acquisitions & Mergers
12.3 New Product Launch
12.4 Expansions
12.5 Other Key Strategies
13 Company Profiling
13.1 Yokogawa Electric Corporation
13.2 National Instruments Corporation
13.3 Advantest Corporation
13.4 Anritsu Corporation
13.5 Teledyne Lecroy Inc
13.6 Avcom of Virginia Inc
13.7 B&K Precision Corporation
13.8 LP Technologies Inc
13.9 Cobham Plc
13.10 Stanford Research Systems Inc
13.11 Rohde & Schwarz Gmbh & Co
13.12 Keysight Technologies Inc
13.13 Giga Tronics Incorporation
13.14 Bandk Precision Corporation
13.15 Fortive Corporation
13.16 VIAVI Solutions Inc
13.17 GSAS Micro Systems Private Limited
13.18 Breeze Technologies
13.19 Eaton
13.20 Sartorius AG
List of Tables
1 Global Spectrum Analyzer Market Outlook, By Region (2020-2028) ($MN)
2 Global Spectrum Analyzer Market Outlook, By Offering (2020-2028) ($MN)
3 Global Spectrum Analyzer Market Outlook, By Software (2020-2028) ($MN)
4 Global Spectrum Analyzer Market Outlook, By Product (2020-2028) ($MN)
5 Global Spectrum Analyzer Market Outlook, By Other Offerings (2020-2028) ($MN)
6 Global Spectrum Analyzer Market Outlook, By Analyzer Type (2020-2028) ($MN)
7 Global Spectrum Analyzer Market Outlook, By Swept Tuned Analyzer (2020-2028) ($MN)
8 Global Spectrum Analyzer Market Outlook, By Rf Tuning Analyzer (2020-2028) ($MN)
9 Global Spectrum Analyzer Market Outlook, By Super Heterodyne Analyzer (2020-2028) ($MN)
10 Global Spectrum Analyzer Market Outlook, By Vector Signal Analyzer (2020-2028) ($MN)
11 Global Spectrum Analyzer Market Outlook, By Real Time Analyzer (2020-2028) ($MN)
12 Global Spectrum Analyzer Market Outlook, By Fast Fourier Transform Analyzer (2020-2028) ($MN)
13 Global Spectrum Analyzer Market Outlook, By Parallel Filter Analyzer (2020-2028) ($MN)
14 Global Spectrum Analyzer Market Outlook, By Other Analyzer Types (2020-2028) ($MN)
15 Global Spectrum Analyzer Market Outlook, By Frequency Range (2020-2028) ($MN)
16 Global Spectrum Analyzer Market Outlook, By <6 GHz (2020-2028) ($MN)
17 Global Spectrum Analyzer Market Outlook, By 6 GHz-18 GHz (2020-2028) ($MN)
18 Global Spectrum Analyzer Market Outlook, By >18 GHz (2020-2028) ($MN)
19 Global Spectrum Analyzer Market Outlook, By Other Frequency Ranges (2020-2028) ($MN)
20 Global Spectrum Analyzer Market Outlook, By Form Factor (2020-2028) ($MN)
21 Global Spectrum Analyzer Market Outlook, By Portable Spectrum Analyzer (2020-2028) ($MN)
22 Global Spectrum Analyzer Market Outlook, By Handheld Spectrum Analyzer (2020-2028) ($MN)
23 Global Spectrum Analyzer Market Outlook, By Benchtop Spectrum Analyzer (2020-2028) ($MN)
24 Global Spectrum Analyzer Market Outlook, By Other Form Factors (2020-2028) ($MN)
25 Global Spectrum Analyzer Market Outlook, By Network (2020-2028) ($MN)
26 Global Spectrum Analyzer Market Outlook, By Wired Network (2020-2028) ($MN)
27 Global Spectrum Analyzer Market Outlook, By Wireless Network (2020-2028) ($MN)
28 Global Spectrum Analyzer Market Outlook, By Other Networks (2020-2028) ($MN)
29 Global Spectrum Analyzer Market Outlook, By End User (2020-2028) ($MN)
30 Global Spectrum Analyzer Market Outlook, By Automotive & Transportation (2020-2028) ($MN)
31 Global Spectrum Analyzer Market Outlook, By Aerospace & Defense (2020-2028) ($MN)
32 Global Spectrum Analyzer Market Outlook, By IT & Telecommunication (2020-2028) ($MN)
33 Global Spectrum Analyzer Market Outlook, By Medical & Healthcare (2020-2028) ($MN)
34 Global Spectrum Analyzer Market Outlook, By Semiconductors & Electronics (2020-2028) ($MN)
35 Global Spectrum Analyzer Market Outlook, By Industrial & Energy Sector (2020-2028) ($MN)
36 Global Spectrum Analyzer Market Outlook, By Educational Instititutes (2020-2028) ($MN)
37 Global Spectrum Analyzer Market Outlook, By Government Sector (2020-2028) ($MN)
38 Global Spectrum Analyzer Market Outlook, By Other End Users (2020-2028) ($MN)
Note: Tables for North America, Europe, APAC, South America, and Middle East & Africa Regions are also represented in the same manner as above.
List of Figures
RESEARCH METHODOLOGY

We at ‘Stratistics’ opt for an extensive research approach which involves data mining, data validation, and data analysis. The various research sources include in-house repository, secondary research, competitor’s sources, social media research, client internal data, and primary research.
Our team of analysts prefers the most reliable and authenticated data sources in order to perform the comprehensive literature search. With access to most of the authenticated data bases our team highly considers the best mix of information through various sources to obtain extensive and accurate analysis.
Each report takes an average time of a month and a team of 4 industry analysts. The time may vary depending on the scope and data availability of the desired market report. The various parameters used in the market assessment are standardized in order to enhance the data accuracy.
Data Mining
The data is collected from several authenticated, reliable, paid and unpaid sources and is filtered depending on the scope & objective of the research. Our reports repository acts as an added advantage in this procedure. Data gathering from the raw material suppliers, distributors and the manufacturers is performed on a regular basis, this helps in the comprehensive understanding of the products value chain. Apart from the above mentioned sources the data is also collected from the industry consultants to ensure the objective of the study is in the right direction.
Market trends such as technological advancements, regulatory affairs, market dynamics (Drivers, Restraints, Opportunities and Challenges) are obtained from scientific journals, market related national & international associations and organizations.
Data Analysis
From the data that is collected depending on the scope & objective of the research the data is subjected for the analysis. The critical steps that we follow for the data analysis include:
- Product Lifecycle Analysis
- Competitor analysis
- Risk analysis
- Porters Analysis
- PESTEL Analysis
- SWOT Analysis
The data engineering is performed by the core industry experts considering both the Marketing Mix Modeling and the Demand Forecasting. The marketing mix modeling makes use of multiple-regression techniques to predict the optimal mix of marketing variables. Regression factor is based on a number of variables and how they relate to an outcome such as sales or profits.
Data Validation
The data validation is performed by the exhaustive primary research from the expert interviews. This includes telephonic interviews, focus groups, face to face interviews, and questionnaires to validate our research from all aspects. The industry experts we approach come from the leading firms, involved in the supply chain ranging from the suppliers, distributors to the manufacturers and consumers so as to ensure an unbiased analysis.
We are in touch with more than 15,000 industry experts with the right mix of consultants, CEO's, presidents, vice presidents, managers, experts from both supply side and demand side, executives and so on.
The data validation involves the primary research from the industry experts belonging to:
- Leading Companies
- Suppliers & Distributors
- Manufacturers
- Consumers
- Industry/Strategic Consultants
Apart from the data validation the primary research also helps in performing the fill gap research, i.e. providing solutions for the unmet needs of the research which helps in enhancing the reports quality.
For more details about research methodology, kindly write to us at info@strategymrc.com
Frequently Asked Questions
In case of any queries regarding this report, you can contact the customer service by filing the “Inquiry Before Buy” form available on the right hand side. You may also contact us through email: info@strategymrc.com or phone: +1-301-202-5929
Yes, the samples are available for all the published reports. You can request them by filling the “Request Sample” option available in this page.
Yes, you can request a sample with your specific requirements. All the customized samples will be provided as per the requirement with the real data masked.
All our reports are available in Digital PDF format. In case if you require them in any other formats, such as PPT, Excel etc you can submit a request through “Inquiry Before Buy” form available on the right hand side. You may also contact us through email: info@strategymrc.com or phone: +1-301-202-5929
We offer a free 15% customization with every purchase. This requirement can be fulfilled for both pre and post sale. You may send your customization requirements through email at info@strategymrc.com or call us on +1-301-202-5929.
We have 3 different licensing options available in electronic format.
- Single User Licence: Allows one person, typically the buyer, to have access to the ordered product. The ordered product cannot be distributed to anyone else.
- 2-5 User Licence: Allows the ordered product to be shared among a maximum of 5 people within your organisation.
- Corporate License: Allows the product to be shared among all employees of your organisation regardless of their geographical location.
All our reports are typically be emailed to you as an attachment.
To order any available report you need to register on our website. The payment can be made either through CCAvenue or PayPal payments gateways which accept all international cards.
We extend our support to 6 months post sale. A post sale customization is also provided to cover your unmet needs in the report.
Request Customization
We offer complimentary customization of up to 15% with every purchase. To share your customization requirements, feel free to email us at info@strategymrc.com or call us on +1-301-202-5929. .
Please Note: Customization within the 15% threshold is entirely free of charge. If your request exceeds this limit, we will conduct a feasibility assessment. Following that, a detailed quote and timeline will be provided.
WHY CHOOSE US ?

Assured Quality
Best in class reports with high standard of research integrity

24X7 Research Support
Continuous support to ensure the best customer experience.

Free Customization
Adding more values to your product of interest.

Safe & Secure Access
Providing a secured environment for all online transactions.

Trusted by 600+ Brands
Serving the most reputed brands across the world.