
Surface Inspection
Surface Inspection Market Forecasts to 2030 - Global Analysis By Surface Type (2D Surface Inspection and 3D Surface Inspection), System, Deployment Type, Component, Application and By Geography

|
Years Covered |
2022-2030 |
|
Estimated Year Value (2024) |
US $4.3 BN |
|
Projected Year Value (2030) |
US $7.6 BN |
|
CAGR (2024 - 2030) |
9.8% |
|
Regions Covered |
North America, Europe, Asia Pacific, South America, and Middle East & Africa |
|
Countries Covered |
US, Canada, Mexico, Germany, UK, Italy, France, Spain, Japan, China, India, Australia, New Zealand, South Korea, Rest of Asia Pacific, South America, Argentina, Brazil, Chile, Middle East & Africa, Saudi Arabia, UAE, Qatar, and South Africa |
|
Largest Market |
North America |
|
Highest Growing Market |
Asia Pacific |
According to Stratistics MRC, the Global Surface Inspection Market is accounted for $4.3 billion in 2024 and is expected to reach $7.6 billion by 2030 growing at a CAGR of 9.8% during the forecast period. Surface inspection is an essential procedure for identifying flaws and departures from quality standards in a variety of sectors, including manufacturing, automotive, electronics, and aerospace. The intricacy and level of precision required will determine whether the technique is automated, optical, or human. Advanced imaging technologies, AI, and machine vision are used in current approaches, whilst human operators are used in traditional methods. To make sure items fulfil industry requirements, the procedure checks for surface roughness, discolouration, contamination, scratches, fractures, and dents. Automated systems increase productivity by minimizing human error and production downtime through real-time fault detection.
Market Dynamics:
Driver:
Demand for high-quality products
Industries such as automotive, electronics, and consumer goods are increasingly adopting surface inspection systems to ensure that their products meet stringent quality standards. High-precision inspection systems are essential for detecting even the smallest defects in materials and finished products, helping manufacturers maintain consistency and reliability. Additionally, the growing consumer expectation for flawless products further propels the need for advanced inspection technologies. As companies aim to enhance their brand reputation and customer satisfaction, the adoption of surface inspection systems continues to rise.
Restraint:
Complex integration with existing systems
Many manufacturers face challenges in seamlessly incorporating advanced inspection technologies into their production lines without disrupting workflow. The need for specialized skills and expertise to set up and maintain these systems can also be a barrier. Furthermore, the integration process may require significant investment in terms of time and resources, deterring some companies from adopting surface inspection solutions. Overcoming these challenges is crucial for the widespread adoption of surface inspection systems across various industries.
Opportunity:
Advancements in imaging technologies
Innovations in machine vision, artificial intelligence, and 3D imaging have led to the development of more accurate and efficient inspection systems. These advanced technologies enable better detection of surface defects, even in complex and irregular geometries. Moreover, the integration of machine learning algorithms allows for continuous improvement in inspection accuracy and reliability. As imaging technologies continue to evolve, they offer potential for enhanced automation and real-time analysis in surface inspection applications, driving market growth.
Threat:
Variability in surface types & materials
Different industries use a wide range of materials with varying textures, colors, and properties, making it challenging for inspection systems to accurately detect defects across all surfaces. Some materials may reflect light differently or have unique characteristics that complicate the inspection process. In addition, the need for customized solutions to address specific material requirements can increase the cost and complexity of implementing surface inspection systems. Addressing these challenges is essential to ensure that inspection technologies can effectively cater to diverse industrial applications.
Covid-19 Impact
The COVID-19 pandemic has had a mixed impact on the surface inspection market. On one hand, disruptions in supply chains and manufacturing processes led to a temporary slowdown in the adoption of new inspection systems. On the other hand, the increased emphasis on automation and quality control in response to the pandemic has driven demand for advanced inspection technologies. As industries recover and adapt to the new normal, the need for reliable and efficient surface inspection systems is expected to grow.
The 3D surface inspection segment is expected to be the largest during the forecast period
The 3D surface inspection segment is expected to account for the largest market share during the forecast period attributed to the superior accuracy and detail provided by 3D inspection technologies, which are essential for detecting complex surface defects. 3D surface inspection systems are widely used in industries such as automotive, aerospace, and electronics, where precision and reliability are critical. The ability to capture detailed surface topography and perform thorough analyses makes 3D inspection systems indispensable for quality control enhances the market presence.
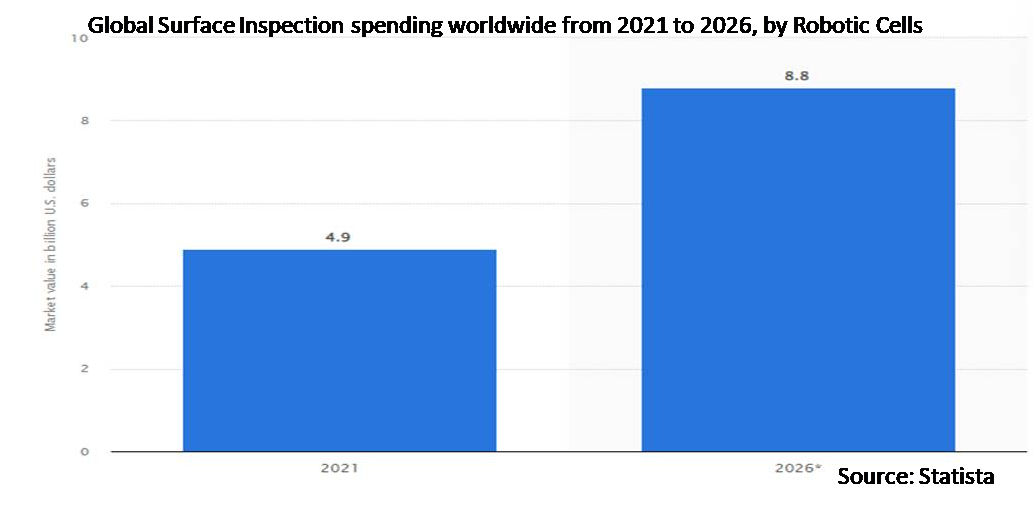
The robotic cells segment is expected to have the highest CAGR during the forecast period
Over the forecast period, the robotic cells segment is predicted to witness the highest growth rate owing to high-speed inspection processes, enhancing production efficiency. Robotic cells equipped with advanced vision systems can perform detailed inspections on complex and irregular surfaces, reducing the risk of human error. The growing adoption of automation in manufacturing processes, driven by the need for increased productivity and cost savings, supports the rapid growth of this market.
Region with largest share:
During the forecast period, the North America region is expected to hold the largest market share due to the region's well-established manufacturing industries, high adoption rate of advanced technologies, and strong focus on quality control. The presence of major market players and significant investments in research and development further contribute to North America's dominant position. Also, stringent regulatory standards and consumer expectations for high-quality products drive the demand for surface inspection systems in this region. The automotive, electronics, and aerospace industries are key contributors to the market's growth in North America.
Region with highest CAGR:
Over the forecast period, the Asia Pacific region is anticipated to exhibit the highest CAGR owing to rapid industrialization and expansion of manufacturing sectors in countries like China, India, and Japan are key drivers of market growth. The increasing adoption of automation and advanced inspection technologies in these countries supports the demand for surface inspection systems. The presence of a large consumer base and the region's role as a global manufacturing hub contribute to the high growth rate of the surface inspection market in Asia Pacific.

Key players in the market
Some of the key players in Surface Inspection market include Omron Corporation, Edmund Optics, Cognex Corporation, Baumer Inspection GmbH, AMETEK, Inc., Industrial Vision Systems Ltd., ISRA VISION GmbH, IMS Messsysteme GmbH, Keyence Corporation, KITOV Systems Ltd., Zebra Technologies Corporation, National Instruments Corporation, Panasonic Corporation, Teledyne Technologies Incorporated, Vitronic GmbH and Flir Systems.
Key Developments:
In February 2025, Teledyne Technologies Incorporated announced the successful completion of the acquisition of select aerospace and defense electronics businesses from Excelitas Technologies Corp. for approximately $710 million.
In January 2025, The Baumer Group has opened up a new subsidiary in Mexico. “As a trusted sensor solutions partner, Baumer strives to maintain very close connections with customers through its global presence.
Surface Types Covered:
• 2D Surface Inspection
• 3D Surface Inspection
Systems Covered:
• Computer-Based Systems
• Camera-Based Systems
Deployment Type Covered:
• Robotic Cells
• Traditional Systems
Components Covered:
• Software
• Hardware
• Cameras
• Lighting Equipment
• Processors
• Optics
• Frame Grabbers
• Other Components
Applications Covered:
• Automotive
• Electronics & Semiconductors
• Pharmaceuticals
• Food & Beverage
• Packaging
• Aerospace & Defense
• Textiles
• Glass & Ceramics
• Other Applications
Regions Covered:
• North America
o US
o Canada
o Mexico
• Europe
o Germany
o UK
o Italy
o France
o Spain
o Rest of Europe
• Asia Pacific
o Japan
o China
o India
o Australia
o New Zealand
o South Korea
o Rest of Asia Pacific
• South America
o Argentina
o Brazil
o Chile
o Rest of South America
• Middle East & Africa
o Saudi Arabia
o UAE
o Qatar
o South Africa
o Rest of Middle East & Africa
What our report offers:
- Market share assessments for the regional and country-level segments
- Strategic recommendations for the new entrants
- Covers Market data for the years 2022, 2023, 2024, 2026, and 2030
- Market Trends (Drivers, Constraints, Opportunities, Threats, Challenges, Investment Opportunities, and recommendations)
- Strategic recommendations in key business segments based on the market estimations
- Competitive landscaping mapping the key common trends
- Company profiling with detailed strategies, financials, and recent developments
- Supply chain trends mapping the latest technological advancements
Free Customization Offerings:
All the customers of this report will be entitled to receive one of the following free customization options:
• Company Profiling
o Comprehensive profiling of additional market players (up to 3)
o SWOT Analysis of key players (up to 3)
• Regional Segmentation
o Market estimations, Forecasts and CAGR of any prominent country as per the client's interest (Note: Depends on feasibility check)
• Competitive Benchmarking
o Benchmarking of key players based on product portfolio, geographical presence, and strategic alliances
Table of Contents
1 Executive Summary
2 Preface
2.1 Abstract
2.2 Stake Holders
2.3 Research Scope
2.4 Research Methodology
2.4.1 Data Mining
2.4.2 Data Analysis
2.4.3 Data Validation
2.4.4 Research Approach
2.5 Research Sources
2.5.1 Primary Research Sources
2.5.2 Secondary Research Sources
2.5.3 Assumptions
3 Market Trend Analysis
3.1 Introduction
3.2 Drivers
3.3 Restraints
3.4 Opportunities
3.5 Threats
3.6 Application Analysis
3.7 Emerging Markets
3.8 Impact of Covid-19
4 Porters Five Force Analysis
4.1 Bargaining power of suppliers
4.2 Bargaining power of buyers
4.3 Threat of substitutes
4.4 Threat of new entrants
4.5 Competitive rivalry
5 Global Surface Inspection Market, By Surface Type
5.1 Introduction
5.2 2D Surface Inspection
5.3 3D Surface Inspection
6 Global Surface Inspection Market, By System
6.1 Introduction
6.2 Computer-Based Systems
6.3 Camera-Based Systems
7 Global Surface Inspection Market, By Deployment Type
7.1 Introduction
7.2 Robotic Cells
7.3 Traditional Systems
8 Global Surface Inspection Market, By Component
8.1 Introduction
8.2 Software
8.3 Hardware
8.4 Cameras
8.5 Lighting Equipment
8.6 Processors
8.7 Optics
8.8 Frame Grabbers
8.9 Other Components
9 Global Surface Inspection Market, By Application
9.1 Introduction
9.2 Automotive
9.3 Electronics & Semiconductors
9.4 Pharmaceuticals
9.5 Food & Beverage
9.6 Packaging
9.7 Aerospace & Defense
9.8 Textiles
9.9 Glass & Ceramics
9.10 Other Applications
10 Global Surface Inspection Market, By Geography
10.1 Introduction
10.2 North America
10.2.1 US
10.2.2 Canada
10.2.3 Mexico
10.3 Europe
10.3.1 Germany
10.3.2 UK
10.3.3 Italy
10.3.4 France
10.3.5 Spain
10.3.6 Rest of Europe
10.4 Asia Pacific
10.4.1 Japan
10.4.2 China
10.4.3 India
10.4.4 Australia
10.4.5 New Zealand
10.4.6 South Korea
10.4.7 Rest of Asia Pacific
10.5 South America
10.5.1 Argentina
10.5.2 Brazil
10.5.3 Chile
10.5.4 Rest of South America
10.6 Middle East & Africa
10.6.1 Saudi Arabia
10.6.2 UAE
10.6.3 Qatar
10.6.4 South Africa
10.6.5 Rest of Middle East & Africa
11 Key Developments
11.1 Agreements, Partnerships, Collaborations and Joint Ventures
11.2 Acquisitions & Mergers
11.3 New Product Launch
11.4 Expansions
11.5 Other Key Strategies
12 Company Profiling
12.1 Omron Corporation
12.2 Edmund Optics
12.3 Cognex Corporation
12.4 Baumer Inspection GmbH
12.5 AMETEK, Inc.
12.6 Industrial Vision Systems Ltd.
12.7 ISRA VISION GmbH
12.8 IMS Messsysteme GmbH
12.9 Keyence Corporation
12.10 KITOV Systems Ltd.
12.11 Zebra Technologies Corporation
12.12 National Instruments Corporation
12.13 Panasonic Corporation
12.14 Teledyne Technologies Incorporated
12.15 Vitronic GmbH
12.16 Flir Systems
List of Tables
1 Global Surface Inspection Market Outlook, By Region (2022-2030) ($MN)
2 Global Surface Inspection Market Outlook, By Surface Type (2022-2030) ($MN)
3 Global Surface Inspection Market Outlook, By 2D Surface Inspection (2022-2030) ($MN)
4 Global Surface Inspection Market Outlook, By 3D Surface Inspection (2022-2030) ($MN)
5 Global Surface Inspection Market Outlook, By System (2022-2030) ($MN)
6 Global Surface Inspection Market Outlook, By Computer-Based Systems (2022-2030) ($MN)
7 Global Surface Inspection Market Outlook, By Camera-Based Systems (2022-2030) ($MN)
8 Global Surface Inspection Market Outlook, By Deployment Type (2022-2030) ($MN)
9 Global Surface Inspection Market Outlook, By Robotic Cells (2022-2030) ($MN)
10 Global Surface Inspection Market Outlook, By Traditional Systems (2022-2030) ($MN)
11 Global Surface Inspection Market Outlook, By Component (2022-2030) ($MN)
12 Global Surface Inspection Market Outlook, By Software (2022-2030) ($MN)
13 Global Surface Inspection Market Outlook, By Hardware (2022-2030) ($MN)
14 Global Surface Inspection Market Outlook, By Cameras (2022-2030) ($MN)
15 Global Surface Inspection Market Outlook, By Lighting Equipment (2022-2030) ($MN)
16 Global Surface Inspection Market Outlook, By Processors (2022-2030) ($MN)
17 Global Surface Inspection Market Outlook, By Optics (2022-2030) ($MN)
18 Global Surface Inspection Market Outlook, By Frame Grabbers (2022-2030) ($MN)
19 Global Surface Inspection Market Outlook, By Other Components (2022-2030) ($MN)
20 Global Surface Inspection Market Outlook, By Application (2022-2030) ($MN)
21 Global Surface Inspection Market Outlook, By Automotive (2022-2030) ($MN)
22 Global Surface Inspection Market Outlook, By Electronics & Semiconductors (2022-2030) ($MN)
23 Global Surface Inspection Market Outlook, By Pharmaceuticals (2022-2030) ($MN)
24 Global Surface Inspection Market Outlook, By Food & Beverage (2022-2030) ($MN)
25 Global Surface Inspection Market Outlook, By Packaging (2022-2030) ($MN)
26 Global Surface Inspection Market Outlook, By Aerospace & Defense (2022-2030) ($MN)
27 Global Surface Inspection Market Outlook, By Textiles (2022-2030) ($MN)
28 Global Surface Inspection Market Outlook, By Glass & Ceramics (2022-2030) ($MN)
29 Global Surface Inspection Market Outlook, By Other Applications (2022-2030) ($MN)
Note: Tables for North America, Europe, APAC, South America, and Middle East & Africa Regions are also represented in the same manner as above.
List of Figures
RESEARCH METHODOLOGY

We at ‘Stratistics’ opt for an extensive research approach which involves data mining, data validation, and data analysis. The various research sources include in-house repository, secondary research, competitor’s sources, social media research, client internal data, and primary research.
Our team of analysts prefers the most reliable and authenticated data sources in order to perform the comprehensive literature search. With access to most of the authenticated data bases our team highly considers the best mix of information through various sources to obtain extensive and accurate analysis.
Each report takes an average time of a month and a team of 4 industry analysts. The time may vary depending on the scope and data availability of the desired market report. The various parameters used in the market assessment are standardized in order to enhance the data accuracy.
Data Mining
The data is collected from several authenticated, reliable, paid and unpaid sources and is filtered depending on the scope & objective of the research. Our reports repository acts as an added advantage in this procedure. Data gathering from the raw material suppliers, distributors and the manufacturers is performed on a regular basis, this helps in the comprehensive understanding of the products value chain. Apart from the above mentioned sources the data is also collected from the industry consultants to ensure the objective of the study is in the right direction.
Market trends such as technological advancements, regulatory affairs, market dynamics (Drivers, Restraints, Opportunities and Challenges) are obtained from scientific journals, market related national & international associations and organizations.
Data Analysis
From the data that is collected depending on the scope & objective of the research the data is subjected for the analysis. The critical steps that we follow for the data analysis include:
- Product Lifecycle Analysis
- Competitor analysis
- Risk analysis
- Porters Analysis
- PESTEL Analysis
- SWOT Analysis
The data engineering is performed by the core industry experts considering both the Marketing Mix Modeling and the Demand Forecasting. The marketing mix modeling makes use of multiple-regression techniques to predict the optimal mix of marketing variables. Regression factor is based on a number of variables and how they relate to an outcome such as sales or profits.
Data Validation
The data validation is performed by the exhaustive primary research from the expert interviews. This includes telephonic interviews, focus groups, face to face interviews, and questionnaires to validate our research from all aspects. The industry experts we approach come from the leading firms, involved in the supply chain ranging from the suppliers, distributors to the manufacturers and consumers so as to ensure an unbiased analysis.
We are in touch with more than 15,000 industry experts with the right mix of consultants, CEO's, presidents, vice presidents, managers, experts from both supply side and demand side, executives and so on.
The data validation involves the primary research from the industry experts belonging to:
- Leading Companies
- Suppliers & Distributors
- Manufacturers
- Consumers
- Industry/Strategic Consultants
Apart from the data validation the primary research also helps in performing the fill gap research, i.e. providing solutions for the unmet needs of the research which helps in enhancing the reports quality.
For more details about research methodology, kindly write to us at info@strategymrc.com
Frequently Asked Questions
In case of any queries regarding this report, you can contact the customer service by filing the “Inquiry Before Buy” form available on the right hand side. You may also contact us through email: info@strategymrc.com or phone: +1-301-202-5929
Yes, the samples are available for all the published reports. You can request them by filling the “Request Sample” option available in this page.
Yes, you can request a sample with your specific requirements. All the customized samples will be provided as per the requirement with the real data masked.
All our reports are available in Digital PDF format. In case if you require them in any other formats, such as PPT, Excel etc you can submit a request through “Inquiry Before Buy” form available on the right hand side. You may also contact us through email: info@strategymrc.com or phone: +1-301-202-5929
We offer a free 15% customization with every purchase. This requirement can be fulfilled for both pre and post sale. You may send your customization requirements through email at info@strategymrc.com or call us on +1-301-202-5929.
We have 3 different licensing options available in electronic format.
- Single User Licence: Allows one person, typically the buyer, to have access to the ordered product. The ordered product cannot be distributed to anyone else.
- 2-5 User Licence: Allows the ordered product to be shared among a maximum of 5 people within your organisation.
- Corporate License: Allows the product to be shared among all employees of your organisation regardless of their geographical location.
All our reports are typically be emailed to you as an attachment.
To order any available report you need to register on our website. The payment can be made either through CCAvenue or PayPal payments gateways which accept all international cards.
We extend our support to 6 months post sale. A post sale customization is also provided to cover your unmet needs in the report.
Request Customization
We offer complimentary customization of up to 15% with every purchase. To share your customization requirements, feel free to email us at info@strategymrc.com or call us on +1-301-202-5929. .
Please Note: Customization within the 15% threshold is entirely free of charge. If your request exceeds this limit, we will conduct a feasibility assessment. Following that, a detailed quote and timeline will be provided.
WHY CHOOSE US ?

Assured Quality
Best in class reports with high standard of research integrity

24X7 Research Support
Continuous support to ensure the best customer experience.

Free Customization
Adding more values to your product of interest.

Safe & Secure Access
Providing a secured environment for all online transactions.

Trusted by 600+ Brands
Serving the most reputed brands across the world.