
Touch Screen Display Market
Touch Screen Display Market Forecasts to 2030 - Global Analysis By Product (Monitors, Signage Displays, POS Terminals, Kiosks, Open Frame Touchscreen Displays, Medical Displays and Other Products), Screen Type (Capacitive Touch Screens, Resistive Touch Screens, Optical, Infrared Touch Screens, Surface Acoustic Wave Type Displays and Other Screen Types), Application, End User and By Geography

|
Years Covered |
2021-2030 |
|
Estimated Year Value (2023) |
US $80.01 BN |
|
Projected Year Value (2030) |
US $224.79 BN |
|
CAGR (2023 - 2030) |
15.9% |
|
Regions Covered |
North America, Europe, Asia Pacific, South America, and Middle East & Africa |
|
Countries Covered |
US, Canada, Mexico, Germany, UK, Italy, France, Spain, Japan, China, India, Australia, New Zealand, South Korea, Rest of Asia Pacific, South America, Argentina, Brazil, Chile, Middle East & Africa, Saudi Arabia, UAE, Qatar, and South Africa |
|
Largest Market |
Asia Pacific |
|
Highest Growing Market |
North America |
According to Stratistics MRC, the Global Touch Screen Display Market is accounted for $80.01 billion in 2023 and is expected to reach $224.79 billion by 2030 growing at a CAGR of 15.9% during the forecast period. A touch screen is a type of display that enables a user to communicate with a computer using either their finger or a stylus. It is a useful substitute for using a mouse or keyboard to navigate a graphical user interface. Displays for computers and laptops, mobile phones, tablets, cash registers, and information kiosks are just a few examples of devices that have touch screens. Additionally, some touch displays use a grid of infrared beams instead of touch sensors to detect the presence of a finger. These are broken down into resistive, capacitive touch, infrared, optical, and other types, like surface acoustic waves.
According to PC Magazine, a touch screen is a display screen that is sensitive to the touch of a finger or stylus. Widely used on ATM machines, retail point-of-sale terminals, car navigation systems, medical monitors and industrial control panels, the touch screen became wildly popular on handhelds after Apple introduced the iPhone in 2007.
Market Dynamics:
Driver:
Rising demand for tablets and smartphones
The widespread use of smartphones and tablets has transformed how people work, communicate, and access information. Modern mobile devices now all have touch screens, which enable simple user interactions and seamless navigation. One of the main factors driving the expansion of the touch screen display market has been consumer demand for feature-rich smartphones and tablets with larger, high-resolution touch screens. Additionally, the growing affordability of smartphones in emerging markets has accelerated the adoption of touch-enabled technology worldwide.
Restraint:
Expensive production costs
Touch screen display manufacturing required a number of complex steps, specialized materials, and precise machinery, all of which increased production costs. Modern touch screen technologies, like capacitive and in-cell displays, were more expensive than conventional display technologies because they needed intricate fabrication processes. However, the cost factor made it difficult for manufacturers to offer touch-screen devices at competitive prices, particularly in markets where consumers were looking for less expensive options.
Opportunity:
Growing demand for IoT devices with touch capabilities
The Internet of Things (IoT) was growing quickly, with connected devices becoming more common in a variety of businesses and homes. For managing and controlling Internet of Things (IoT) devices, touch-screen displays provided an easy-to-use and interactive interface. Moreover, Touch screen producers and developers had numerous opportunities to profit from this expanding market thanks to the incorporation of touch screens into smart home appliances, wearable technology, industrial IoT equipment, and healthcare devices.
Threat:
Improvements in gesture and voice controls
Touch screen displays in particular applications face an increasing threat from the development of voice recognition and gesture control technologies. Users might prefer using voice commands for some tasks, especially in hands-free situations, as voice assistants become more precise and capable. Users who wished to avoid direct contact with screens were drawn to gesture controls because they provided a simple and touch less method of interacting with gadgets. However, to respond to user preferences and shifting consumer demands, touch-screen display manufacturers had to adjust and incorporate these touch less alternatives.
Covid-19 Impact:
The COVID-19 pandemic had a conflicting effect on the market for touch-screen displays. On the one hand, users turned to touch less alternatives as traditional touch screens temporarily declined in use in some public settings due to worries about surface contamination and hygiene. However, the market for touch-screen laptops, tablets, and smart devices was supported by the rising demand for touch-enabled devices for remote work, online learning, and virtual communication. To address hygiene issues and improve user safety, manufacturers responded by implementing anti-microbial coatings, gesture controls, and voice interfaces.
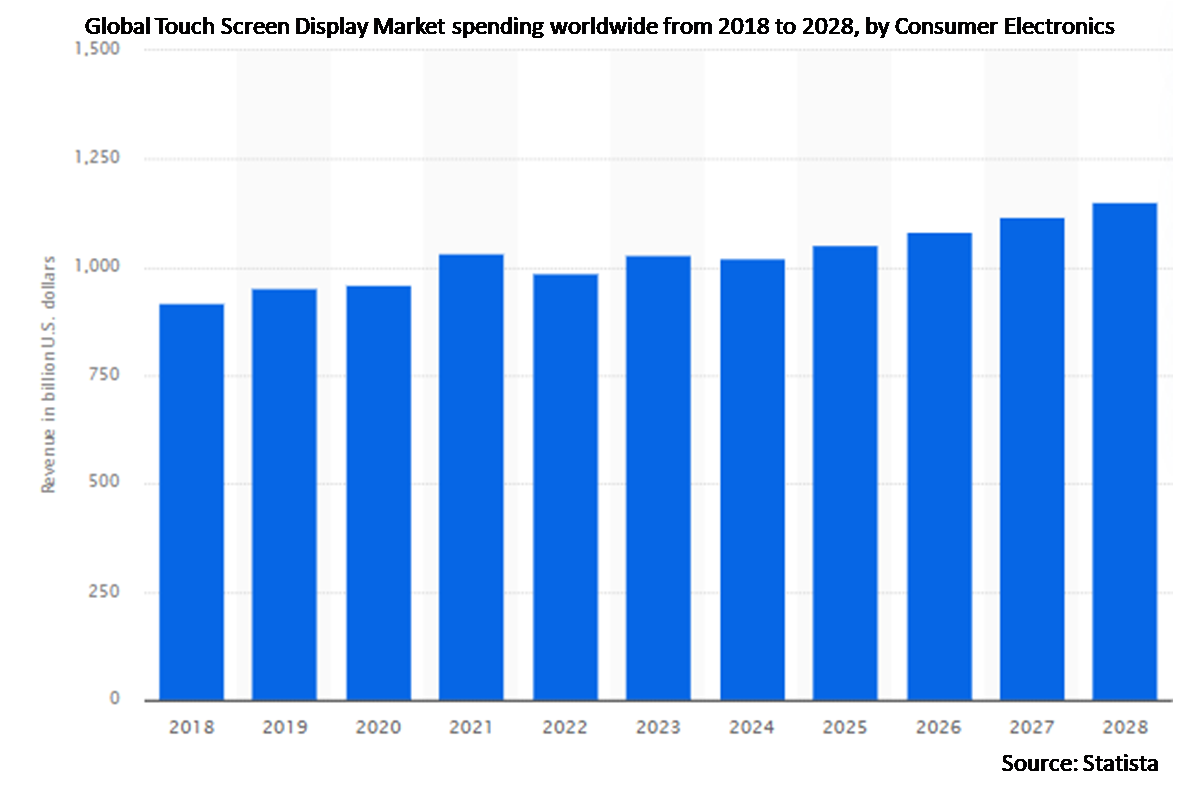
The consumer electronics segment is expected to be the largest during the forecast period
The consumer electronics segment is anticipated to have the largest market share for touch-screen displays. Sales of touch-screen displays were largely driven by consumer electronics like smartphones, tablets, laptops, smart watches, gaming consoles, and digital cameras. The demand for touch-screen displays was primarily driven by the widespread use of smartphones and tablets, which have become indispensable for modern communication, entertainment, and productivity. Additionally, the consumer electronics industry continued to be the biggest and most significant driver of the touch-screen display market as consumers sought out more immersive and interactive experiences.
The residential segment is expected to have the highest CAGR during the forecast period
During the forecast period, the residential segment is anticipated to experience the highest CAGR. The growth is attributed to the rise in personal usage of smartphones, smart wearables, and other consumer electronics products with Projected Capacitive (PCAP) touch displays. Additionally, with integrated assembly options and high-capacity materials, consumer appliances and electronics are purpose-fit for product longevity and performance as a result of rapid urbanization, lifestyle changes, higher investment spending, and more consumers. Each of these has a positive impact on the use of touch-screen displays in the residential market.
Region with largest share:
The market for touch-screen displays is anticipated to have the largest share in the Asia-Pacific region. Numerous aspects contributed to the region's dominance, such as its thriving electronics manufacturing sector, high smartphone and consumer electronics adoption rates, and quick industrialization. Major suppliers and manufacturers of touch-screen displays are located in APAC, making it a significant hub for both production and innovation. APAC also benefited from the rising demand for touch-screen displays in industries such as industrial automation, automotive infotainment, tablets, smartphones, and automotive infotainment. In addition, the region's large population and rising disposable income encouraged the use of touch-screen technology, which helped explain its sizeable market share.
Region with highest CAGR:
During the forecast period, the touch-screen display market is expected to grow at the highest CAGR in North America. The significant presence of top technology firms and touch-screen display producers was one of many reasons for the area's rapid growth. Early adopters of touch screen technology; North America has widely incorporated touch screens into a variety of industries, including retail, healthcare, automotive, and industrial applications. In North America, there is still a high demand for touch-screen laptops, tablets, and smartphones, which has helped drive the market. Additionally, demand in the region was also boosted by the expanding use of touch-screen-based interactive displays in public spaces, educational institutions, and commercial settings.

Key players in the market
Some of the key players in Touch Screen Display market include Microsoft Corporation, Toshiba Corporation, Nissha Co., Ltd., Apple Inc., HannStar Display Corporation, Sony Corporation, Fujitsu Ltd., 3M Company, AU Optronics Corporation, Panasonic Holdings Corporation, Cypress Semiconductor Corporation., LG Electronics Inc., Planar Systems, Inc., American Industrial Systems Inc., NEC Corporation, Wintek Corporation, Samsung Electronics Co. Ltd., TPK Holding Co., Ltd., Atmel Corporation and Mitsubishi Electric Corporation
Key Developments:
In July 2023, Leidos a FORTUNE 500 science and technology leader announced that it has entered into a strategic collaboration agreement with Microsoft aimed at leveraging each company's unique strengths in the market to accelerate artificial intelligence (AI) transformation for new and existing customers in the public sector.
In July 2023, Apple Inc. has signed a new long-term patent license agreement with the Nokia Corporation Company. The new agreement will replace the current license, which is due to expire at the end of 2023, although the terms of the agreement were not disclosed.
In June 2023, Toshiba Digital Solutions Corporation and Classiq Technologies Ltd. (Classiq) signed a technology collaboration agreement in the gate-based quantum computing.
Products Covered:
• Monitors
• Signage Displays
• POS Terminals
• Kiosks
• Open Frame Touchscreen Displays
• Medical Displays
• Other Products
Screen Types Covered:
• Capacitive Touch Screens
• Resistive Touch Screens
• Optical
• Infrared Touch Screens
• Surface Acoustic Wave Type Displays
• Other Screen Types
Applications Covered:
• Display/Digital Signage
• Kiosks
• Personal Use
• Professional Use
• Automated Teller Machines (ATM)
• Gas Pumps
• Trade shows and Exhibitions
• Car Wash Centers
• Parking Terminals
• Sports Arenas
• Public Transport Kiosks
• Medical Equipment
• Consumer Electronics
• Other Applications
End Users Covered:
• Residential
• Commercial
• Industrial
• Other End Users
Regions Covered:
• North America
o US
o Canada
o Mexico
• Europe
o Germany
o UK
o Italy
o France
o Spain
o Rest of Europe
• Asia Pacific
o Japan
o China
o India
o Australia
o New Zealand
o South Korea
o Rest of Asia Pacific
• South America
o Argentina
o Brazil
o Chile
o Rest of South America
• Middle East & Africa
o Saudi Arabia
o UAE
o Qatar
o South Africa
o Rest of Middle East & Africa
What our report offers:
- Market share assessments for the regional and country-level segments
- Strategic recommendations for the new entrants
- Covers Market data for the years 2021, 2022, 2023, 2026, and 2030
- Market Trends (Drivers, Constraints, Opportunities, Threats, Challenges, Investment Opportunities, and recommendations)
- Strategic recommendations in key business segments based on the market estimations
- Competitive landscaping mapping the key common trends
- Company profiling with detailed strategies, financials, and recent developments
- Supply chain trends mapping the latest technological advancements
Free Customization Offerings:
All the customers of this report will be entitled to receive one of the following free customization options:
• Company Profiling
o Comprehensive profiling of additional market players (up to 3)
o SWOT Analysis of key players (up to 3)
• Regional Segmentation
o Market estimations, Forecasts and CAGR of any prominent country as per the client's interest (Note: Depends on feasibility check)
• Competitive Benchmarking
Benchmarking of key players based on product portfolio, geographical presence, and strategic alliances
Table of Contents
1 Executive Summary
2 Preface
2.1 Abstract
2.2 Stake Holders
2.3 Research Scope
2.4 Research Methodology
2.4.1 Data Mining
2.4.2 Data Analysis
2.4.3 Data Validation
2.4.4 Research Approach
2.5 Research Sources
2.5.1 Primary Research Sources
2.5.2 Secondary Research Sources
2.5.3 Assumptions
3 Market Trend Analysis
3.1 Introduction
3.2 Drivers
3.3 Restraints
3.4 Opportunities
3.5 Threats
3.6 Product Analysis
3.7 Application Analysis
3.8 End User Analysis
3.9 Emerging Markets
3.10 Impact of Covid-19
4 Porters Five Force Analysis
4.1 Bargaining power of suppliers
4.2 Bargaining power of buyers
4.3 Threat of substitutes
4.4 Threat of new entrants
4.5 Competitive rivalry
5 Global Touch Screen Display Market, By Product
5.1 Introduction
5.2 Monitors
5.3 Signage Displays
5.4 POS Terminals
5.5 Kiosks
5.6 Open Frame Touchscreen Displays
5.7 Medical Displays
5.8 Other Products
6 Global Touch Screen Display Market, By Screen Type
6.1 Introduction
6.2 Capacitive Touch Screens
6.3 Resistive Touch Screens
6.4 Optical
6.5 Infrared Touch Screens
6.6 Surface Acoustic Wave Type Displays
6.7 Other Screen Types
7 Global Touch Screen Display Market, By Application
7.1 Introduction
7.2 Display/Digital Signage
7.3 Kiosks
7.4 Personal Use
7.5 Professional Use
7.6 Automated Teller Machines (ATM)
7.7 Gas Pumps
7.8 Trade shows and Exhibitions
7.9 Car Wash Centers
7.10 Parking Terminals
7.11 Sports Arenas
7.12 Public Transport Kiosks
7.13 Medical Equipment
7.14 Consumer Electronics
7.14.1 Laptops & Tablets
7.14.2 Smart Television
7.14.3 Smartphones & Smart Wearables
7.15 Other Applications
8 Global Touch Screen Display Market, By End User
8.1 Introduction
8.2 Residential
8.3 Commercial
8.4 Industrial
8.5 Other End Users
9 Global Touch Screen Display Market, By Geography
9.1 Introduction
9.2 North America
9.2.1 US
9.2.2 Canada
9.2.3 Mexico
9.3 Europe
9.3.1 Germany
9.3.2 UK
9.3.3 Italy
9.3.4 France
9.3.5 Spain
9.3.6 Rest of Europe
9.4 Asia Pacific
9.4.1 Japan
9.4.2 China
9.4.3 India
9.4.4 Australia
9.4.5 New Zealand
9.4.6 South Korea
9.4.7 Rest of Asia Pacific
9.5 South America
9.5.1 Argentina
9.5.2 Brazil
9.5.3 Chile
9.5.4 Rest of South America
9.6 Middle East & Africa
9.6.1 Saudi Arabia
9.6.2 UAE
9.6.3 Qatar
9.6.4 South Africa
9.6.5 Rest of Middle East & Africa
10 Key Developments
10.1 Agreements, Partnerships, Collaborations and Joint Ventures
10.2 Acquisitions & Mergers
10.3 New Product Launch
10.4 Expansions
10.5 Other Key Strategies
11 Company Profiling
11.1 Microsoft Corporation
11.2 Toshiba Corporation
11.3 Nissha Co., Ltd.
11.4 Apple Inc.
11.5 HannStar Display Corporation
11.6 Sony Corporation
11.7 Fujitsu Ltd.
11.8 3M Company
11.9 AU Optronics Corporation
11.10 Panasonic Holdings Corporation
11.11 Cypress Semiconductor Corporation.
11.12 LG Electronics Inc.
11.13 Planar Systems, Inc.
11.14 American Industrial Systems Inc.
11.15 NEC Corporation
11.16 Wintek Corporation
11.17 Samsung Electronics Co. Ltd.
11.18 TPK Holding Co., Ltd.
11.19 Atmel Corporation
11.20 Mitsubishi Electric Corporation
List of Tables
1 Global Touch Screen Display Market Outlook, By Region (2021-2030) ($MN)
2 Global Touch Screen Display Market Outlook, By Product (2021-2030) ($MN)
3 Global Touch Screen Display Market Outlook, By Monitors (2021-2030) ($MN)
4 Global Touch Screen Display Market Outlook, By Signage Displays (2021-2030) ($MN)
5 Global Touch Screen Display Market Outlook, By POS Terminals (2021-2030) ($MN)
6 Global Touch Screen Display Market Outlook, By Kiosks (2021-2030) ($MN)
7 Global Touch Screen Display Market Outlook, By Open Frame Touchscreen Displays (2021-2030) ($MN)
8 Global Touch Screen Display Market Outlook, By Medical Displays (2021-2030) ($MN)
9 Global Touch Screen Display Market Outlook, By Other Products (2021-2030) ($MN)
10 Global Touch Screen Display Market Outlook, By Screen Type (2021-2030) ($MN)
11 Global Touch Screen Display Market Outlook, By Capacitive Touch Screens (2021-2030) ($MN)
12 Global Touch Screen Display Market Outlook, By Resistive Touch Screens (2021-2030) ($MN)
13 Global Touch Screen Display Market Outlook, By Optical (2021-2030) ($MN)
14 Global Touch Screen Display Market Outlook, By Infrared Touch Screens (2021-2030) ($MN)
15 Global Touch Screen Display Market Outlook, By Surface Acoustic Wave Type Displays (2021-2030) ($MN)
16 Global Touch Screen Display Market Outlook, By Other Screen Types (2021-2030) ($MN)
17 Global Touch Screen Display Market Outlook, By Application (2021-2030) ($MN)
18 Global Touch Screen Display Market Outlook, By Display/Digital Signage (2021-2030) ($MN)
19 Global Touch Screen Display Market Outlook, By Kiosks (2021-2030) ($MN)
20 Global Touch Screen Display Market Outlook, By Personal Use (2021-2030) ($MN)
21 Global Touch Screen Display Market Outlook, By Professional Use (2021-2030) ($MN)
22 Global Touch Screen Display Market Outlook, By Automated Teller Machines (ATM) (2021-2030) ($MN)
23 Global Touch Screen Display Market Outlook, By Gas Pumps (2021-2030) ($MN)
24 Global Touch Screen Display Market Outlook, By Trade shows and Exhibitions (2021-2030) ($MN)
25 Global Touch Screen Display Market Outlook, By Car Wash Centers (2021-2030) ($MN)
26 Global Touch Screen Display Market Outlook, By Parking Terminals (2021-2030) ($MN)
27 Global Touch Screen Display Market Outlook, By Sports Arenas (2021-2030) ($MN)
28 Global Touch Screen Display Market Outlook, By Public Transport Kiosks (2021-2030) ($MN)
29 Global Touch Screen Display Market Outlook, By Medical Equipment (2021-2030) ($MN)
30 Global Touch Screen Display Market Outlook, By Consumer Electronics (2021-2030) ($MN)
31 Global Touch Screen Display Market Outlook, By Laptops & Tablets (2021-2030) ($MN)
32 Global Touch Screen Display Market Outlook, By Smart Television (2021-2030) ($MN)
33 Global Touch Screen Display Market Outlook, By Smartphones & Smart Wearables (2021-2030) ($MN)
34 Global Touch Screen Display Market Outlook, By Other Applications (2021-2030) ($MN)
35 Global Touch Screen Display Market Outlook, By End User (2021-2030) ($MN)
36 Global Touch Screen Display Market Outlook, By Residential (2021-2030) ($MN)
37 Global Touch Screen Display Market Outlook, By Commercial (2021-2030) ($MN)
38 Global Touch Screen Display Market Outlook, By Industrial (2021-2030) ($MN)
39 Global Touch Screen Display Market Outlook, By Other End Users (2021-2030) ($MN)
Note: Tables for North America, Europe, APAC, South America, and Middle East & Africa Regions are also represented in the same manner as above.
List of Figures
RESEARCH METHODOLOGY

We at ‘Stratistics’ opt for an extensive research approach which involves data mining, data validation, and data analysis. The various research sources include in-house repository, secondary research, competitor’s sources, social media research, client internal data, and primary research.
Our team of analysts prefers the most reliable and authenticated data sources in order to perform the comprehensive literature search. With access to most of the authenticated data bases our team highly considers the best mix of information through various sources to obtain extensive and accurate analysis.
Each report takes an average time of a month and a team of 4 industry analysts. The time may vary depending on the scope and data availability of the desired market report. The various parameters used in the market assessment are standardized in order to enhance the data accuracy.
Data Mining
The data is collected from several authenticated, reliable, paid and unpaid sources and is filtered depending on the scope & objective of the research. Our reports repository acts as an added advantage in this procedure. Data gathering from the raw material suppliers, distributors and the manufacturers is performed on a regular basis, this helps in the comprehensive understanding of the products value chain. Apart from the above mentioned sources the data is also collected from the industry consultants to ensure the objective of the study is in the right direction.
Market trends such as technological advancements, regulatory affairs, market dynamics (Drivers, Restraints, Opportunities and Challenges) are obtained from scientific journals, market related national & international associations and organizations.
Data Analysis
From the data that is collected depending on the scope & objective of the research the data is subjected for the analysis. The critical steps that we follow for the data analysis include:
- Product Lifecycle Analysis
- Competitor analysis
- Risk analysis
- Porters Analysis
- PESTEL Analysis
- SWOT Analysis
The data engineering is performed by the core industry experts considering both the Marketing Mix Modeling and the Demand Forecasting. The marketing mix modeling makes use of multiple-regression techniques to predict the optimal mix of marketing variables. Regression factor is based on a number of variables and how they relate to an outcome such as sales or profits.
Data Validation
The data validation is performed by the exhaustive primary research from the expert interviews. This includes telephonic interviews, focus groups, face to face interviews, and questionnaires to validate our research from all aspects. The industry experts we approach come from the leading firms, involved in the supply chain ranging from the suppliers, distributors to the manufacturers and consumers so as to ensure an unbiased analysis.
We are in touch with more than 15,000 industry experts with the right mix of consultants, CEO's, presidents, vice presidents, managers, experts from both supply side and demand side, executives and so on.
The data validation involves the primary research from the industry experts belonging to:
- Leading Companies
- Suppliers & Distributors
- Manufacturers
- Consumers
- Industry/Strategic Consultants
Apart from the data validation the primary research also helps in performing the fill gap research, i.e. providing solutions for the unmet needs of the research which helps in enhancing the reports quality.
For more details about research methodology, kindly write to us at info@strategymrc.com
Frequently Asked Questions
In case of any queries regarding this report, you can contact the customer service by filing the “Inquiry Before Buy” form available on the right hand side. You may also contact us through email: info@strategymrc.com or phone: +1-301-202-5929
Yes, the samples are available for all the published reports. You can request them by filling the “Request Sample” option available in this page.
Yes, you can request a sample with your specific requirements. All the customized samples will be provided as per the requirement with the real data masked.
All our reports are available in Digital PDF format. In case if you require them in any other formats, such as PPT, Excel etc you can submit a request through “Inquiry Before Buy” form available on the right hand side. You may also contact us through email: info@strategymrc.com or phone: +1-301-202-5929
We offer a free 15% customization with every purchase. This requirement can be fulfilled for both pre and post sale. You may send your customization requirements through email at info@strategymrc.com or call us on +1-301-202-5929.
We have 3 different licensing options available in electronic format.
- Single User Licence: Allows one person, typically the buyer, to have access to the ordered product. The ordered product cannot be distributed to anyone else.
- 2-5 User Licence: Allows the ordered product to be shared among a maximum of 5 people within your organisation.
- Corporate License: Allows the product to be shared among all employees of your organisation regardless of their geographical location.
All our reports are typically be emailed to you as an attachment.
To order any available report you need to register on our website. The payment can be made either through CCAvenue or PayPal payments gateways which accept all international cards.
We extend our support to 6 months post sale. A post sale customization is also provided to cover your unmet needs in the report.
Request Customization
We offer complimentary customization of up to 15% with every purchase. To share your customization requirements, feel free to email us at info@strategymrc.com or call us on +1-301-202-5929. .
Please Note: Customization within the 15% threshold is entirely free of charge. If your request exceeds this limit, we will conduct a feasibility assessment. Following that, a detailed quote and timeline will be provided.
WHY CHOOSE US ?

Assured Quality
Best in class reports with high standard of research integrity

24X7 Research Support
Continuous support to ensure the best customer experience.

Free Customization
Adding more values to your product of interest.

Safe & Secure Access
Providing a secured environment for all online transactions.

Trusted by 600+ Brands
Serving the most reputed brands across the world.