
Urban Mobility Data Analytics And Predictive Routing Market
Urban Mobility Data Analytics and Predictive Routing Market Forecasts to 2034 - Global Analysis By Component (Software Platforms, Services and Hardware & IoT Devices), Application, End User and By Geography

|
Years Covered |
2023-2034 |
|
Estimated Year Value (2026) |
US $3.01 BN |
|
Projected Year Value (2034) |
US $11.40 BN |
|
CAGR (2026-2034) |
18.1% |
|
Regions Covered |
North America, Europe, Asia Pacific, South America, and Rest of the World (RoW) |
|
Countries Covered |
United States, Canada, Mexico, United Kingdom, Germany, France, Italy, Spain, Netherlands, Belgium, Sweden, Switzerland, Poland, Rest of Europe, China, Japan, India, South Korea, Australia, Indonesia, Thailand, Malaysia, Singapore, Vietnam, Rest of Asia Pacific, Brazil, Argentina, Colombia, Chile, Peru, Rest of South America, Saudi Arabia, United Arab Emirates, Qatar, Israel, Rest of Middle East, South Africa, Egypt, Morocco, and Rest of Africa. |
|
Largest Market |
North America |
|
Highest Growing Market |
Asia Pacific |
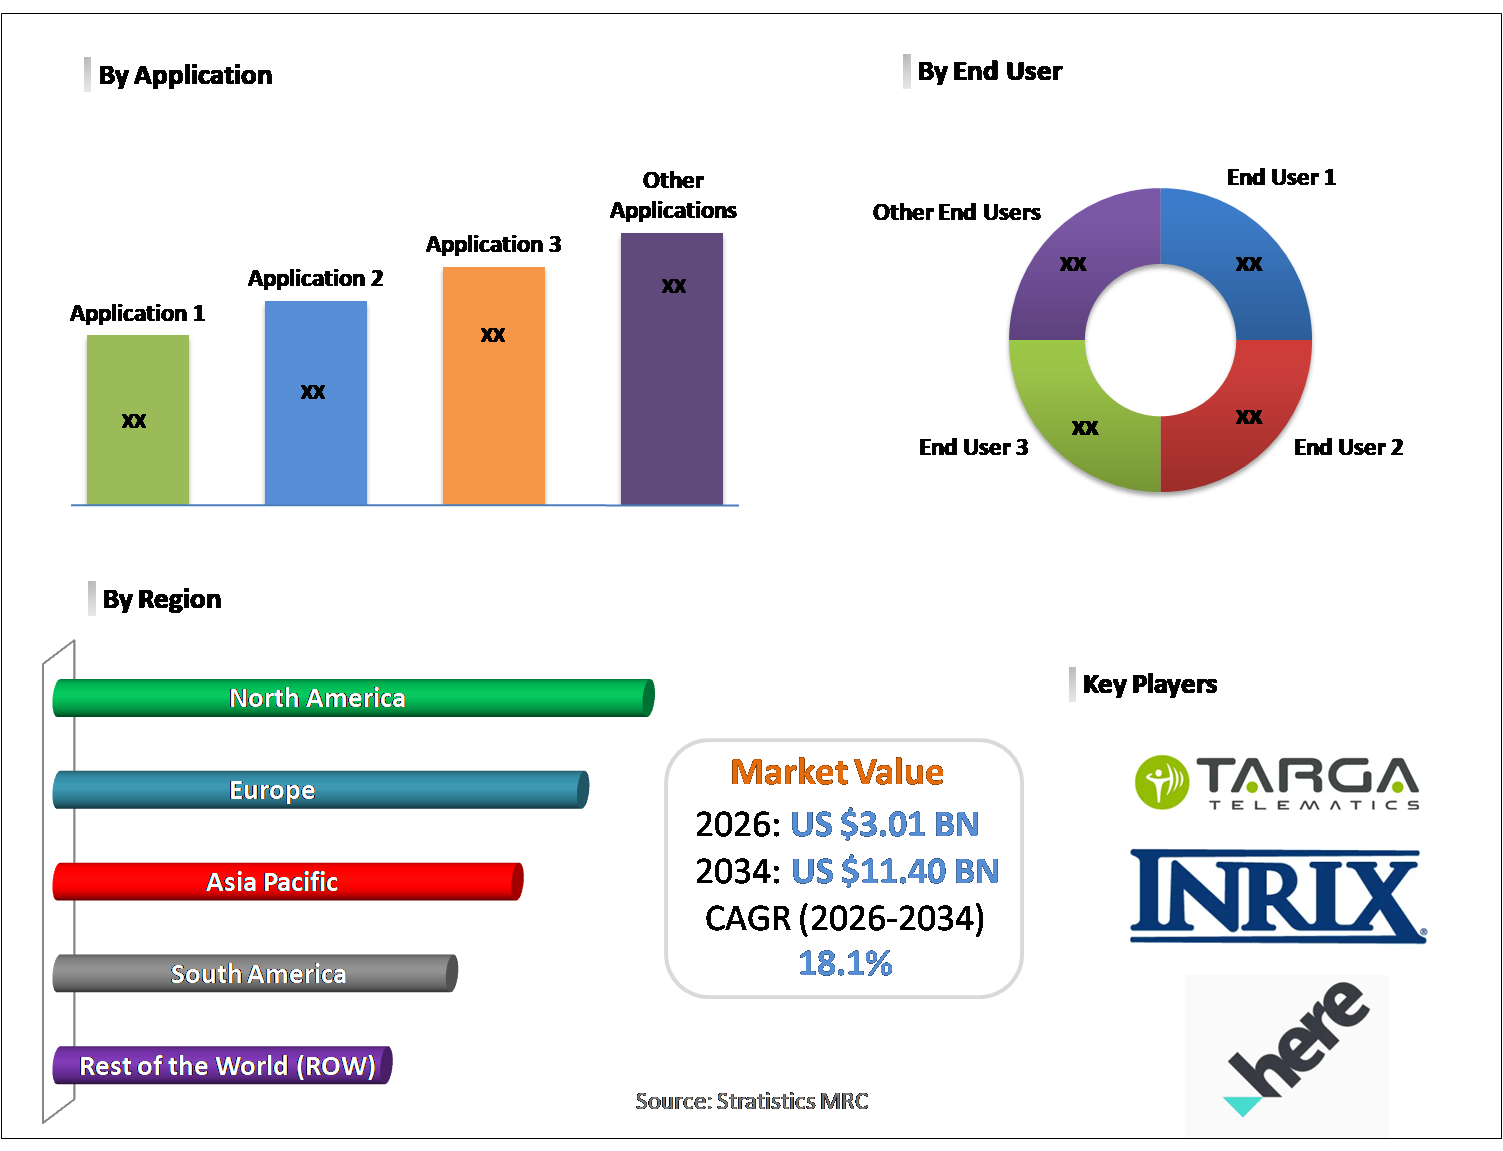
According to Stratistics MRC, the Global Urban Mobility Data Analytics and Predictive Routing Market is accounted for $3.01 billion in 2026 and is expected to reach $11.40 billion by 2034 growing at a CAGR of 18.1% during the forecast period. Urban mobility data analytics and predictive routing utilize collected transport data to enhance traffic management and commuter convenience. Through evaluation of information gathered from navigation systems, mobile platforms, roadside sensors, and connected cars, intelligent models detect movement trends and anticipate roadway conditions. Predictive routing technologies continuously adjust suggested paths by considering congestion levels, incidents, climate factors, and shifting demand. These systems assist in optimizing public transportation, improving shared mobility services, and advancing smart city development. Overall, they contribute to reduced fuel consumption, minimized environmental impact, shorter travel durations, and more informed urban transport planning.
According to Future Transportation Journal (2025), deep learning models applied to traffic flow prediction reduced forecasting error rates by up to 23% compared to traditional statistical methods, highlighting the efficiency gains possible in predictive routing for smart cities.
Market Dynamics:
Driver:
Growing urbanization and traffic congestion
The rapid expansion of urban populations is leading to heavier traffic and strained transportation networks. Increased private vehicle use and insufficient infrastructure intensify congestion in cities. Urban mobility analytics and predictive routing platforms address these issues by evaluating traffic behavior and predicting peak pressure points. Using live data from navigation devices, connected cars, and roadside sensors, these systems recommend optimized travel routes and support proactive traffic management. As cities expand further, authorities and mobility providers increasingly rely on intelligent analytics tools to streamline movement, minimize commute times, and improve overall transport efficiency, accelerating market growth.
Restraint:
High implementation and infrastructure costs
Establishing predictive routing and mobility analytics platforms involves considerable capital expenditure on hardware, networking systems, and advanced analytical tools. Integrating modern digital solutions with existing transportation infrastructure often demands complex technical modifications. Many cities, particularly in emerging economies, struggle with limited funding to support such projects. Ongoing maintenance, technology upgrades, and specialized workforce training add to long-term operational expenses. These cost pressures can discourage rapid implementation and slow investment decisions. Therefore, substantial financial requirements continue to act as a key limitation for widespread market penetration.
Opportunity:
Expansion of mobility-as-a-service (MaaS) platforms
The increasing adoption of MaaS frameworks offers promising prospects for predictive mobility systems. By combining buses, trains, shared vehicles, and micro-mobility options into single digital platforms, MaaS depends heavily on data-driven coordination. Predictive routing tools evaluate travel behavior, optimize route combinations, and support dynamic pricing strategies. These capabilities enable smoother, more convenient travel experiences for users. As urban planners promote integrated transportation solutions, mobility operators seek advanced analytics to synchronize services and tailor offerings. The continued development of MaaS environments significantly strengthens opportunities within the mobility analytics market.
Threat:
Dependence on reliable data quality
Predictive mobility technologies require consistent and precise information to deliver accurate route optimization. Gaps in data collection, outdated information, or technical malfunctions may result in flawed forecasting outcomes. Inaccurate recommendations can negatively affect user experience and confidence in the system. Malfunctioning sensors or unstable communication networks further compromise performance reliability. Since these platforms depend extensively on uninterrupted data flows, any decline in information quality can weaken system effectiveness. Therefore, challenges related to maintaining dependable data sources pose a serious threat to market sustainability.
Covid-19 Impact:
The outbreak of COVID-19 caused major shifts in urban travel behavior, influencing the mobility analytics and predictive routing sector. Movement restrictions, widespread adoption of remote working, and reduced commuting significantly lowered traffic congestion and transit ridership, temporarily limiting demand for routing solutions. Despite this slowdown, the pandemic highlighted the value of data-driven insights in transportation management. Governments utilized mobility analytics to track population movement and adapt transit operations to new safety requirements. During recovery phases, predictive routing became essential for handling unpredictable travel patterns, enabling safer, more flexible, and technology-driven urban mobility systems.
The software platforms segment is expected to be the largest during the forecast period
The software platforms segment is expected to account for the largest market share during the forecast period as they serve as the core engine for analysis, forecasting, and intelligent routing. By consolidating inputs from navigation tools, connected infrastructure, and mobility services, these systems convert complex datasets into practical operational strategies. Cloud computing, machine learning algorithms, and real-time analytics enhance flexibility and performance. Public agencies and mobility providers focus heavily on software solutions because they allow seamless upgrades, system integration, and scalable deployment. With growing emphasis on digital transformation in transportation, software platforms continue to represent the most influential and widely adopted segment.
The multimodal journey planning segment is expected to have the highest CAGR during the forecast period
Over the forecast period, the multimodal journey planning segment is predicted to witness the highest growth rate, supported by the rising preference for interconnected transport options. Urban travelers are increasingly blending buses, trains, shared vehicles, and micro-mobility services within single journeys. Advanced analytics systems facilitate real-time synchronization of schedules, route combinations, and pricing structures. Expansion of Mobility-as-a-Service platforms and sustainability-focused urban strategies further strengthen this trend. As digital integration and environmental priorities advance, comprehensive multimodal planning solutions are witnessing accelerated adoption and significant market momentum.
Region with largest share:
During the forecast period, the North America region is expected to hold the largest market share, supported by its well-developed technological ecosystem and proactive implementation of intelligent transport systems. High levels of connectivity, extensive use of smart devices, and robust digital networks contribute to widespread adoption of predictive routing solutions. Public sector initiatives promoting smart cities and environmentally sustainable transportation further accelerate demand. Continuous investments in AI-driven analytics, cloud platforms, and IoT-enabled infrastructure improve system efficiency and scalability. Strong partnerships between technology firms and transportation authority’s enable comprehensive deployment, positioning the region as the leading contributor to overall market share.
Region with highest CAGR:
Over the forecast period, the Asia Pacific region is anticipated to exhibit the highest CAGR due to accelerating urban development and expanding digital infrastructure investments. Rapid population growth in cities and increasing transportation demand are prompting authorities to implement smart mobility technologies. Regional governments are actively promoting intelligent traffic systems, connected mobility networks, and integrated transit management platforms. High mobile penetration and digital transformation initiatives enhance the adoption of analytics-based routing solutions. With ongoing modernization efforts and policy support, Asia-Pacific continues to emerge as the most dynamic and rapidly growing regional market.

Key players in the market
Some of the key players in Urban Mobility Data Analytics and Predictive Routing Market include Targa Telematics, INRIX, PTV Group, HERE Technologies, UrbanLogiq, Siemens Mobility, DataTerminal, SmartTraffic Solutions, MobilityInsight, TomTom, Moovit, Transit, FarEye, Ualabee, Transport Foundry, Via Transportation, Bentley Systems and Iteris.
Key Developments:
In February 2026, INRIX announced an expanded partnership with the Texas Department of Transportation (TxDOT) to deliver advanced traffic and safety insights statewide. Building on a 15-year collaboration, this new contract will help make travel across Texas safer, smarter, and more efficient for all road users.
In February 2026, Siemens Mobility and Stadler has officially confirmed the framework agreement signed with DSB for the delivery of 226 fully automated electric multiple units for the S-Bane suburban network in Copenhagen. The project is valued at approximately EUR 3 billion and will create the world’s largest open rail system with automatic train operation.
In October 2025, TomTom announced the expansion of its partnership with Hyundai AutoEver (HAE), the mobility software provider of the Hyundai Motor Group (HMG), further enhancing the driving experience for millions of HMG vehicles across Europe. This renewed agreement solidifies TomTom’s position as a maps supplier for HAE, integrating TomTom’s live services, including real-time traffic data and the newly awarded speed camera service, into Hyundai AutoEver’s navigation software to support all Hyundai Motor, Kia, and Genesis models in Europe over the next several years.
Components Covered:
• Software Platforms
• Services
• Hardware & IoT Devices
Applications Covered:
• Traffic Flow Optimization
• Fleet Management & Optimization
• Public Transit Scheduling & Routing
• Private Vehicle Predictive Navigation
• Smart Parking Management
• Multimodal Journey Planning
End Users Covered:
• Government & Municipal Authorities
• Private Mobility Operators
• Logistics & Delivery Companies
• Public Transport Agencies
• Urban Infrastructure Providers
Regions Covered:
• North America
o United States
o Canada
o Mexico
• Europe
o United Kingdom
o Germany
o France
o Italy
o Spain
o Netherlands
o Belgium
o Sweden
o Switzerland
o Poland
o Rest of Europe
• Asia Pacific
o China
o Japan
o India
o South Korea
o Australia
o Indonesia
o Thailand
o Malaysia
o Singapore
o Vietnam
o Rest of Asia Pacific
• South America
o Brazil
o Argentina
o Colombia
o Chile
o Peru
o Rest of South America
• Rest of the World (RoW)
o Middle East
§ Saudi Arabia
§ United Arab Emirates
§ Qatar
§ Israel
§ Rest of Middle East
o Africa
§ South Africa
§ Egypt
§ Morocco
§ Rest of Africa
What our report offers:
- Market share assessments for the regional and country-level segments
- Strategic recommendations for the new entrants
- Covers Market data for the years 2023, 2024, 2025, 2026, 2027, 2028, 2030, 2032 and 2034
- Market Trends (Drivers, Constraints, Opportunities, Threats, Challenges, Investment Opportunities, and recommendations)
- Strategic recommendations in key business segments based on the market estimations
- Competitive landscaping mapping the key common trends
- Company profiling with detailed strategies, financials, and recent developments
- Supply chain trends mapping the latest technological advancements
Free Customization Offerings:
All the customers of this report will be entitled to receive one of the following free customization options:
• Company Profiling
o Comprehensive profiling of additional market players (up to 3)
o SWOT Analysis of key players (up to 3)
• Regional Segmentation
o Market estimations, Forecasts and CAGR of any prominent country as per the client's interest (Note: Depends on feasibility check)
• Competitive Benchmarking
o Benchmarking of key players based on product portfolio, geographical presence, and strategic alliances
Table of Contents
1 Executive Summary
1.1 Market Snapshot and Key Highlights
1.2 Growth Drivers, Challenges, and Opportunities
1.3 Competitive Landscape Overview
1.4 Strategic Insights and Recommendations
2 Research Framework
2.1 Study Objectives and Scope
2.2 Stakeholder Analysis
2.3 Research Assumptions and Limitations
2.4 Research Methodology
2.4.1 Data Collection (Primary and Secondary)
2.4.2 Data Modeling and Estimation Techniques
2.4.3 Data Validation and Triangulation
2.4.4 Analytical and Forecasting Approach
3 Market Dynamics and Trend Analysis
3.1 Market Definition and Structure
3.2 Key Market Drivers
3.3 Market Restraints and Challenges
3.4 Growth Opportunities and Investment Hotspots
3.5 Industry Threats and Risk Assessment
3.6 Technology and Innovation Landscape
3.7 Emerging and High-Growth Markets
3.8 Regulatory and Policy Environment
3.9 Impact of COVID-19 and Recovery Outlook
4 Competitive and Strategic Assessment
4.1 Porter's Five Forces Analysis
4.1.1 Supplier Bargaining Power
4.1.2 Buyer Bargaining Power
4.1.3 Threat of Substitutes
4.1.4 Threat of New Entrants
4.1.5 Competitive Rivalry
4.2 Market Share Analysis of Key Players
4.3 Product Benchmarking and Performance Comparison
5 Global Urban Mobility Data Analytics and Predictive Routing Market, By Component
5.1 Software Platforms
5.2 Services
5.3 Hardware & IoT Devices
6 Global Urban Mobility Data Analytics and Predictive Routing Market, By Application
6.1 Traffic Flow Optimization
6.2 Fleet Management & Optimization
6.3 Public Transit Scheduling & Routing
6.4 Private Vehicle Predictive Navigation
6.5 Smart Parking Management
6.6 Multimodal Journey Planning
7 Global Urban Mobility Data Analytics and Predictive Routing Market, By End User
7.1 Government & Municipal Authorities
7.2 Private Mobility Operators
7.3 Logistics & Delivery Companies
7.4 Public Transport Agencies
7.5 Urban Infrastructure Providers
8 Global Urban Mobility Data Analytics and Predictive Routing Market, By Geography
8.1 North America
8.1.1 United States
8.1.2 Canada
8.1.3 Mexico
8.2 Europe
8.2.1 United Kingdom
8.2.2 Germany
8.2.3 France
8.2.4 Italy
8.2.5 Spain
8.2.6 Netherlands
8.2.7 Belgium
8.2.8 Sweden
8.2.9 Switzerland
8.2.10 Poland
8.2.11 Rest of Europe
8.3 Asia Pacific
8.3.1 China
8.3.2 Japan
8.3.3 India
8.3.4 South Korea
8.3.5 Australia
8.3.6 Indonesia
8.3.7 Thailand
8.3.8 Malaysia
8.3.9 Singapore
8.3.10 Vietnam
8.3.11 Rest of Asia Pacific
8.4 South America
8.4.1 Brazil
8.4.2 Argentina
8.4.3 Colombia
8.4.4 Chile
8.4.5 Peru
8.4.6 Rest of South America
8.5 Rest of the World (RoW)
8.5.1 Middle East
8.5.1.1 Saudi Arabia
8.5.1.2 United Arab Emirates
8.5.1.3 Qatar
8.5.1.4 Israel
8.5.1.5 Rest of Middle East
8.5.2 Africa
8.5.2.1 South Africa
8.5.2.2 Egypt
8.5.2.3 Morocco
8.5.2.4 Rest of Africa
9 Strategic Market Intelligence
9.1 Industry Value Network and Supply Chain Assessment
9.2 White-Space and Opportunity Mapping
9.3 Product Evolution and Market Life Cycle Analysis
9.4 Channel, Distributor, and Go-to-Market Assessment
10 Industry Developments and Strategic Initiatives
10.1 Mergers and Acquisitions
10.2 Partnerships, Alliances, and Joint Ventures
10.3 New Product Launches and Certifications
10.4 Capacity Expansion and Investments
10.5 Other Strategic Initiatives
11 Company Profiles
11.1 Targa Telematics
11.2 INRIX
11.3 PTV Group
11.4 HERE Technologies
11.5 UrbanLogiq
11.6 Siemens Mobility
11.7 DataTerminal
11.8 SmartTraffic Solutions
11.9 MobilityInsight
11.10 TomTom
11.11 Moovit
11.12 Transit
11.13 FarEye
11.14 Ualabee
11.15 Transport Foundry
11.16 Via Transportation
11.17 Bentley Systems
11.18 Iteris
List of Tables
1 Global Urban Mobility Data Analytics and Predictive Routing Market Outlook, By Region (2023-2034) ($MN)
2 Global Urban Mobility Data Analytics and Predictive Routing Market Outlook, By Component (2023-2034) ($MN)
3 Global Urban Mobility Data Analytics and Predictive Routing Market Outlook, By Software Platforms (2023-2034) ($MN)
4 Global Urban Mobility Data Analytics and Predictive Routing Market Outlook, By Services (2023-2034) ($MN)
5 Global Urban Mobility Data Analytics and Predictive Routing Market Outlook, By Hardware & IoT Devices (2023-2034) ($MN)
6 Global Urban Mobility Data Analytics and Predictive Routing Market Outlook, By Application (2023-2034) ($MN)
7 Global Urban Mobility Data Analytics and Predictive Routing Market Outlook, By Traffic Flow Optimization (2023-2034) ($MN)
8 Global Urban Mobility Data Analytics and Predictive Routing Market Outlook, By Fleet Management & Optimization (2023-2034) ($MN)
9 Global Urban Mobility Data Analytics and Predictive Routing Market Outlook, By Public Transit Scheduling & Routing (2023-2034) ($MN)
10 Global Urban Mobility Data Analytics and Predictive Routing Market Outlook, By Private Vehicle Predictive Navigation (2023-2034) ($MN)
11 Global Urban Mobility Data Analytics and Predictive Routing Market Outlook, By Smart Parking Management (2023-2034) ($MN)
12 Global Urban Mobility Data Analytics and Predictive Routing Market Outlook, By Multimodal Journey Planning (2023-2034) ($MN)
13 Global Urban Mobility Data Analytics and Predictive Routing Market Outlook, By End User (2023-2034) ($MN)
14 Global Urban Mobility Data Analytics and Predictive Routing Market Outlook, By Government & Municipal Authorities (2023-2034) ($MN)
15 Global Urban Mobility Data Analytics and Predictive Routing Market Outlook, By Private Mobility Operators (2023-2034) ($MN)
16 Global Urban Mobility Data Analytics and Predictive Routing Market Outlook, By Logistics & Delivery Companies (2023-2034) ($MN)
17 Global Urban Mobility Data Analytics and Predictive Routing Market Outlook, By Public Transport Agencies (2023-2034) ($MN)
18 Global Urban Mobility Data Analytics and Predictive Routing Market Outlook, By Urban Infrastructure Providers (2023-2034) ($MN)
Note: Tables for North America, Europe, APAC, South America, and Rest of the World (RoW) Regions are also represented in the same manner as above.
List of Figures
RESEARCH METHODOLOGY

We at ‘Stratistics’ opt for an extensive research approach which involves data mining, data validation, and data analysis. The various research sources include in-house repository, secondary research, competitor’s sources, social media research, client internal data, and primary research.
Our team of analysts prefers the most reliable and authenticated data sources in order to perform the comprehensive literature search. With access to most of the authenticated data bases our team highly considers the best mix of information through various sources to obtain extensive and accurate analysis.
Each report takes an average time of a month and a team of 4 industry analysts. The time may vary depending on the scope and data availability of the desired market report. The various parameters used in the market assessment are standardized in order to enhance the data accuracy.
Data Mining
The data is collected from several authenticated, reliable, paid and unpaid sources and is filtered depending on the scope & objective of the research. Our reports repository acts as an added advantage in this procedure. Data gathering from the raw material suppliers, distributors and the manufacturers is performed on a regular basis, this helps in the comprehensive understanding of the products value chain. Apart from the above mentioned sources the data is also collected from the industry consultants to ensure the objective of the study is in the right direction.
Market trends such as technological advancements, regulatory affairs, market dynamics (Drivers, Restraints, Opportunities and Challenges) are obtained from scientific journals, market related national & international associations and organizations.
Data Analysis
From the data that is collected depending on the scope & objective of the research the data is subjected for the analysis. The critical steps that we follow for the data analysis include:
- Product Lifecycle Analysis
- Competitor analysis
- Risk analysis
- Porters Analysis
- PESTEL Analysis
- SWOT Analysis
The data engineering is performed by the core industry experts considering both the Marketing Mix Modeling and the Demand Forecasting. The marketing mix modeling makes use of multiple-regression techniques to predict the optimal mix of marketing variables. Regression factor is based on a number of variables and how they relate to an outcome such as sales or profits.
Data Validation
The data validation is performed by the exhaustive primary research from the expert interviews. This includes telephonic interviews, focus groups, face to face interviews, and questionnaires to validate our research from all aspects. The industry experts we approach come from the leading firms, involved in the supply chain ranging from the suppliers, distributors to the manufacturers and consumers so as to ensure an unbiased analysis.
We are in touch with more than 15,000 industry experts with the right mix of consultants, CEO's, presidents, vice presidents, managers, experts from both supply side and demand side, executives and so on.
The data validation involves the primary research from the industry experts belonging to:
- Leading Companies
- Suppliers & Distributors
- Manufacturers
- Consumers
- Industry/Strategic Consultants
Apart from the data validation the primary research also helps in performing the fill gap research, i.e. providing solutions for the unmet needs of the research which helps in enhancing the reports quality.
For more details about research methodology, kindly write to us at info@strategymrc.com
Frequently Asked Questions
In case of any queries regarding this report, you can contact the customer service by filing the “Inquiry Before Buy” form available on the right hand side. You may also contact us through email: info@strategymrc.com or phone: +1-301-202-5929
Yes, the samples are available for all the published reports. You can request them by filling the “Request Sample” option available in this page.
Yes, you can request a sample with your specific requirements. All the customized samples will be provided as per the requirement with the real data masked.
All our reports are available in Digital PDF format. In case if you require them in any other formats, such as PPT, Excel etc you can submit a request through “Inquiry Before Buy” form available on the right hand side. You may also contact us through email: info@strategymrc.com or phone: +1-301-202-5929
We offer a free 15% customization with every purchase. This requirement can be fulfilled for both pre and post sale. You may send your customization requirements through email at info@strategymrc.com or call us on +1-301-202-5929.
We have 3 different licensing options available in electronic format.
- Single User Licence: Allows one person, typically the buyer, to have access to the ordered product. The ordered product cannot be distributed to anyone else.
- 2-5 User Licence: Allows the ordered product to be shared among a maximum of 5 people within your organisation.
- Corporate License: Allows the product to be shared among all employees of your organisation regardless of their geographical location.
All our reports are typically be emailed to you as an attachment.
To order any available report you need to register on our website. The payment can be made either through CCAvenue or PayPal payments gateways which accept all international cards.
We extend our support to 6 months post sale. A post sale customization is also provided to cover your unmet needs in the report.
Request Customization
We offer complimentary customization of up to 15% with every purchase. To share your customization requirements, feel free to email us at info@strategymrc.com or call us on +1-301-202-5929. .
Please Note: Customization within the 15% threshold is entirely free of charge. If your request exceeds this limit, we will conduct a feasibility assessment. Following that, a detailed quote and timeline will be provided.
WHY CHOOSE US ?

Assured Quality
Best in class reports with high standard of research integrity

24X7 Research Support
Continuous support to ensure the best customer experience.

Free Customization
Adding more values to your product of interest.

Safe & Secure Access
Providing a secured environment for all online transactions.

Trusted by 600+ Brands
Serving the most reputed brands across the world.